UNITED STATES
SECURITIES AND EXCHANGE COMMISSION
Washington, D.C. 20549
______________________________
FORM
ANNUAL REPORT PURSUANT TO SECTION 13 OR 15(d) OF THE SECURITIES EXCHANGE ACT OF 1934 | |
For the fiscal year ended | |
OR | |
TRANSITION REPORT PURSUANT TO SECTION 13 OR 15(d) OF THE SECURITIES EXCHANGE ACT OF 1934 | |
For the transition period from | to |
Commission file number | |
(Exact name of registrant as specified in its charter) | |
(State or other jurisdiction of incorporation or organization) | (I.R.S. Employer Identification No.) |
(Address of principal executive offices) | (Zip Code) |

Registrant’s telephone number, including area code (
______________________________
Securities registered pursuant to Section 12(b) of the Act:
Title of each class | Trading Symbol | Name of each exchange on which registered |
| ||
Securities registered pursuant to Section 12(g) of the Act: None
______________________________
Indicate by check mark if the registrant is a well-known seasoned issuer, as defined in Rule 405 of the Securities Act. Yes No ☐
Indicate by check mark if the registrant is not required to file reports pursuant to Section 13 or Section 15(d) of the Act. Yes ☐ No
Indicate by check mark whether the registrant (1) has filed all reports required to be filed by Section 13 or 15(d) of the Securities Exchange Act of 1934 during the preceding 12 months (or for such shorter period that the registrant was required to file such reports), and (2) has been subject to such filing requirements for the past 90 days. Yes No ☐
Indicate by check mark whether the registrant has submitted electronically every Interactive Data File required to be submitted pursuant to Rule 405 of Regulation S-T (§232.405 of this chapter) during the preceding 12 months (or for such shorter period that the registrant was required to submit such files). Yes No ☐
Indicate by check mark whether the registrant is a large accelerated filer, an accelerated filer, a non-accelerated filer, a smaller reporting company, or an emerging growth company. See the definitions of “large accelerated filer,” “accelerated filer,” “smaller reporting company” and “emerging growth company” in Rule 12b-2 of the Exchange Act.
☑ |
|
|
| Accelerated filer ☐ |
Non-accelerated filer ☐ |
|
|
| Smaller reporting company |
|
|
|
| Emerging growth company |
If an emerging growth company, indicate by check mark if the registrant has elected not to use the extended transition period for complying with any new or revised financial accounting standards provided pursuant to Section 13(a) of the Exchange Act. ☐
Indicate by check mark whether the registrant has filed a report on and attestation to its management’s assessment of the effectiveness of its internal control over financial reporting under Section 404(b) of the Sarbanes-Oxley Act (15 U.S.C. 7262(b)) by the registered public accounting firm that prepared or issued its audit report.
Indicate by check mark whether the registrant is a shell company (as defined in Rule 12b-2 of the Act). Yes ☐ No
The aggregate market value of the voting and nonvoting common equity held by nonaffiliates of the registrant (based on the closing price of the registrant’s most recently completed second fiscal quarter) was approximately $,
As of February 8, 2022, there were outstanding
DOCUMENTS INCORPORATED BY REFERENCE
Document of the Registrant | Form 10-K Reference Locations |
Portions of the registrant’s definitive proxy statement for the 2022 Annual Meeting of Shareholders | Part II, Item 5 and Part III, Items 10, 11, 12, 13 and 14 |
|
|
AMERICAN INTERNATIONAL GROUP, INC.
ANNUAL REPORT ON FORM 10-K FOR THE YEAR ENDED DECEMBER 31, 2021
TABLE OF CONTENTS
Form 10-K
AIG | 2021 Form 10-K 1
Part I
ITEM 1 | Business
| |
|
|
Maximizing Industry Leadership and Global Footprint
|
Creating Value through Profitable Growth and a Culture of Underwriting and Operational Excellence |

American International Group, Inc. (AIG) is a leading global insurance organization. We provide a wide range of property casualty insurance, life insurance, retirement solutions and other financial services to customers in approximately 70 countries and jurisdictions. These diverse offerings include products and services that help businesses and individuals protect their assets, manage risks and provide for retirement security. AIG common stock is listed on the New York Stock Exchange. In 2021, AIG delivered strong financial results in General Insurance and Life and Retirement while executing on strategic imperatives such as our capital management plan; the separation of Life and Retirement from AIG; and AIG 200, our global, multi-year effort focused on positioning AIG for the future. Additionally, AIG’s pivot in General Insurance from remediation to profitable growth through disciplined underwriting, new business development and renewals continues, as demonstrated through strong double-digit net premium written growth, improved retention across the portfolio and meaningful improvement in the combined ratio. The pursuit of excellence by AIG colleagues allowed us to accomplish all of this despite the global challenges faced as a result of COVID-19 and elevated catastrophic activity. |
In this Annual Report, unless otherwise mentioned or unless the context indicates otherwise, we use the terms “AIG,” the “Company,” “we,” “us” and “our” to refer to American International Group, Inc., a Delaware corporation, and its consolidated subsidiaries. We use the term “AIG Parent” to refer solely to American International Group, Inc., and not to any of its consolidated subsidiaries.
2 AIG | 2021 Form 10-K
About AIG
World-Class Insurance Franchises that are among the leaders in their geographies and segments, providing differentiated service and expertise. | Breadth of Loyal Customers including millions of clients and policyholders ranging from multi-national Fortune 500 companies to individuals throughout the world. | Broad and Long-Standing Distribution Relationships with brokers, agents, advisors, banks and other distributors strengthened through AIG’s dedication to quality. |
Highly Engaged Global Workforce of more than 36,000 colleagues committed to excellence who are providing services in approximately 70 countries and jurisdictions. | Balance Sheet Strength and Financial Flexibility as demonstrated by over $65 billion in shareholders’ equity and AIG Parent liquidity sources of $15.2 billion as of December 31, 2021. |
2022 Priorities
Underwriting Excellence, Pricing Discipline and Clarity of Risk Appetite – Continue to enhance General Insurance portfolio optimization through strength of underwriting framework and guidelines as well as clear communication of risk appetite and rate adequacy. Continue long-standing disciplined approach in Life and Retirement with respect to product pricing and features. |
| Separation of Life and Retirement Business from AIG – Continue progress on the separation of the Life and Retirement business from AIG in a manner intended to maximize value for shareholders and other stakeholders and establish two strong, market-leading companies. |
|
|
|
AIG 200 – Continue progress on multi-year effort to support underwriting excellence, modernize our operating infrastructure, enhance user and customer experiences and become a more unified company. |
| Capital Management – Continue to reduce debt, return capital to shareholders and invest in AIG’s businesses through organic growth and operational improvements to create long-term shareholder value. |
|
|
|
Continued Focus on Profitable Growth – Build on the high-quality General Insurance portfolio achieved to date by focusing on targeted growth through continued underwriting discipline, improved retention and new business development. |
| Optimize Risk Management – Optimize risk profile through disciplined underwriting, reinsurance programs and asset-liability management in the investment portfolio. |
|
|
|
Leadership, Culture and Talent – Maintain focus on attracting, developing and retaining world-class employees. Further promote diversity, equity and inclusion at all levels through continued support of robust employee resource and development programs and recruitment strategies. |
| Transparent ESG Leadership – Continue strategic progress toward supporting a more sustainable, equitable and prosperous future for stakeholders by being an agent of positive change. |
AIG | 2021 Form 10-K 3
2021 Highlights
|
|
Strong General Insurance Performance Resulting from Significant Improvement in Global Commercial Lines Underwriting Results General Insurance achieved 2021 calendar year combined ratio of 95.8 compared to 104.3 in 2020, and sub-100 in every quarter of 2021 2021 accident year combined ratio, as adjusted(a) of 91.0 improved 3.1 points compared to 94.1 in 2020 Grew the top line while maintaining expense discipline with Net premiums written increasing 13 percent, Net premiums earned increasing 6 percent and the expense ratio improving 1.7 points | Continued Solid Contribution from Life and Retirement Along with Significant Separation Progress Life and Retirement increased 2021 Adjusted pre-tax income to $3.9 billion compared to $3.5 billion in 2020, despite unfavorable mortality from COVID-19, reflecting diversified product portfolio and balanced risk profile(b) Pension risk transfer issuance of $3.7 billion in 2021 exceeding $2.3 billion in 2020 Premiums and deposits(a) of $31.0 billion, excluding retail mutual funds, grew 18 percent reflecting growth in all three Individual Retirement product lines, strong pension risk transfer issuance and solid International Life sales 4 percent(c) growth in assets under administration to $409 billion driven by favorable equity markets and strong sales Announced and completed sale of 9.9 percent equity stake to Blackstone Inc. (Blackstone) |
| |
Capital Management Execution Complementing Operational Strength Returned $7.7 billion of capital to shareholders and creditors: Paid $1.1 billion of dividends Repurchased $2.6 billion of AIG common stock Reduced debt by $4.0 billion and lowered total debt and preferred stock to total capital ratio to 24.6 percent at December 31, 2021 | |
(a) Non-GAAP measure – for reconciliation of non-GAAP to GAAP measure see Part II, Item 7. Management’s Discussion and Analysis of Financial Condition and Results of Operations (MD&A).
(b) On October 26, 2020, AIG announced its intention to separate its Life and Retirement business from AIG.
(c) Excludes Retail Mutual Funds (i) transferred as part of the sale to Touchstone Investments or (ii) liquidated.
4 AIG | 2021 Form 10-K
Operating Structure
AIG reports the results of its businesses through three segments – General Insurance, Life and Retirement and Other Operations. General Insurance consists of two operating segments – North America and International. Life and Retirement consists of four operating segments – Individual Retirement, Group Retirement, Life Insurance and Institutional Markets. Other Operations is primarily comprised of corporate, our institutional asset management business and consolidation and eliminations.
Consistent with how we manage our business, our General Insurance North America operating segment primarily includes insurance businesses in the United States, Canada and Bermuda, and our global reinsurance business, AIG Re. Our General Insurance International operating segment includes regional insurance businesses in Japan, the United Kingdom, Europe, Middle East and Africa (EMEA region), Asia Pacific, Latin America and Caribbean, and China. International also includes the results of Talbot Holdings, Ltd. as well as AIG’s global specialty business.
For additional information on our business segments see Part II, Item 7. MD&A and Note 3 to the Consolidated Financial Statements, and for information regarding the separation of Life and Retirement see Note 1 to the Consolidated Financial Statements.
Business Segments
|
|
|
|
| General Insurance
General Insurance is a leading provider of insurance products and services for commercial and personal insurance customers. It includes one of the world’s most far-reaching property casualty networks. General Insurance offers a broad range of products to customers through a diversified, multichannel distribution network. Customers value General Insurance’s strong capital position, extensive risk management and claims experience and its ability to be a market leader in critical lines of the insurance business. | Life and Retirement
Life and Retirement is a unique franchise that brings together a broad portfolio of life insurance, retirement and institutional products offered through an extensive, multichannel distribution network. It holds long-standing, leading market positions in many of the markets it serves in the U.S. With its strong capital position, customer-focused service, breadth of product expertise and deep distribution relationships across multiple channels, Life and Retirement is well positioned to serve growing market needs. |
|
|
|
|
|
| General Insurance includes the following major operating companies: National Union Fire Insurance Company of Pittsburgh, Pa. (National Union); American Home Assurance Company (American Home); Lexington Insurance Company (Lexington); AIG General Insurance Company, Ltd. (AIG Sonpo); AIG Asia Pacific Insurance, Pte, Ltd.; AIG Europe S.A.; American International Group UK Ltd.; Validus Reinsurance, Ltd. (Validus Re); Talbot Holdings Ltd. (Talbot); Western World Insurance Group, Inc. and Glatfelter Insurance Group (Glatfelter). | Life and Retirement includes the following major operating companies: American General Life Insurance Company (AGL); The Variable Annuity Life Insurance Company (VALIC); The United States Life Insurance Company in the City of New York (U.S. Life); Laya Healthcare Limited and AIG Life Limited. |
|
|
|
|
|
|
|
|
|
| Other Operations
Other Operations primarily consists of income from assets held by AIG Parent and other corporate subsidiaries, deferred tax assets related to tax attributes, corporate expenses and intercompany eliminations, our institutional asset management business and results of our consolidated investment entities, General Insurance portfolios in run-off as well as the historical results of our legacy insurance lines ceded to Fortitude Reinsurance Company Ltd. (Fortitude Re). |
| |


AIG | 2021 Form 10-K 5
Diversified Mix of Businesses
(dollars in millions)
|
(a) Our Total revenues were $52.1 billion in 2021. The graph above represents Adjusted revenues. For reconciliation of Adjusted revenues to Total revenues see Note 3 to the Consolidated Financial Statements.
(b) General Insurance adjusted revenues is comprised of $11.0 billion and $14.1 billion of Net premiums earned in North America and International, respectively, and $3.3 billion in Net investment income.
(c) On October 26, 2020, we announced our intention to separate our Life and Retirement business from AIG.
Geographic Concentration
In 2021, 5.9 percent of our property casualty direct premiums were written in the state of California, and 13.6 percent and 6.9 percent were written in Japan and the United Kingdom, respectively. No other state or foreign jurisdiction accounted for more than five percent of our property casualty direct premiums.
For additional information on our business segments see Note 3 to the Consolidated Financial Statements.
How We Generate Revenues and Profitability
We earn revenues primarily from insurance premiums, policy fees and income from investments.
Our expenses consist of policyholder benefits and losses incurred, interest credited to policyholders, commissions and other costs of selling and servicing our products, interest expense and general operating expenses.
Our profitability is dependent on our ability to properly price and manage risk on insurance and annuity products, to manage our portfolio of investments effectively and to control costs through expense discipline.
6 AIG | 2021 Form 10-K
Investment Activities of Our Insurance Operations
Our insurance companies generally receive premiums and deposits well in advance of paying covered claims or benefits. In the intervening periods, we invest these premiums and deposits to generate net investment income that, along with the invested funds, is available to pay claims or benefits. As a result, we generate significant revenues from insurance investment activities.
The practice for managing the investments of the insurance companies places primary emphasis on meeting the specific needs of each business unit. The investment objectives are the generation of investment income, preservation of capital, liquidity management and growth of surplus to support the insurance products. The majority of assets backing our insurance liabilities consist of fixed maturity securities issued by corporations, municipalities and other governmental agencies, as well as structured securities collateralized by, among other assets, residential and commercial real estate and commercial mortgage loans.
For additional information on investment strategies see Part II, Item 7. MD&A – Investments.
Loss Reserve Development Process
The liability for unpaid losses and loss adjustment expenses (loss reserves) represents the accumulation of estimates for unpaid claims, including estimates for claims incurred but not reported (IBNR) for our General Insurance companies and the related expenses of settling those losses.
The process of establishing loss reserves is complex and inherently imprecise because it must take into consideration many variables that are subject to the outcome of future events. As a result, informed subjective estimates and judgments about our ultimate exposure to losses are an integral component of our loss reserving process. Because reserve estimates are subject to the outcome of future events, changes in prior year estimates are unavoidable in the insurance industry. These changes are sometimes referred to as “prior year loss development”, “reserve development” or variations thereof.
For additional information on loss reserves and prior year loss development see Part II, Item 7. MD&A – Critical Accounting Estimates – Loss Reserves, Part II, Item 7. MD&A – Insurance Reserves – Loss Reserves, and Note 12 to the Consolidated Financial Statements.
AIG | 2021 Form 10-K 7
Human Capital Management
We believe that our people are our greatest strength. To this end, we place the highest importance on human capital management; namely attracting, developing and retaining high caliber talent committed to our journey to becoming a top performing company and fostering an inclusive environment in which we actively seek and embrace diverse thinking.
At December 31, 2021, we had approximately 36,600 employees based in approximately 50 countries, of which 48 percent are located in North America, 32 percent in the Asia Pacific region and the remaining 20 percent in the EMEA region and Latin America.
We believe that we foster a constructive and healthy work environment for our employees and colleagues. Some examples of key programs and initiatives that are designed to attract, develop and retain our diverse workforce include:
Competitive Compensation and Benefits. Under the oversight of the Compensation and Management Resources Committee of our Board of Directors (CMRC), we seek to align the compensation of our employees with individual and Company performance and provide the appropriate market-competitive incentives to attract, retain and motivate employees to achieve outstanding results.
Management and the CMRC engage the services of third-party compensation consultants and advisors to help us monitor the market competitiveness of our incentive programs. We provide a performance-driven compensation structure that consists of base salary and, for eligible employees, short- and long-term incentives. We also offer comprehensive benefits to support the health and wellness needs of our colleagues, including subsidized health care plans, life insurance and disability, wellness and mental health benefits, paid time off, paid volunteer time off, parental leave policies and matching 401(k) contributions and matching charitable donations, for eligible employees.
Health and Safety. AIG cares about the health and safety of its employees. Occupational safety and health is a shared responsibility between employees and corporate stakeholders, which we implement through our Global Safety and Environment policy. We take appropriate measures to prevent workplace injuries and illnesses, to provide a safe and healthy work environment, and to meet regulatory and duty of care responsibilities regarding the health, safety and welfare of employees engaging in AIG business activities. For example, in response to COVID-19 in 2020, we quickly and effectively transitioned 90 percent of our employees to remote work and established a cross-functional task force to ensure that AIG implemented best practices to protect the safety of colleagues while continuing to serve clients, distribution partners and other stakeholders. Where permitted by local laws and regulations, our offices are open to fully vaccinated employees, even so we have continued our work from home availability. Mask mandates, social distancing, and office capacity limits have been implemented to comply with local law. Additionally, we have strict quarantine and contact tracing protocols in place in the event a positive COVID-19 case occurs.
Nearly every country in which we operate has an Employee Assistance Program, which provides employees with mental health resources, including counseling sessions and webinars. We also funded a pandemic financial assistance program to provide financial assistance to employees in the form of low or no-interest loans. Further, in December 2020, we launched our Compassionate Colleagues Fund with an initial contribution of $2 million by AIG. The fund has helped more than 700 employees overcome serious financial hardships and disasters. Since then, voluntary employee donations together with company matches of these contributions have continued to grow the size of the fund designed to enable employees to help their fellow colleagues.
Talent Development. AIG is committed to offering a multitude of learning and development opportunities for our colleagues. AIG has developed numerous programs to foster leadership, growth and development opportunities for our employees. We believe that professional development is a positive investment in our talent. Our goal is to build our employees’ skills and fuel a culture of development, change agility, and transformational readiness across the Company through learning and development experiences. To support this, AIG provides colleagues with a centralized destination where they can access a personalized learning platform that includes a variety of programs to support employee growth. We have also developed a core, globally consistent curriculum that focuses on key skills that are important to our business and sets up colleagues for success in their career. In addition, we offer tuition, certification and training reimbursement programs to encourage employees to enhance their education, skills and knowledge for their continued growth.
The Company places significant importance and attention on promoting internal talent and succession planning. Accordingly, we review our talent development and succession plans for each of our functions and operating segments annually, to identify and develop a pipeline of diverse talent for positions at all levels of the organization. In 2021, we developed a globally consistent, streamlined process to encourage robust discussions around succession pipelines and the development of critical talent. In 2021, 28.3 percent of all our open positions were filled with internal talent.
8 AIG | 2021 Form 10-K
Diversity, Equity and Inclusion (DEI). AIG is committed to creating an inclusive workplace focused on attracting, retaining and developing diverse talent that fosters a culture of belonging for all employees. To that end, each member of the executive leadership team has a DEI objective embedded in their individual performance goals tied to their annual short-term incentive awards. In September 2020, AIG established an Executive Diversity Council, tasked with monitoring diversity, equity and inclusion initiatives as an integral part of AIG’s business strategies. In addition, in October 2020, AIG appointed a new Chief Diversity Officer to coordinate the Company’s efforts in creating meaningful strides as it relates to diversity, equity and inclusion. In 2021, the Executive Diversity Council conducted a comprehensive review of the Company’s global diversity representation aspirations and developed a plan to advance DEI objectives at AIG, including with respect to sourcing diverse talent at all levels of the organization. Management periodically reports to the CMRC on our various human capital management initiatives and metrics, including DEI.
AIG sponsors over 130 Employee Resource Groups (ERGs), which are groups of employees who come together based on a shared interest in a specific dimension of diversity in more than 40 countries. AIG’s global ERG network spans 13 different dimensions of diversity and is open to all employees. The ERGs are a cornerstone of our diversity, equity and inclusion efforts. Our ERGs represent and support our diverse workforce, connect peers, support wellness, enhance allyship, and create a culture of inclusion and engagement within AIG. AIG also provides training programs about conscious inclusion, unconscious bias and systemic racism and harassment awareness.
In addition, AIG has developed several company-wide leadership programs targeted at our diverse talent pool. AIG’s Women’s Executive Leadership Initiative and Executive Men’s Development Initiative (for men of color) seek to hone executive leadership skills of high-potential employees. Our Accelerated Leadership Development program matches mid-level individuals of color in AIG’s leadership pipeline with senior executive mentors who coach them on essential senior management and executive leadership skills. In 2021, General Insurance launched its Global Sponsorship Program, which builds upon the Accelerated Leadership Program by intentionally matching mid-level diverse employees with senior leaders across the General Insurance business unit to provide mentorship and leadership training. In Life and Retirement, the Life and Retirement Executive Group, which includes the top 125 leaders in the segment, are mentoring emerging and diverse talent.
Employee Engagement. AIG is committed to an engaged workforce. To improve our employee experience and assess the health of our organization, we periodically undertake cultural and employee engagement surveys. AIG conducted its first Organizational Health Index (OHI) survey in August of 2019 and its results were used to embed Health initiatives in the ten AIG 200 operational programs and provide leadership with a roadmap of the issues that were important to our colleagues. The second OHI survey was conducted in January 2021 with 77 percent of colleagues participating. It covered topics across multiple dimensions, including leadership, business operations and effectiveness, DEI and customer focus to gather colleague insights and ideas to inform initiatives across AIG. The 2021 results showed significant improvement across the Company with higher scores in many categories compared to 2019 results. Despite uncertainties presented by the pandemic, colleagues expressed appreciation for AIG’s effective transition to a remote work environment and the Company’s colleague-first approach, prioritizing their health and wellness. The 2021 results also highlighted modernizing the operating infrastructure as an area of opportunity. Through the AIG 200 effort, we have made progress on our Information Technology and Systems Modernization initiatives as well as established partnerships with select third parties to help us achieve a modern, digitally-enabled platform with true end-to-end processes to improve user experience.
AIG | 2021 Form 10-K 9
Regulation
OVERVIEW
Our operations are subject to regulation by many different types of regulatory authorities, including insurance, securities, derivatives and investment advisory and thrift regulators in the United States and abroad. The insurance and financial services industries are generally subject to close regulatory scrutiny and supervision. Insurance and other regulatory authorities and law enforcement agencies, attorneys general and other governmental authorities from time to time make inquiries and conduct examinations or investigations regarding our compliance, as well as compliance by other companies in our industry, with applicable laws.
We expect that the U.S. and international regulations applicable to us and our regulated entities will continue to evolve for the foreseeable future.
Legislators, regulators and self-regulatory organizations may also consider changes to existing laws or regulations impacting our business. See Item 1A. Risk Factors – Regulation – New laws and regulations or new interpretations of current laws and regulations, both domestically and internationally, may affect our business, results of operations, financial condition and ability to compete effectively.
Additionally, while the federal government does not directly regulate the insurance business, federal legislation and administrative policies in several areas, including pension regulation, age and sex discrimination, financial services regulation, securities regulation and federal taxation, can significantly affect the insurance industry and certain of our operations. See Item 1A. Risk Factors – Regulation – Our businesses are heavily regulated and changes in laws and regulations may affect our operations, increase our insurance subsidiary capital requirements or reduce our profitability.
U.S. REGULATION
Insurance Regulation. Together, our U.S. insurance subsidiaries are licensed to transact business, and are subject to extensive regulation and supervision by insurance regulators, in all 50 states, the District of Columbia, Guam, Puerto Rico and the U.S. Virgin Islands. The primary regulator of an insurance company, however, is located in its state of domicile.
We are subject to regulation under the insurance holding company laws of various jurisdictions. The insurance holding company laws and regulations vary from jurisdiction to jurisdiction, but generally require registration and periodic reporting by (re)insurance companies that are licensed in such jurisdictions and are controlled by other entities. Applicable legislation typically requires periodic disclosure concerning the entity that controls the registered insurer and the other companies in the holding company system as well as prior approval of intercompany transactions and transfers of assets, including in some instances payment of dividends by the (re)insurance subsidiary, within the holding company system. Insurance holding company laws also generally provide that no person, corporation or other entity may acquire control of an insurance company, or a controlling interest in any direct or indirect parent company of an insurance company, without the prior approval of such insurance company’s domiciliary state insurance regulator.
As a holding company with no significant business operations of our own, AIG Parent depends on dividends from our subsidiaries to meet our obligations. State insurance statutes typically place restrictions and limitations on the amount of dividends or other distributions payable by insurance company subsidiaries to their parent companies, as well as on transactions between an insurer and its affiliates. Dividends in excess of prescribed limits established by the applicable state regulations are considered to be extraordinary transactions and require prior approval or non-disapproval from the applicable insurance regulator.
Our U.S. (re)insurance subsidiaries are subject to regulation and supervision by the states and other jurisdictions in which they do business. The method of such regulation varies but generally has its source in statutes that delegate regulatory and supervisory powers to a state insurance official. The regulation and supervision relate primarily to the financial condition of the insurers and their corporate conduct and market conduct activities. This includes approval of policy forms and rates, the standards of solvency that must be met and maintained, including with respect to risk-based capital, the standards on transactions between (re)insurance company subsidiaries and their affiliates, including restrictions and limitations on the amount of dividends or other distributions payable by (re)insurance company subsidiaries to their parent companies, the licensing of insurers and their agents, deposits of securities for the benefit of policyholders, requirements for acceptability of reinsurers and the establishment of credit for reinsurance requirements, the form and content of reports of financial condition required to be filed, requirements for reserves and enterprise risk management and corporate governance requirements. Our (re)insurance subsidiaries are also subject to investments rules, which prescribe the type, quality and concentration of investments they can make, and on investment practices, such as derivatives, securities lending and repurchase transactions. In general, such regulation is for the protection of policyholders rather than the creditors or equity owners of these companies.
10 AIG | 2021 Form 10-K
Further, as part of their regulatory oversight process, state insurance departments conduct periodic examinations, generally once every three to five years, of the books, records, accounts and business practices of insurers domiciled in their states. Examinations are generally carried out in cooperation with the insurance regulators of other states where the insurer is licensed under guidelines promulgated by the National Association of Insurance Commissioners (NAIC). State and federal insurance and securities regulators and other state law enforcement agencies and attorneys general also, from time to time, make inquiries and conduct examinations or investigations regarding our compliance, as well as other companies in our industry, with, among other things, insurance laws and securities laws.
In recent years, insurance regulators have emphasized the investigation of alleged improper insurance pricing and sales practices by insurers, including, for example, race-based underwriting or sales practices, misleading sales presentations by insurance agents, targeting of the elderly or other vulnerable adults and the suitability of products for potential customers. Insurance regulators have also shown interest in the use of external data, algorithms and artificial intelligence in insurance practices, including underwriting, marketing, and claims practices.
Insurance regulators have also expressed concern around climate change risk and disclosure. Towards the end of 2021 the NAIC Climate and Resiliency Task Force Solvency Workstream issued an informal questionnaire to stakeholders on potential enhancements to existing regulatory tools relative to the solvency effects of climate change. The chief insurance regulators of a number of states, including New York, require insurance companies to respond to a survey on how they manage risks related to climate change. The NAIC also released a significantly expanded climate risk disclosure survey for consultation. While the NAIC is aiming to finalize the new survey format in 2022, the precise timing in terms of when insurance companies would be required to respond to the new survey and how it will interact with AIG’s other climate-related disclosures is not yet clear. The New York State Department of Financial Services (NYDFS) published final guidance on managing financial risks from climate change in November 2021, according to which New York-domiciled insurers are expected to integrate financial risks from climate change into their governance frameworks, risk management processes and business and investment strategies.
There can be no assurance that any noncompliance with such applicable laws, regulations or guidance would not have a material adverse effect on our business or results of operations.
NAIC Activities and Model Laws
In the United States, the NAIC is a standard-setting and regulatory support organization created and governed by the chief insurance regulators from the 50 states, the District of Columbia and five U.S. territories. The NAIC is not a regulator, but, with assistance from the NAIC, state insurance regulators establish standards and best practices, conduct peer reviews and coordinate regulatory oversight. The NAIC’s mandate is to benefit state insurance regulatory authorities and consumers by promulgating model insurance laws and regulations for adoption by the states. The NAIC also provides standardized insurance industry accounting and reporting guidance through the NAIC Accounting Manual. However, model insurance laws and regulations are only effective when adopted by the states, and NAIC statutory accounting and reporting principles may be modified by each state. Every state has adopted, in substantial part, the Risk-Based Capital (RBC) Model Law promulgated by the NAIC or a substantially similar law, which allows states to act upon the results of RBC calculations, and provides four incremental levels of regulatory action regarding insurers whose RBC calculations fall below specific thresholds. Those levels of action range from the requirement to submit a plan describing how an insurer would regain a specified RBC ratio to a mandatory regulatory takeover of the company. The RBC formula is designed to measure the adequacy of an insurer’s statutory surplus in relation to the risks inherent in its business. The RBC formula computes a risk-adjusted surplus level by applying discrete factors to various asset, premium, reserve and other financial statement items, or in the case of interest rate and equity return (C-3) market risk, applying stochastic scenario analyses. These factors are developed to be risk-sensitive so that higher RBC requirements are applied to items exposed to greater risk. In June 2021, the NAIC adopted changes to the RBC factors for bonds and real estate, which became effective on December 31, 2021. The modified bond and real estate factors are not expected to have a material impact on our RBC calculations. The statutory surplus of each of our U.S. domiciled (re)insurance companies exceeded RBC minimum required levels as of December 31, 2021. Statutory accounting principles promulgated by the NAIC, including for our insurance company subsidiaries, have been, or may be, modified by individual state laws, regulations and permitted practices granted by our domiciliary insurance regulators. Changes to the NAIC Accounting Manual or modifications by the various state insurance departments may impact the investment portfolios and the statutory capital and surplus of our U.S. insurance companies. If any of our (re)insurance entities fell below prescribed levels of statutory surplus, it would be our intention to provide appropriate capital or other types of support to that entity. For additional information, see Part II, Item 7. MD&A – Liquidity and Capital Resources – Liquidity and Capital Resources of AIG Parent and Subsidiaries – Insurance Companies.
AIG | 2021 Form 10-K 11
The NAIC’s Model Regulation “Valuation of Life Insurance Policies” (Regulation XXX) requires insurers to establish additional statutory reserves for term life insurance policies with long-term premium guarantees and universal life policies with secondary guarantees (ULSGs). NAIC Actuarial Guideline 38 (Guideline AXXX) clarifies the application of Regulation XXX as to these guarantees, including certain ULSGs. In December 2012, the NAIC approved a new Valuation Manual containing a principle-based approach to life insurance company reserves. Principle-based reserving (PBR) is designed to tailor the reserving process to more closely reflect the risks of specific products, rather than the factor-based approach employed historically. The Valuation Manual became effective on January 1, 2017, after revisions to the NAIC’s model Standard Valuation Law were enacted by the requisite number of states, representing the required premium volume. Subsection 20 of the Valuation Manual (VM-20) applies to individual life insurance reserves, most notably term insurance and ULSGs. VM-20 is also referred to as “Life PBR”, and replaces Regulation XXX and Guideline AXXX for new life insurance business issued after January 1, 2017. As permitted by applicable regulations, we deferred implementation of Life PBR until January 1, 2020, and have implemented it as of such date with respect to relevant policies issued on or after January 1, 2020. Variable Annuity (VA) reserving requirements, found in subsection 21 of the Valuation Manual (VM-21), replaced the previous Actuarial Guideline XLIII requirements. Substantial revisions to VM-21 became effective January 1, 2020, with options for early adoption or phased-in adoption. We applied VM-21 in full, effective January 1, 2020, to both new and existing VA business. VM-21 is also referred to as “VA PBR.” See Item 1A. Risk Factors – Reserves and Exposures – Reinsurance may be unavailable or too expensive relative to its benefit, and may not be adequate to protect us against losses and Note 18 to the Consolidated Financial Statements for risk and additional information related to these statutory reserving requirements.
The NAIC’s Insurance Holding Company System Regulatory Act (the Model Holding Company Act) and the Insurance Holding Company System Model Regulation include (i) provisions authorizing insurance commissioners to act as global group-wide supervisors for internationally active insurance groups and participate in international supervisory colleges, and (ii) the requirement that the ultimate controlling person of a U.S. insurer file an annual enterprise risk report with its lead state regulator identifying risks likely to have a material adverse effect upon the financial condition or liquidity of its licensed insurers or the insurance holding company system as a whole. All of the states where AIG has domestic insurers have enacted a version of the revised Model Holding Company Act, including the enterprise risk reporting requirement.
The NAIC’s Risk Management and Own Risk and Solvency Assessment Model Act (ORSA) requires that insurers maintain a risk management framework and conduct an internal own risk and solvency assessment of the insurer’s material risks in normal and stressed environments. All of the states where AIG has domestic insurers have enacted a version of ORSA. The NAIC has also adopted a Corporate Governance Annual Disclosure Model Act (CGAD) that requires insurers to submit an annual filing regarding their corporate governance structure, policies and practices. All of the states where AIG has domestic insurers have enacted a version of the CGAD.
The NAIC developed its Group Capital Calculation (GCC) for the supervision of insurance groups in the United States, which it adopted in December 2020. In May 2021, the NAIC determined that provisions of the December 2020 amendments to the Model Holding Company Act that authorize the GCC and liquidity stress testing (LST) will become accreditation standards, and thus states must adopt significant elements of the model to remain accredited. The LST applies to large life insurers based on a set of scope criteria. The purpose of LST is to support macroprudential surveillance, including to assess the potential impact on broader financial markets of aggregate asset sales within a liquidity stress scenario. The proposed effective date of the accreditation standard is January 1, 2026, though the NAIC plans to encourage states to implement the GCC provisions by November 7, 2022, the deadline by which U.S. states must adopt GCC requirements or face federal preemption in connection with “covered agreements” the United States reached with the EU and United Kingdom (UK) to address, among other things, group capital requirements (discussed under Dodd-Frank below). Certain states have already adopted the GCC requirements in their statutes. In 2021, the NAIC GCC Working Group conducted a GCC trial implementation using 2020 data with volunteer companies and their lead states.
State Guaranty Associations
U.S. states have state insurance guaranty associations in which insurers doing business in the state are required by law to be members. Member insurers may be assessed by the associations for certain obligations of insolvent insurance companies to policyholders and claimants. Typically, states assess member insurers in amounts related to the member’s proportionate share of the relevant type of business written by all members in the state. Some jurisdictions permit member insurers to recover assessments that they paid through full or partial premium tax offsets, usually over a period of years. The protection afforded by a state’s guaranty association to policyholders of insolvent insurers varies from state to state. The aggregate assessments levied against us have not been material to our financial condition in any of the past three years.
12 AIG | 2021 Form 10-K
Dodd-Frank
The Dodd-Frank Wall Street Reform and Consumer Protection Act (Dodd-Frank), signed into law in 2010, brought about extensive changes to financial regulation in the United States and established the Financial Stability Oversight Council (Council).
Dodd-Frank established the Federal Insurance Office (FIO) to serve as the central insurance authority in the federal government. While not serving a regulatory function, FIO performs certain duties related to the business of insurance and has authority to collect information on the insurance industry and recommend prudential standards. In addition, FIO monitors market access issues, represents the United States in international insurance forums, has authority to determine if certain regulations are preempted by covered agreements, and assists the Secretary of the Treasury in administering the Terrorism Risk Insurance Program under the Terrorism Risk Insurance Act of 2002.
Title V of Dodd-Frank authorizes the United States to enter into covered agreements with foreign governments or regulatory entities regarding the business of insurance and reinsurance. On September 22, 2017, the U.S. and the European Union (EU) entered into such an agreement, and on December 18, 2018, the U.S. signed a covered agreement with the UK, which is similar to the agreement with the EU. U.S. state regulators have five years from the dates the covered agreements were signed to adopt reinsurance reforms and group capital requirements that meet the prescribed conditions set forth in the applicable covered agreement or else state laws imposing such reinsurance collateral requirements may be subject to federal preemption, and Solvency II group capital requirements would apply to groups based in the United States. In June 2019, the NAIC adopted amendments to its credit for reinsurance model law and regulation to conform to the requirements of the covered agreements. In December 2020, the NAIC adopted a GCC that, if enacted by the states effective November 7, 2022, is expected to satisfy the conditions in the covered agreements. Certain states have already adopted the GCC requirements in their statutes.
Title VII of Dodd-Frank provides for significantly increased regulation of, and restrictions on, derivatives markets and transactions that have affected various activities of insurance and other financial services companies, including (i) regulatory reporting for swaps, including security-based swaps, (ii) mandated clearing through central counterparties and execution through regulated swap execution facilities for certain swaps (other than security-based swaps and (iii) margin and collateral requirements. Increased regulation of, and restrictions on, derivatives markets and transactions, including regulations related to initial margin for swaps and securities-based swaps, could increase the cost of our trading and hedging activities, reduce liquidity and reduce the availability of customized hedging solutions and derivatives.
Title II of Dodd-Frank (Orderly Liquidation Authority) provides that a financial company whose largest United States subsidiary is an insurer may be subject to a special orderly liquidation process outside the Bankruptcy Code. That process is to be administered by the Federal Deposit Insurance Corporation upon a determination that the company is: (i) in default or in danger of default, (ii) would have serious adverse effects on U.S. financial stability were it to fail and be resolved, (iii) is not likely to attract private sector alternatives to default and (iv) is not suitable for resolution under the Bankruptcy Code. Dodd-Frank authorizes possible assessments to cover the costs of any special resolution of a financial company conducted under Title II. U.S. insurance subsidiaries of any such financial company, however, would be subject to rehabilitation and liquidation proceedings under state insurance law.
ERISA
We provide products and services to certain employee benefit plans that are subject to the Employee Retirement Income Security Act of 1974, as amended (ERISA), and/or the Internal Revenue Code of 1986, as amended (the Internal Revenue Code). Plans subject to ERISA include certain pension and profit-sharing plans and welfare plans, including health, life and disability plans. As a result, our activities are subject to the restrictions imposed by ERISA and the Internal Revenue Code, including the requirement under ERISA that fiduciaries must perform their duties solely in the interests of ERISA plan participants and beneficiaries, and that fiduciaries may not cause a covered plan to engage in certain prohibited transactions. The applicable provisions of ERISA and the Internal Revenue Code are subject to enforcement by the Department of Labor (DOL), the Internal Revenue Service (IRS) and the Pension Benefit Guaranty Corporation.
Standard of Care Developments
We and our distributors are subject to laws and regulations regarding the standard of care applicable to sales of our products and the provision of advice to our customers. In recent years, many of these laws and regulations have been revised or reexamined while others have been newly adopted. We continue to closely follow these legislative and regulatory activities. Changes in standard of care requirements or new standards issued by governmental authorities, such as the DOL, the SEC, the NAIC or state regulators and/or legislators, have impacted, and may in the future impact, our businesses, results of operations and financial condition.
AIG | 2021 Form 10-K 13
DOL Fiduciary Rule
In June 2020, the DOL issued final guidance on the definition of a “fiduciary” for purposes of transactions with ERISA qualified plans, related plan participants and Individual Retirement Accounts (IRAs). The DOL’s final rule confirmed use of a five-part test for determining who is an investment advice fiduciary, and also confirmed related exemptions. In December 2020, the DOL issued the final version of a new prohibited transaction exemption, for parties that qualify as investment advice fiduciaries. This final version is intended to align broadly with the SEC’s Best Interest Regulation as well as other relevant standards of care requirements. See “SEC Best Interest Regulation”. The terms of the DOL’s exemption impose impartial conduct standards (including a best interest standard), as well as:
disclosure obligations,
a duty to establish, maintain, and follow policies and procedures intended to comply with the exemption, and
a duty to perform an annual retrospective review for compliance with the exemption.
We have reviewed the final DOL exemption and associated preamble, both for applicability and for the impact the exemption may have on our businesses and operations, including the scope of any applicable fiduciary status and duties. As a general matter, where fiduciary status would be applicable, we would expect to be able to utilize the processes and procedures we implemented for the SEC’s Best Interest Regulation to satisfy some or all of the corresponding provisions in the DOL guidance. Nevertheless, implementation may still result in increased compliance obligations and costs for certain of our businesses.
The DOL is reviewing issues relating to its regulation of fiduciary investment advice and may take further regulatory actions. Among other impacts of potential changes, amendments could have an adverse effect on sales of annuities through our independent distribution partners. We continue to monitor developments with respect to the DOL Fiduciary Rule and prohibited transactions exemptions.
SEC Best Interest Regulation
On June 30, 2020, Regulation Best Interest (Regulation BI), which establishes new rules regarding the standard of care a broker must meet when making a recommendation to a retail customer in connection with the sale of a security or other covered recommendation, and Form CRS, which requires enhanced disclosure by broker-dealers and investment advisers regarding client relationships and certain conflicts of interest issues, became effective. Both had been adopted by the SEC in June 2019 as part of a package of final rulemakings and interpretations, at the same time as the SEC issued two interpretations under the Investment Advisers Act of 1940. The first interpretation addressed the standard of conduct applicable to SEC-registered investment advisers, including details regarding the fiduciary duty owed to clients, required disclosures and the adviser’s continuous monitoring obligations. The second interpretation clarified when investment advice would be considered “solely incidental” to brokerage activity for purposes of the broker-dealer exclusion from SEC investment adviser registration. These two SEC interpretations became final upon publication. The SEC has also issued multiple sets of frequently asked questions (FAQs) on certain aspects of Regulation BI and Form CRS, and the SEC could provide additional guidance regarding these final rules.
We have evaluated the impact of the regulation on us and our customers, distribution partners and financial advisers, and have made significant investments to implement and enhance tools, processes and procedures, where needed, to comply with the final rules and interpretations. These efforts and enhancements have resulted in increased compliance costs and may impact sales results and increase regulatory and litigation risk, primarily for our Group Retirement business.
FINRA Standard of Care Development
Effective June 30, 2020, The Financial Industry Regulatory Authority (FINRA) Rule 2111 was amended to provide that FINRA’s suitability requirements do not apply to recommendations that are subject to Regulation BI. This amendment was intended to mitigate any potential confusion regarding which standard of conduct applies to retail consumers. FINRA’s suitability rules still apply to recommendations that are not covered by Regulation BI, such as recommendations to institutional customers.
State Standard of Care Developments
In February 2020, the NAIC adopted revisions to its Suitability in Annuity Transactions Model Regulation (#275) (NAIC Model) implementing a best interest standard of care applicable to sales and recommendations of annuities. The new NAIC Model conforms in large part to Regulation BI, providing that all recommendations by agents and insurers must be in the best interest of the consumer under known circumstances at the time an annuity recommendation is made, without placing agents’ or insurers’ financial interests ahead of the consumer’s interest in making a recommendation. Specifically, the NAIC Model requires agents and insurers to act with “reasonable diligence, care and skill” in making recommendations. The revisions also include enhancements to the current model’s supervision system to assist in compliance. Certain states have already adopted amendments to their suitability rules based on the NAIC Model revisions, and we expect that additional states will do so. We are closely monitoring these developments, including state-level variations from the NAIC Model. We are also implementing and enhancing processes and procedures, where needed, designed to comply with the NAIC Model and state-specific revisions.
14 AIG | 2021 Form 10-K
In addition, certain state insurance and/or securities regulators and legislatures have adopted, or are considering adopting, their own standards of conduct, some of which are broader in scope than the NAIC Model. For example, in July 2018, NYDFS adopted a best interest standard of care regulation applicable to annuity and life insurance transactions through issuance of the First Amendment to Insurance Regulation 187 – Suitability and Best Interests in Life Insurance and Annuity Transactions (Regulation 187). The compliance date for Regulation 187 was August 1, 2019 for annuity products and was February 1, 2020 for life insurance products. As amended, Regulation 187 requires producers to act in their client’s best interest when making point-of-sale and in-force recommendations, and provide in writing the basis for the recommendation, as well as the facts and analysis to support the recommendation. The amended regulation also imposes additional duties on life insurance companies in relation to these transactions, such as requiring insurers to establish and maintain procedures designed to prevent financial exploitation and abuse. In April 2021, the Appellate Division of the NYS Supreme Court, Third Department, overturned Regulation 187 for being unconstitutionally vague. In June 2021, the NYDFS appealed this ruling to the New York State Court of Appeals, which automatically granted a stay, meaning that Regulation 187 remains in effect pending a decision by the Court of Appeals. We have implemented and enhanced processes and procedures, where needed, designed to comply with this regulation.
Besides New York, other states have also adopted, or are considering adopting, legislative and/or regulatory proposals implementing fiduciary duty standards with applicability to insurance producers, agents, financial advisors, investment advisers, broker-dealers and/or insurance companies. The proposals vary in scope, applicability and timing of implementation. We are closely monitoring these developments and evaluating their potential impacts on our products and services, our customers, distribution partners and financial advisors, and the life and retirement industry overall in the United States.
Federal Retirement Legislation
SECURE Act
On December 20, 2019 the Setting Every Community Up for Retirement Enhancement Act (the SECURE Act) was signed into law. The SECURE Act includes many provisions affecting qualified contracts, some of which became effective upon enactment on January 1, 2020 or later, and some of which were retroactively effective. Some of the SECURE Act provisions that became effective on January 1, 2020, include, without limitation: an increase in the age at which required minimum distributions generally must commence, to age 72, from the previous age of 70 1/2; new limitations on the period for beneficiary distributions following the death of the plan participant or IRA owner; elimination of the age 70 1/2 restriction on IRA contributions (combined with an offset to the amount of eligible qualified charitable distributions by the amount of post-70 1/2 IRA contributions); a new exception to the 10 percent additional tax on early distributions for the birth or adoption of a child, which also became an allowable plan distribution event; and, reduction of the earliest permissible age for in-service distributions from pension plans and certain Section 457 plans to 59 1/2. We have implemented new processes and procedures, where needed, designed to comply with the new requirements.
COVID-19 Relief. The U.S. enacted federal legislation to mitigate the economic impacts of the COVID-19 pandemic in the Coronavirus Aid, Relief, and Economic Security (CARES) Act in March 2020, and the Consolidated Appropriations Act in December 2020. The two pieces of legislation contained provisions with impacts on retirement plans and products and services offered by Life Insurance, Individual Retirement and Group Retirement. We have evaluated the impacts of the collective legislation and have implemented processes where applicable. A number of the provisions focused primarily on actions taken in 2020 and are not expected to have material ongoing business impacts. As the COVID-19 pandemic evolves, we will continue to monitor federal legislative developments in this area.
Developments in Comprehensive Retirement Legislation
In 2021, comprehensive federal retirement legislation was introduced in both the House (the Securing a Strong Retirement Act of 2021) and the Senate (the Retirement Security and Savings Act). Both proposals may impact our products and services, including changes to required minimum distribution rules and enhanced obligations for retirement account reporting. In addition, other discrete proposals related to retirement are pending in Congress at this time that may impact our products and services, which could be included in any comprehensive federal retirement legislation. The likelihood of passage, scope, and implementation timing of significant retirement legislation is uncertain at this time, and we are closely monitoring these developments.
U.S. Securities, Investment Adviser, Broker-Dealer and Investment Company Regulation
Our investment products and services are subject to applicable federal and state securities, investment advisory, fiduciary, including ERISA, and other laws and regulations. The principal U.S. regulators of these operations include the SEC, FINRA, CFTC, Municipal Securities Rulemaking Board, state securities commissions, state insurance departments and the DOL.
AIG | 2021 Form 10-K 15
Our variable life insurance, variable annuity and mutual fund products generally are subject to regulation as “securities” under applicable federal securities laws, except where exempt. Such regulation includes registration of the offerings of these products with the SEC, unless exempt from such registration, and requirements of distribution participants to be registered as broker-dealers, as well as recordkeeping, reporting, and other requirements. This regulation also involves the registration of mutual funds and other investment products offered by our businesses, and the separate accounts through which our variable life insurance and variable annuity products are issued, as investment companies under the Investment Company Act of 1940, as amended (Investment Company Act), except where exempt. The Investment Company Act imposes requirements relating to compliance, corporate governance, disclosure, recordkeeping, registration and other matters. In addition, the offering of these products may involve filing and other requirements under the securities laws of the states and other jurisdictions where offered, including the District of Columbia and Puerto Rico. Our separate account investment products are also subject to applicable state insurance regulation.
We have several subsidiaries that are registered as broker-dealers under the Securities Exchange Act of 1934, as amended (Exchange Act) and are members of FINRA, and/or are registered as investment advisers under the Investment Advisers Act of 1940, as amended (Advisers Act). Certain of these broker-dealers and investment advisers are involved in our life and annuity product sales, including participating in their distribution and/or serving as an investment adviser to mutual funds that underlie variable products offered by us. Other subsidiaries are registered with the SEC as investment advisers under the Advisers Act and serve as an investment adviser to out-of-plan and in-plan participant customers, act as the primary investment advisers to our insurance subsidiaries and certain non-insurance subsidiaries, and also provide investment management and advisory services to unaffiliated institutional clients. In addition to registration requirements, the Exchange Act, the Advisers Act, and the regulations thereunder, impose various compliance, disclosure, qualification, recordkeeping, reporting and other requirements on these subsidiaries and their operations. Our investment adviser subsidiaries and our broker-dealer subsidiaries, and their licensed representatives, are also subject to standard of care obligations. See – “Standard of Care Developments” for further information. State securities laws also impose filing and other requirements on broker-dealers, investment advisers and/or their licensed representatives, except where exempt. The SEC, FINRA and other regulatory bodies also have the authority to examine regulated entities, such as our broker-dealer and investment adviser subsidiaries, and to institute administrative or judicial proceedings that may result in censure, fines, prohibitions or restrictions on activities, or other administrative sanctions.
Further, our licensed sales professionals appointed with certain of our broker-dealer and/or investment adviser subsidiaries and our other employees, insofar as they sell products that are securities, including wholesale and retail activity, are subject to the Exchange Act and to examination requirements and regulation by the SEC, FINRA and state securities commissioners. Regulation and examination requirements also extend to our subsidiaries that employ or control those individuals. The SEC, beginning in late 2020 and continuing through 2021, instituted a comprehensive regulatory agenda focusing on Environmental, Social and Governance (ESG) issues. The SEC commissioners and staff announced a number of actions, including forming an enforcement task force designed to harmonize the efforts of the SEC’s divisions and offices, considering potential comprehensive changes to ESG disclosure guidance and potential rulemakings for ESG and climate-specific disclosure for issuers, investment advisers and funds, announcing ESG as an examination priority, addressing shareholder rights and creating accountability in statements and conduct, and soliciting comments to potential changes to the “names rule” under the Investment Company Act to reflect the effect of ESG factors on a fund’s investment objectives and performance. The SEC’s Division of Examinations issued a risk alert in 2021 highlighting ESG deficiencies, internal control weaknesses and effective practices identified during recent examinations of investment advisers, registered investment companies and private funds. The increased regulatory and compliance burdens that we expect would result from the implementation of any of these initiatives could be costly.
Privacy, Data Protection and Cybersecurity
We are subject to U.S. laws and regulations that require financial institutions and other businesses to protect the security and confidentiality of personal and other sensitive information and provide notice of their practices relating to the collection, disclosure and other processing of personal information, including their policies relating to protecting the security and confidentiality of that information. We also are subject to U.S. laws and regulations requiring notification to affected individuals and regulators of security breaches. Congress and state legislatures are expected to continue to consider additional legislation relating to privacy and other aspects of customer information. Below we highlight a few, key, recently-enacted laws and regulations.
In October 2017, the NAIC adopted the Insurance Data Security Model Law (NAIC Model Law), which would require insurers, insurance producers and other entities required to be licensed under state insurance laws to develop and maintain a written information security program, conduct risk assessments, oversee the data security practices of third-party service providers and other related requirements.
A number of states, including Connecticut and Ohio, have enacted a version of the NAIC Model Law.
16 AIG | 2021 Form 10-K
On March 1, 2019, the NYDFS cybersecurity regulation became fully effective, requiring covered financial institutions to implement a cybersecurity program designed to protect information systems. The regulation imposes specific technical safeguards as well as governance, risk assessment, monitoring and testing, third-party service provider, incident response and reporting and other requirements. We annually file certifications of compliance as required by the NYDFS cybersecurity regulation. The requirements contained in the NYDFS cybersecurity regulation are similar in many, but not all, respects to those under the NAIC Model Law.
On October 21, 2019, the NAIC formed a Privacy Protections Working Group to review state insurance privacy protections regarding the collection, use and disclosure of information gathered in connection with insurance transactions. During its meeting on July 30, 2020, the Privacy Protections Working Group indicated that it would begin a gap analysis of existing privacy protections in order to identify differences in coverage between different privacy regimes, focusing on consumer issues, industry obligations, and regulatory enforcement. The Privacy Protections Working Group continues to work on this gap analysis, which could result in recommended changes to certain NAIC model laws and regulations related to privacy.
California enacted the California Consumer Privacy Act of 2018 (CCPA). The CCPA imposes a number of requirements on businesses that collect the personal information of California consumers, including requirements to provide individuals with certain rights to their personal information and make mandatory disclosures regarding how the businesses use and disclose consumers’ personal information. The CCPA also establishes a private right of action in some cases if consumers’ personal information is subject to a data breach resulting from a business’ failure to implement and maintain reasonable security practices. On November 3, 2020, California voters passed a ballot initiative, the California Privacy Rights Act (the CPRA), that imposes additional obligations on companies that collect California consumers’ personal information, including to provide a right to correct personal information, additional protections for certain uses of sensitive personal information, and certain limitations on data use and on data sharing that does not involve a sale of personal information. The CPRA also creates a new California Privacy Protection Agency which will be charged with enforcing both the CCPA and the CPRA. The CPRA will take effect on January 1, 2023.
In 2021, Virginia and Colorado passed comprehensive privacy laws that will become effective January 1, 2023 and July 1, 2023, respectively. Similar legislation has been proposed in other states and additional privacy and cybersecurity laws are expected to be enacted by the states or the federal government in the near future. The above-mentioned changes in the privacy and cybersecurity law landscape in the United States may require additional compliance investment and additional changes to policies, procedures, and operations.
With respect to our investment adviser subsidiaries and the mutual funds and registered separate accounts, the SEC continues to focus on cybersecurity in the asset management industry. The SEC has published periodic guidance on the topic, recommending periodic assessments of information, how it is stored and how vulnerable it is, as well as strategies to prevent, detect and respond to cyber threats, including access controls, governance and risk assessments, training, data encryption, restrictions on removable storage media, robust backup procedures, incident response plans and routine testing. Further, investment advisers to fund complexes must also focus on their growing network of third-party service providers. The SEC’s Division of Examinations issued examination observations in January 2020 related to cybersecurity and operational resiliency practices taken by market participants. The observations highlight certain approaches taken by market participants in the areas of governance and risk management, access rights and controls, data loss prevention, mobile security, incident response and resiliency, vendor management, and training and awareness. In its observations, the Division of Examinations highlighted specific examples of cybersecurity and operational resiliency practices and controls that organizations have taken to potentially safeguard against threats and respond in the event of an incident. In July 2020, the Division of Examinations issued a Risk Alert noting the increasing sophistication of ransomware attacks on SEC registrants and service providers to SEC registrants.
Thrift Regulator
AIG Federal Savings Bank, our trust-only federal thrift subsidiary, is supervised and regulated by the Office of the Comptroller of the Currency.
AIG | 2021 Form 10-K 17
INTERNATIONAL REGULATION
Insurance and Financial Services Regulation
A substantial portion of our business is conducted in foreign countries. The degree of regulation and supervision in foreign jurisdictions varies. Generally, our subsidiaries operating in foreign jurisdictions must satisfy local regulatory requirements; licenses issued by foreign authorities to our subsidiaries are subject to modification or revocation by such authorities, and therefore these subsidiaries could be prevented from conducting business in certain of the jurisdictions where they currently operate. For our international operations, a decline in capital and surplus over capital requirements would limit the ability of our insurance subsidiaries to write business or make dividend payments or distributions. Additionally, regulators in the countries in which such subsidiaries operate may deem it necessary to impose restrictions on dividend distributions in the event of a significant financial market or insurance event which creates uncertainty over our future capital and solvency position.
Certain jurisdictions require registration and periodic reporting by (re)insurance companies that are licensed in such jurisdictions and are controlled by other entities. Applicable legislation typically requires periodic disclosure concerning the entity that controls the registered insurer and the other companies in the holding company system and prior approval of intercompany transactions and transfers of assets, including in some instances payment of dividends by the (re)insurance subsidiary within the holding company system. Our subsidiaries are registered under such legislation in those jurisdictions that have such requirements.
In addition to these licensing and other requirements, our foreign operations are also regulated in various jurisdictions with respect to currency, policy language and terms, advertising, amount and type of security deposits, amount and type of reserves, amount and type of capital to be held, amount and type of local investment and the share of profits to be returned to policyholders on participating policies. Our foreign operations are subject to local tax laws and regulations as well. Some foreign countries regulate rates on various types of policies. Certain countries have established reinsurance institutions, wholly or partially owned by the local government, to which admitted insurers are obligated to cede a portion of their business on terms that may not always allow foreign insurers, including our subsidiaries, full compensation. In some countries, regulations governing constitution of technical reserves and remittance balances may hinder remittance of profits and repatriation of assets.
The Prudential Regulation Authority (PRA), the UK’s prudential regulator, is the lead prudential supervisor for our UK insurance operations. The UK’s Financial Conduct Authority has oversight of AIG’s insurance operations for consumer protection and competition matters. For example, we are subject to the UK’s Senior Managers and Certification Regime (SMCR), legislation that is intended to reduce harm to consumers and strengthen market integrity by making senior individuals more accountable for their conduct and competence. The SMCR comprises 3 elements: the Senior Managers Regime, which requires that firms appoint an individual with responsibility for each senior management function and subjects such individuals to regulatory pre-approval; the Certification Regime, which requires firms to certify (on an on-going basis) the fitness and propriety of certain employees who could harm the firm, its customers or the market; and the Conduct Rules, which are high-level standards of behavior expected of those working in financial services. The UK Financial Conduct Authority (FCA) has also published Policy Statement PS21/3 titled “Building operational resilience: Feedback to CP19/32 and final rules” which will require, amongst other things, firms to strengthen their operational resilience by identifying important business services and setting tolerance levels for operational disruption. These rules will come into force in March 2022.
Legislation in the EU could also affect our international (re)insurance operations. The EU issues Directives and Regulations on a wide range of topics that impact financial services. Insurance companies operating in the EU are subject to the Solvency II framework. The Luxembourg insurance regulator, the Commissariat aux Assurances, is the insurance regulator for AIG Europe SA, which serves our European Economic Area (EEA) and Swiss policyholders. In addition, financial companies that operate in the EU are subject to a range of regulations enforced by the national regulators in each member state in which that firm operates. The EU has also established a set of regulatory requirements under the European Market Infrastructure Regulation (EMIR) that include, among other things, risk mitigation, risk management, regulatory reporting and clearing requirements. Solvency II governs the insurance industry’s solvency framework for the EU, including minimum capital and solvency requirements, governance requirements, risk management and public reporting standards. In accordance with Solvency II, the European Commission is required to make a determination as to whether a supervisory regime outside of the EU is “equivalent.”
On September 22, 2017, the U.S. Treasury Department and the Office of the U.S. Trade Representative, on behalf of the U.S., and the EU signed the bilateral Covered Agreement, which is intended to address issues regarding the application of Solvency II requirements to U.S.-based insurance groups as well as other (re)insurance regulatory issues. Certain aspects of the agreement remain subject to an implementation timetable in the U.S. and the EU, which may delay or even prevent the agreement from being fully implemented. In particular, the U.S. states have been given a period of five years to comply with the agreement’s reinsurance collateral provisions. The agreement may be terminated (following mandatory consultation) by notice from one party to the other effective in 180 days, or at such time as the parties may agree.
18 AIG | 2021 Form 10-K
Under the agreement, AIG will be supervised at the worldwide group level only by its relevant U.S. insurance supervisors, and will in general not have to satisfy EU Solvency II group capital, reporting and governance requirements for its worldwide group. The agreement, however, would permit the imposition of EU Solvency II group capital requirements if, after five years from the signing of the agreement, a U.S. insurer is not subject to a group capital assessment by its applicable state regulator. As referenced elsewhere (see “NAIC Activities and Model Laws” section) the NAIC has developed a GCC which is designed to satisfy this requirement. Certain states have already adopted the GCC requirements in their statutes. Remaining states have until November 7, 2022 to implement the GCC provisions after which they will be subject to federal preemption. The Covered Agreement further provides that if the summary risk reports submitted to the supervisory authority of a host jurisdiction expose any serious threat to policyholder protection or financial stability in such host state, the host supervisor may request further information from the insurance group and/or impose preventive or corrective measures with respect to the (re)insurer in its jurisdiction. The agreement also seeks to impose equal treatment of U.S. and EU-based reinsurers that meet certain qualifications. In the U.S., once fully implemented, the agreement requires U.S. states to lift reinsurance collateral requirements on qualifying EU-based reinsurers and provide them equal treatment with U.S. reinsurers or be subject to federal preemption. While this provision does not preclude AIG from continuing to request collateral from an EU reinsurer that is party to a bilateral reinsurance transaction, it is generally difficult to obtain collateral from reinsurers when it is not required for AIG to take credit for the reinsurance.
Lastly, while the U.S. has not been deemed an “equivalent” jurisdiction under European law, U.S. groups are expected to receive treatment under Solvency II that reflects the soundness of U.S. supervision, Covered Agreement safeguards, and the enhanced bilateral relationship between U.S. and EU authorities. Based on proposed changes to Article 262 in Solvency II, as part of EIOPA and the European Commission’s current review of the Solvency II framework, there is a desire to bring increased conformity to the supervision of groups from non-equivalent jurisdictions across all EU member states. These potential changes could include limits on intragroup transactions, governance changes and requiring information on risk exposures from parent companies. It is currently unclear how these potential changes would apply to US groups.
On December 18, 2018, the U.S. Treasury Department and the Office of the U.S. Trade Representative signed the Bilateral Agreement between the U.S. and the UK on Prudential Measures Regarding Insurance and Reinsurance. The terms of the agreement are substantially similar to the U.S.-EU Covered Agreement. The agreement has been entered into in order to maintain regulatory certainty and market continuity in connection with the UK’s exit from the EU. In addition, the agreement notes with respect to the date of entry into force that the UK must take into account its obligations arising in respect of any agreement between the EU and the UK pursuant to Article 50 of the Treaty on European Union, which sets out the process under which an EU member state may withdraw from the EU.
Bermuda’s Insurance Act 1978 and its related regulations impose solvency and liquidity standards and auditing and reporting requirements on Bermuda (re)insurance companies and grant the Bermuda Monetary Authority (BMA) powers to supervise, investigate and intervene in the affairs of (re)insurance companies. The BMA regulates AIG’s operating (re)insurance subsidiaries in Bermuda. A variety of requirements and restrictions are imposed on our Bermuda operating (re)insurance subsidiaries including: the filing of annual/quarterly statutory financial information including, but not limited to, the preparation of an annual Financial Condition Report for commercial (re)insurers providing details of measures governing the business operations, corporate governance framework, solvency and financial performance; the filing of annual audited financial statements prepared in accordance with GAAP International Financial Reporting Standards or other generally accepted accounting principles as the BMA may recognize; compliance with minimum enhanced capital requirements; compliance with the BMA’s applicable Codes of Conduct; compliance with minimum solvency margins and liquidity ratios (the latter for general business (re)insurers); limitations on dividends and distributions; and notification obligations to the BMA on certain changes in control of regulated (re)insurers.
The Registrar of Companies (ROC) regulates the compliance by AIG’s entities in Bermuda which carry on a Relevant Activity, as defined in Bermuda’s Economic Substance Act 2018 and related Economic Substance Regulations 2018 (as amended, the ES Laws). The purpose of the ES Laws is to ensure that Bermuda does not facilitate the use of structures which attract profits but which do not reflect real economic activity that is being undertaken in Bermuda. The ROC imposes the filing of an annual declaration form demonstrating compliance with the requirements of the ES Laws by entities which carry on a Relevant Activity.
The Japan Financial Services Agency (JFSA) regulates AIG’s operating insurance subsidiaries in Japan. The JFSA has extensive authority under the Insurance Business Act and related regulations to oversee company licensing, sales practices, business conduct, investments, reserves and solvency, among other items. Our Japanese insurance operations are required to maintain a minimum solvency margin ratio (SMR), which is a measure of capital adequacy. The failure to maintain an appropriate SMR, or comply with other similar indicators of financial health, could result in the JFSA imposing corrective actions on our operations.
AIG | 2021 Form 10-K 19
Derivatives
Regulation of, and restrictions on, derivatives markets and transactions were adopted outside the United States in conjunction with similar regulation promulgated by U.S. regulators. For instance, the EU and UK established a set of regulatory requirements for EU and UK derivatives activities under EMIR and English law, respectively. These requirements include, among other things, various risk mitigation, risk management, margin posting, regulatory reporting and, for certain categories of derivatives, clearing requirements, that are broadly similar to, but also deviate in certain respects from U.S. regulations of these activities. There remains the possibility of increased administrative costs with respect to our EU and UK derivatives activities and/or our derivatives activities with EU or UK counterparties and overlapping or inconsistent regulation depending on the ultimate application of cross-border regulatory requirements between and among U.S. and non-U.S. jurisdictions.
Markets in Financial Instruments Directive (MiFID) II
The Markets in Financial Instruments Directive (MiFID II) and Markets in Financial Instruments Regulation (MiFIR) took effect in Europe on January 3, 2018. MiFID II and the related regulations are intended to create transparency in market trading by, for example, imposing trade and transaction reporting and other requirements. AIG Asset Management (Europe) Limited has implemented and continues to implement new policies, procedures and reporting protocols required to ensure compliance with this legislation and its related rules.
EMIR, which governs derivatives, and MiFID II were adopted by the UK government as part of the Brexit legislative “onshoring” process. The MiFID requirements were implemented in the UK before the UK’s exit from the EU and then amended to reflect the UK’s exit from the EU. MiFIR was onshored in the UK by the Markets in Financial Instruments (Amendment) (EU Exit) Regulation 2018 (as amended). Brexit has not, as yet, had a material impact on the UK regulation of derivatives and financial markets. The UK government is conducting a wholesale markets review that proposes changes to MiFID rules governing trading venues and equity markets (such as the possible repeal of the obligation to trade equities on a regulated market or trading venue) and changes to MiFID rules on client reporting and disclosure, and minor changes to EMIR. However, substantive obligations on AIG Asset Management (Europe) Limited arising from EMIR and MiFID II are unlikely to change in the UK context in the near future.
International Securities, Investment Adviser, Broker-Dealer and Investment Company Regulation
We operate investment-related businesses in, among other jurisdictions, the UK and Ireland. These businesses may advise on and market investment management products and services, investment funds and separately managed accounts. The regulatory authorities for these businesses include securities, investment advisory, financial conduct and other regulators that typically oversee such issues as: (1) company licensing; (2) the approval of individuals with positions of responsibility; (3) conduct of business to customers, including sales practices; (4) solvency and capital adequacy; (5) fund product approvals and related disclosures; and (6) securities, commodities and related laws, among other items. For example, our regulated asset manager in the UK is subject to the SMCR regime described above. We also participate in investment-related joint ventures in jurisdictions outside the United States, primarily in Europe and Asia. In some cases, our international investment operations are also subject to U.S. securities laws and regulations.
Privacy, Data Protection and Cybersecurity
The EU General Data Protection Regulation (GDPR) took effect in May 2018. The GDPR’s scope extends to entities established within the EEA (i.e., EU member states plus Iceland, Liechtenstein and Norway) and to certain entities not established in the EEA (in certain instances, if they solicit or target individuals in the EU by offering goods or services to EEA data subjects or monitoring the personal behavior of EEA data subjects (e.g., in an online context)). The GDPR was also onshored in the UK through the European Union (Withdrawal Agreement) Act 2018, with adjustments as provided in the Data Protection, Privacy and Electronic Communications (Amendments etc.) (EU Exit) Regulations 2019.
We have sought to address these new requirements on the processing of personal data about individuals, including mandatory security breach reporting, new and strengthened individual rights, evidenced data controller accountability for compliance with the GDPR principles (including fairness and transparency), maintenance of data processing activity records and the implementation of “privacy by design”, including through the completion of mandatory Data Protection Impact Assessments in connection with higher risk data processing activities. Sanctions for non-compliance with the GDPR are onerous, with the potential for fines of up to 4 percent of global revenue for the most serious infringements of the GDPR.
20 AIG | 2021 Form 10-K
We also are subject to other international laws and regulations that require financial institutions and other businesses to protect personal and other sensitive information and provide notice of their practices relating to the collection, disclosure and other processing of personal information and to obtain consent pertaining to such processing. We are also subject to laws and regulations requiring notification to affected individuals and regulators of security breaches. In addition, we must comply with laws and regulations regarding data localization and the cross-border transfer of information. For example, in 2021, the European Commission approved revised Standard Contractual Clauses (SCCs) for international data transfers from the EEA. The SCCs are required to be used for new agreements involving the cross-border transfer of personal data from the EEA and must be supplemented by an assessment and due diligence of the legal and regulatory landscape of the jurisdiction of the data importer, the channels used to transmit personal data and the subprocessors that receive personal data in the process.
The EEA and the UK have also taken steps to regulate the use of personal data, including external data, and algorithms used for the purpose of AI and automated decision-making. In April 2021, the European Commission published its Proposal for a Regulation on a European approach for Artificial Intelligence (the Artificial Intelligence Act, which recommends a risk-based approach to restricting, regulating and permitting different AI systems. European countries, and supranational political organizations like the EU and the Council of Europe, are expected to take an active role in regulating AI in ways that may impact the insurance industry in the future.
For additional information on U.S. privacy, data protection and cybersecurity regulation, see U.S. Regulation – Privacy, Data Protection and Cybersecurity.
FSB and IAIS
The Financial Stability Board (FSB) consists of representatives of national financial authorities of the G20 countries. The FSB is not a regulator but is focused primarily on promoting international financial stability. It does so by coordinating the work of national financial authorities and international standard-setting bodies as well as developing and promoting the implementation of regulatory, supervisory and other financial policies. The FSB has issued a series of frameworks and recommendations to address such issues as systemic financial risk, financial group supervision, capital and solvency standards, effective recovery and resolution regimes, corporate governance including compensation, and a number of related issues associated with responses to the financial crisis.
The International Association of Insurance Supervisors (IAIS) represents insurance regulators and supervisors of more than 200 jurisdictions (including regions and states) in nearly 140 countries and seeks to promote globally consistent insurance industry supervision. The IAIS is not a regulator, but one of its activities is to develop insurance regulatory standards for use by local authorities across the globe. The FSB has charged the IAIS with developing a framework for measuring and mitigating systemic risks posed by the insurance sector, and the IAIS has developed standards relative to many of the areas of focus of the FSB, which go beyond the IAIS’ basic Insurance Core Principles. The IAIS has adopted ComFrame, a Common Framework for the Supervision of Internationally Active Insurance Groups (IAIGs). ComFrame sets out qualitative and quantitative standards tailored to the international activity and size of IAIGs. These standards assist supervisors in collectively addressing an IAIG’s activities and risks, identifying and avoiding supervisory gaps and coordinating supervisory activities, particularly between the group-wide supervisor and other involved supervisors. ComFrame provides standards for group supervision, governance and internal controls, enterprise risk management, and recovery and resolution planning. As part of ComFrame, the IAIS is developing a risk-based global insurance capital standard (ICS) applicable to IAIGs, with the purpose of creating a common language for supervisory discussions of group solvency of IAIGs. We currently meet the criteria set forth to identify an IAIG, and the NYDFS, as our group-wide supervisor, has publicly disclosed us as an IAIG on the IAIS’ register of IAIGs.
The IAIS has adopted ICS Version 2.0 for a five-year monitoring phase, an initial phase commencing January 2020, during which ICS Version 2.0 is used for confidential reporting to group-wide supervisors and discussion in supervisory colleges, but will not trigger supervisory action. The purpose of the monitoring period is to monitor the performance of the ICS over a period of time, and not to assess the capital adequacy of IAIGs. During the monitoring period, the IAIS will collect and consider feedback from supervisors, stakeholder engagement, a public consultation, and the results of an economic impact assessment, all of which could result in changes to ICS Version 2.0.
At the conclusion of the five-year monitoring period, the IAIS has agreed to a second phase of implementation, whereby the ICS will be applied as a group-wide prescribed capital requirement, defined as a solvency control level above which the supervisor does not intervene on capital adequacy grounds.
AIG | 2021 Form 10-K 21
Confidential reporting of ICS Version 2.0 will include reporting by IAIGs of a reference ICS, a consolidated group-wide measure based on a standard method for determining capital requirements and a market adjusted valuation of assets and liabilities. In recognition that the United States and other interested jurisdictions are developing an Aggregation Method (AM) to a group capital calculation, the IAIS is aiding in the development of the AM, including the collection of data from interested jurisdictions. Although the AM is not part of ICS Version 2.0, the IAIS aims to be in a position by the end of the monitoring phase to assess whether the AM provides substantially the same outcome as the ICS, in which case it will be considered an outcome-equivalent approach to the ICS. The IAIS is developing criteria to assess whether the AM provides comparable outcomes to the ICS, including a project plan focused on delivery by the end of the monitoring period.
The IAIS has adopted a Holistic Framework for the assessment and mitigation of systemic risk in the insurance sector, with implementation beginning in 2020. The Holistic Framework recognizes that systemic risk can emanate from specific activities and exposures arising from either sector-wide trends or concentrations in individual insurers. The Holistic Framework consists of:
an enhanced set of supervisory policy measures for macroprudential purposes (including supervisory requirements applied to insurers targeting liquidity risk, macroeconomic exposure, and counterparty exposure; enhanced macroprudential supervision; crisis management and planning; and supervisory powers of intervention),
an annual IAIS global monitoring exercise to assess trends and to detect the potential build-up of systemic risks (including an assessment of the possible concentration of systemic risks at individual insurers),
mechanisms for collective IAIS discussion and assessment, including coordinated supervisory responses when needed, and
an IAIS assessment of the consistency of implementation across jurisdictions.
In light of the IAIS adoption of the Holistic Framework, the FSB decided to continue its suspension of the identification of global systemically important insurers (G-SII). In November 2022, based on the initial years of implementation of the Holistic Framework, the FSB will review the need to either discontinue or re-establish an annual identification of G-SIIs.
The standards issued by the FSB and/or the IAIS are not binding on the United States or other jurisdictions around the world unless and until the appropriate local governmental bodies or regulators adopt laws and regulations implementing such standards. At this time, as these standards have been adopted only recently and in some cases remain under development, in some cases there is uncertainty about how the IAIS’ frameworks and/or standards might be implemented in the United States and other jurisdictions around the world, or how they might ultimately apply to us.
Climate Change
There have been a number of climate related policy developments throughout 2021, mostly focused on the UK (which we expect will impact AIG’s UK operations) and European markets, however there is increasing activity in certain jurisdictions across Asia (such as Singapore, Australia, Taiwan and New Zealand).
In the UK, the PRA’s 2021 Climate Change Adaptation Report sets out an expectation that they will be asking the largest firms in the UK for a report describing how the firm has embedded management of climate related financial risks into their existing management frameworks, and in particular, “how [the firm] has gained assurance that capital positions cover material climate related financial risks”.
In the EU, the upcoming Corporate Sustainability Reporting Directive and EU taxonomy initiatives will introduce additional disclosure requirements for large EU entities covering how sustainability is reflected in the balance sheet, business strategy and governance in the short, medium, and long-term horizons. If proposed timeframes are met, the new requirements would apply to AIG’s EU subsidiaries commencing in 2024 for reports covering 2023. Around the same timeframe, there could also be additional non-financial disclosure requirements associated with new corporate governance requirements, as well as the ongoing EU taxonomy initiatives, which include a requirement to set out the proportion of environmentally sustainable economic activities in investment & underwriting portfolios. AIG is already working on developing internal policies and frameworks to ensure we are ready to comply with these emerging standards when they become effective.
22 AIG | 2021 Form 10-K
Available Information about AIG
Our corporate website is www.aig.com. We make available free of charge, through the Investor Information section of our corporate website, the following reports (and related amendments as filed with the SEC) as soon as reasonably practicable after such materials are electronically filed with, or furnished to, the SEC:
Annual Reports on Form 10-K
Quarterly Reports on Form 10-Q
Current Reports on Form 8-K
Proxy Statements on Schedule 14A, as well as other filings with the SEC
Also available on our corporate website:
Charters for Board Committees: Audit, Nominating and Corporate Governance, Compensation and Management Resources and Risk and Capital Committees
Corporate Governance Guidelines
Director, Executive Officer and Senior Financial Officer Code of Business Conduct and Ethics (we will post on our website any amendment or waiver to this Code within the time period required by the SEC)
Employee Code of Conduct
Except for the documents specifically incorporated by reference into this Annual Report on Form 10-K, information contained on our website or that can be accessed through our website is not incorporated by reference into this Annual Report on Form 10-K. Reference to our website is made as an inactive textual reference.
AIG | 2021 Form 10-K 23
ITEM 1A | Risk Factors
Risk Factor Summary
The following is a summary of the material risks and uncertainties that could adversely affect our business, financial condition and results of operations. You should read this summary together with the more detailed description of each risk factor contained below.
Market Conditions
COVID-19 has adversely affected, and is expected to continue to adversely affect, our global business, results of operations, financial condition and liquidity, and its ultimate impact will depend on future developments that are uncertain and cannot be predicted.
Deterioration of economic conditions, geopolitical tensions, changes in market conditions or weakening in global capital markets may materially affect our businesses, results of operations, financial condition and liquidity.
Sustained low, declining or negative interest rates, or rapidly increasing interest rates, have materially and adversely affected and may continue to materially and adversely affect our profitability.
Reserves and Exposures
The amount and timing of insurance and reinsurance liability claims are difficult to predict and such claims may exceed the related liability for unpaid losses and loss adjustment expenses or future policy benefits, or the liabilities associated with certain guaranteed benefits and indexed features accounted for as embedded derivatives at fair value.
Reinsurance may be unavailable or too expensive relative to its benefit, and may not be adequate to protect us against losses.
Our consolidated results of operations, liquidity, financial condition and ratings are subject to the effects of natural and man-made catastrophic events.
Concentration of our insurance, reinsurance and other risk exposures may have adverse effects.
Following the Majority Interest Fortitude Sale (as defined in Part II, Item 7. – Management’s Discussion and Analysis of Financial Condition and Results of Operations – Executive Summary below), our largest reinsurance counterparty, Fortitude Re, is no longer controlled by us, and a failure by Fortitude Re to perform its obligations could have a material effect on our business, results of operations or liquidity and the accounting treatment of our reinsurance agreements with Fortitude Re could also lead to volatility in our net income.
Our subsidiaries may be required to accelerate the amortization of deferred policy acquisition costs (DAC) and record additional liabilities for future policy benefits due to interest rate fluctuations, increased lapses and surrenders, declining investment returns and other events.
Losses due to nonperformance or defaults by counterparties may materially and adversely affect the value of our investments, our profitability and sources of liquidity.
Climate change may adversely affect our business and financial condition.
Investment Portfolio and Concentration of Investments
Our investment portfolio is concentrated in certain segments of the economy, and the performance and value of our investment portfolio are subject to a number of risks and uncertainties, including changes in interest rates and credit spreads. In addition, a significant portion of our investment portfolio is now managed by Blackstone, which makes its performance and value subject to Blackstone’s ability to successfully manage it.
Our valuation of investments and derivatives involves the application methodologies and assumptions to derive estimates, which may differ from actual experience and could result in changes to investment valuations that may materially adversely affect our business, results of operations, financial condition and liquidity or lead to volatility in our net income.
Liquidity, Capital and Credit
AIG Parent’s ability to access funds from our subsidiaries is limited, and our sources of liquidity may be insufficient to meet our needs, including providing capital that may be required by our subsidiaries.
We may not be able to generate cash to meet our needs due to the illiquidity of some of our investments.
24 AIG | 2021 Form 10-K
A downgrade by one or more of the rating agencies in the Insurer Financial Strength ratings of our insurance or reinsurance companies could limit their ability to write or prevent them from writing new business and impair their retention of customers and in-force business, and a downgrade in our credit ratings could adversely affect our business, results of operations, financial condition and liquidity.
Changes in the method for determining LIBOR and the continuing phase out of LIBOR and uncertainty related to LIBOR replacement rates may affect our business, results of operations, financial condition and liquidity.
Business and Operations
No assurances can be given that the separation of our Life and Retirement business will occur or as to the specific terms or timing thereof. In addition, the separation could cause the emergence or exacerbate the effects of other risks to which AIG is exposed.
Failure to effectively execute on AIG 200 could result in costs that are greater than expected, savings that are less than expected and disruption to our businesses that could have a material effect on our operations or financial condition.
Pricing for our products is subject to our ability to adequately assess risks and estimate related losses.
Guarantees within certain of our products may increase the volatility of our results.
Our foreign operations expose us to risks that may affect our operations.
Our restructuring initiatives may not yield our expected reductions in expenses and improvements in operational and organizational efficiency.
We may experience difficulty in marketing and distributing products through our current and future distribution channels and the use of third parties may result in additional liabilities.
We are exposed to certain risks if we are unable to maintain the availability of our critical technology systems and data and safeguard the confidentiality and integrity of our data, which could compromise our ability to conduct business and adversely affect our consolidated business, results of operations, financial condition and liquidity.
Third parties we rely upon to provide certain business and administrative services on our behalf may not perform as anticipated, which could have an adverse effect on our business and results of operations.
Business or asset acquisitions and dispositions may expose us to certain risks.
Significant legal or regulatory proceedings may adversely affect our business, results of operations or financial condition.
Increasing scrutiny and evolving expectations from investors, customers, regulators and other stakeholders regarding environmental, social and governance (ESG) matters may adversely affect our reputation or otherwise adversely impact our business and results of operations.
Our risk management policies and procedures may prove to be ineffective and leave us exposed to unidentified or unanticipated risk, which could adversely affect our businesses, results of operations, financial condition and liquidity.
Regulation
Our businesses are heavily regulated and changes in laws and regulations may affect our operations, increase our insurance subsidiary capital requirements or reduce our profitability.
New laws and regulations or new interpretations of current laws and regulations, both domestically and internationally, may affect our businesses, results of operations, financial condition and ability to complete effectively.
Changes to tax laws could increase our corporate taxes or make some of our products less attractive to consumers.
Estimates and Assumptions
Estimates or assumptions used in the preparation of financial statements and modeled results used in various areas of our business may differ materially from actual experience.
Changes in accounting principles and financial reporting requirements will impact our consolidated results of operations and financial condition.
If our businesses do not perform well and/or their estimated fair values decline, we may be required to recognize an impairment of our goodwill or establish an additional valuation allowance against the deferred income tax assets, which could have a material adverse effect on our results of operations and financial condition.
Competition and Employees
We face intense competition in each of our business lines and technological changes may present new and intensified challenges to our business.
Competition for employees in our industry is intense, and managing key employee succession is critical to our success. We may not be able to attract and retain the key employees and highly skilled people we need to support our business.
AIG | 2021 Form 10-K 25
Risk Factors
Investing in AIG involves risk. In deciding whether to invest in AIG, you should carefully consider the following risk factors. Any of these risk factors could have a significant or material adverse effect on our businesses, results of operations, financial condition or liquidity. They could also cause significant fluctuations and volatility in the trading price of our securities. Readers should not consider any descriptions of these factors to be a complete set of all potential risks that could affect AIG. These factors should be considered carefully together with the other information contained in this report and the other reports and materials filed by us with the SEC. Further, many of these risks are interrelated and could occur under similar business and economic conditions, and the occurrence of certain of them may in turn cause the emergence or exacerbate the effect of others. Such a combination could materially increase the severity of the impact of these risks on our businesses, results of operations, financial condition and liquidity above and beyond a risk’s singular impact.
MARKET CONDITIONS
COVID-19 has adversely affected, and is expected to continue to adversely affect, our global business, results of operations, financial condition and liquidity, and its ultimate impact will depend on future developments that are uncertain and cannot be predicted. The COVID-19 pandemic is still evolving, but it has caused significant societal disruption and has had adverse economic impacts on our business, such as volatility in the capital markets, disruptions in the labor market, supply chain disruption, mortality increases as compared to pricing expectations and most recently, an inflationary environment. We cannot estimate the ultimate impact of COVID-19 on our business, financial condition and results of operations. We also cannot, at this time, estimate the full extent to which the pandemic has caused and may continue to cause certain risks to our global business, including those discussed herein, to be heightened or realized.
Adverse changes and developments affecting the global economy, including the significant global economic downturn and increased volatility in financial and capital markets and credit spreads, individually and in the aggregate, have had and may continue to have negative effects on our overall investment portfolio. While, to date, the short-term economic impacts of COVID-19 have been largely offset by intervention taken by governments and monetary authorities, it remains difficult to quantify the potential long-term financial impacts on our investment portfolio. Further, in the event of a resurgence in COVID-19 cases, particularly due to the rise in cases associated with current and any future potential variants of COVID-19, there can be no assurance that governments and monetary authorities will continue to intervene in markets or provide for economic stimulus, and if they do, whether such intervention will be successful.
Within our investment portfolio, there is concentrated exposure to certain segments of the economy, including real estate and real estate-related investments, which exposes us to negative impacts from the deferral of mortgage payments, renegotiated commercial mortgage loans or outright mortgage defaults and potential acceleration of macro trends such as work from home and online shopping, as well as significant exposure to certain industries negatively impacted by the economic downturn, such as off-line retail, travel and transportation. Moreover, market volatility has created and may continue to create dislocations, decreases or variations in observable market activity or availability of information used in the valuation of our assets and liabilities, which could negatively impair the estimates and assumptions used to run our business or result in greater variability and subjectivity in our investment decisions.
Our insurance businesses have experienced and may continue to experience increased claim volume under our Life and Retirement Insurance products, which are offered primarily in the United States, which has seen a high number of COVID-19 cases and deaths relative to other jurisdictions, and our General Insurance policies, which are offered both in the U.S. and internationally, including commercial property (business interruption), travel, trade credit, accident and health, workers’ compensation, directors and officers, event cancellation and liability insurance. Beginning in March 2020, we experienced an increase in mortality claims, which we expect to continue until the COVID-19 pandemic subsides, and decreased demand for certain of our insurance product lines, such as travel insurance, and it is unclear when such demand will return. In addition, COVID-19 adversely affected our premiums and deposits in some of our insurance lines, including our Life and Retirement products. If the economic effects continue or increase in severity, or the economic recovery is prolonged, or if there are any future “surges” of variants, we expect the impacts described herein will continue in 2022 and possibly beyond. Further, our policies with premium adjustment features tied to exposure levels, as is the case in certain specialty and casualty lines, may be triggered, resulting in premium reductions. In response to the COVID-19 pandemic and the resulting ongoing adverse, economic, financial and market impacts, we have made and may continue to make changes to underwriting guidelines or product design. We may also incur higher expenses in our insurance businesses and higher legal costs as a result of coverage disputes, including class actions and other proceedings that have been or may in the future be filed against us, our insureds, or others in the United States, the UK or other jurisdictions seeking coverage for COVID 19-related losses or alleging
26 AIG | 2021 Form 10-K
bad-faith denials of coverage for such losses. The outcome of coverage decisions may in turn affect the perceived value of the products we offer and therefore the demand for them.
While we seek to mitigate our loss exposure through reinsurance, the availability of reinsurance relief typically depends on several factors, including the timing and nature of how individual claims manifest, which may not be immediately known. Furthermore, due to the scope, severity and uncertain duration of the COVID-19 pandemic, reinsurance may not be available or, if available, may be more difficult or costly to obtain in general or for certain types of coverage, such as natural catastrophes, going forward. In addition, reinsurance terms and conditions may change whereby, even if reinsurance is available, the coverage provided may not be the same or similar to the reinsurance terms and conditions currently available in the reinsurance market.
The economic impacts of the pandemic have resulted and may continue to result in policyholders cancelling or not renewing insurance policies or may result in policyholders seeking sources of liquidity such as policy loans and withdrawals at rates greater than expected. If policyholder behavior, including lapse and surrender rates, significantly exceed or vary from our expectations, it could have a material adverse effect on our business, requiring our subsidiaries to accelerate the amortization of deferred policy acquisition costs and record additional liabilities for future policy benefits.
Government officials have recommended or mandated precautions to mitigate the spread of COVID-19, including prohibitions on congregating in heavily populated areas, social distancing requirements, stay-at-home orders and similar measures. As a result, we implemented work-from-home business continuity plans for non-essential staff globally. Where permitted by local laws and regulations, our offices are open to fully vaccinated employees with mask mandates, social distancing and office capacity limits, and we have strict quarantine and contact tracing protocols in place in the event a positive case occurs. These precautionary measures have also impacted our distribution organizations and wholesaler interactions with our clients across multiple channels where our business benefits from a high degree of customer interaction. Our results may be adversely impacted by these and other actions taken to contain or reduce the impact of COVID-19, and the extent of such impact will depend on future developments, which are highly uncertain and cannot be predicted. Changes to our workforce as a result of COVID-19, including wage inflation, may also increase our costs and the risk of errors due to turnover, remote work and inexperience. Moreover, the extended remote work environment puts ongoing stress on our current business continuity plans and may prove them to be less effective than expected.
Any future business continuity plans may not be sustainable or effective. Our business operations may also be significantly disrupted if our critical workforce, key vendors, third-party providers or other counterparties we transact business with, are unable to work effectively, including because of illness, quarantines, government and regulatory actions in response to COVID-19, including vaccine mandates, or other reasons, or if the technology on which our remote business operations rely, some of which is developed and maintained by third parties, is disrupted or impaired or becomes unavailable. Certain pre-existing operational risks have been and may continue to be exacerbated, notably with respect to potential phishing or other cybersecurity-related events and our increased reliance on technology, including technology of our employees and service providers. Other pre-existing operational risks, such as privacy incidents, fraud, operational resilience and risks related to the operations and resiliency of our vendors, third-party providers and other counterparties, may also be exacerbated. Further, significant disruption to our businesses due to the pandemic could adversely affect the timing or terms of, or our ability to execute, key business strategies, transactions and initiatives, such as the separation of the Life and Retirement business and AIG 200, resulting in higher costs or reduced savings or lower profit than was expected. In addition, remote work may negatively impact our culture and employees’ morale, which could result in greater turnover, lower productivity and greater operational risks.
Legislative and regulatory initiatives and court decisions following major catastrophes (such as pandemics) could require us to pay insureds beyond the provisions of their original insurance policies and may prohibit the application of a deductible, resulting in inflated and unanticipated catastrophe claims; or impose other restrictions after the occurrence thereof, which would reduce our ability to mitigate exposure. For example, COVID-19 has given rise to regulatory measures intended to encourage or require insurers to assist policyholders adversely impacted by COVID-19 (in some cases with retroactive effect), including lapse, payment or rate increase moratoriums, premium refunds, contributions to relief funds and similar measures. While some of these legislative and regulatory initiatives have expired, with the resurgence of the COVID-19 virus, legislative and regulatory authorities have extended certain of these initiatives and may seek to renew or impose more of them until the COVID-19 pandemic subsides. These initiatives could impair our cash flows and, without regulatory relief, could reduce our subsidiaries’ capital ratios. In addition, in certain jurisdictions, legislative initiatives have emerged requiring contributions to relief funds or legislation has been proposed that would require insurers to provide insurance coverage beyond the scope of the original contract by re-writing contracts on a retroactive basis, including with respect to the availability of business interruption coverage in commercial property policies, or creating insurance solutions prospectively. Such legislative and regulatory initiatives and proposals, if enacted, could result in requirements or restrictions that negatively impact our business operations or require us to pay beyond the provisions of original insurance policies and assumed reinsurance contracts. Finally, the adverse impacts of COVID-19 on Federal and state tax revenues could lead to increased taxes and assessments on insurers in order to address budget shortfalls.
AIG | 2021 Form 10-K 27
Moreover, as vaccinations have become readily available, certain organizations have imposed vaccine mandates on employees returning to the office and customers or clients accessing offices, stores and other spaces, and governments have imposed vaccine mandates on certain daily activities. It is currently not possible to predict with certainty the exact impact any such mandates would have on us. In addition, if the vaccines are not as effective as expected, including against new variants of COVID-19, our business, results of operations, financial condition and liquidity could be adversely affected.
Due to the evolving and disruptive nature of the COVID-19 pandemic, we could experience other potential impacts as a result of COVID-19, including, but not limited to, potential impairment charges to the carrying amounts of goodwill, deferred tax assets, increased reserves to levels that are difficult to accurately estimate and increased morbidity and mortality expectations from longer term consequences of COVID-19 infections. Further, new and potentially unforeseen risks beyond those described above and in other Risk Factors herein may arise as a result of the pandemic and the actions taken by governmental and regulatory authorities to mitigate its impact.
See also Reserves and Exposures – “Reinsurance may be unavailable or too expensive relative to its benefit, and may not be adequate to protect us against losses” and “Our consolidated results of operations, liquidity, financial condition and ratings are subject to the effects of natural and man-made catastrophic events” below.
Deterioration of economic conditions, geopolitical tensions, changes in market conditions or weakening in global capital markets may materially affect our businesses, results of operations, financial condition and liquidity. Our businesses are highly dependent on global economic and market conditions. Weaknesses in economic conditions and the capital markets or market volatility have in the past led, and may in the future lead to, among other consequences, a poor operating environment, erosion of consumer and investor confidence, reduced business volumes, deteriorating liquidity, declines in asset valuations and impacts on policyholder behavior that could influence reserve valuations. Key ways in which we have in the past been, and could in the future be, negatively affected by economic conditions include, but are not limited to: increases in policy withdrawals, surrenders and cancellations; write-offs of deferred policy acquisition costs; increases in liability for future policy benefits due to loss recognition on certain long-duration insurance and reinsurance contracts; reduced demand for products and services; increases in expenses associated with third-party reinsurance, or decreased ability to obtain reinsurance at acceptable terms; and increased likelihood of, or increased magnitude of, asset impairments caused by market fluctuations.
Adverse economic conditions may result from global economic and political developments, including plateauing business activity and inflationary pressures in developed economies, including the United States, civil unrest, geopolitical tensions, foreign investment restrictions, or military action and new or evolving legal and regulatory requirements on business investment, hiring, migration, labor supply and global supply chains. These and other market, economic, and political factors have and could continue to have an adverse effect on our businesses, results of operations, financial condition and liquidity in many ways, including (i) lower levels of consumer and commercial business activities that have decreased and may continue to decrease revenues and profitability and thus impair goodwill, deferred tax assets or other long-term assets, (ii) widening of credit spreads and higher than expected defaults that could reduce investment asset valuations, increase credit losses across numerous asset classes, and increase statutory capital requirements, (iii) increased market volatility and uncertainty that could decrease liquidity, increase borrowing costs and limit access to capital markets, (iv) the reduction of investment income generated by our investment portfolio, (v) disruption to our business operations in countries experiencing geopolitical tensions as well as increased costs associated with meeting customer needs in such regions, and (vi) impeding our ability to execute strategic transactions.
For information regarding the effects of the COVID-19 pandemic on the global economy, see Market Conditions – “COVID-19 has adversely affected, and is expected to continue to adversely affect, our global business, results of operations, financial condition and liquidity, and its ultimate impact will depend on future developments that are uncertain and cannot be predicted” above.
Sustained low, declining or negative interest rates, or rapidly increasing interest rates, have materially and adversely affected and may continue to materially and adversely affect our profitability. Global interest rates have been at or near historic lows, even after an increase in interest rates during 2021. Changes in interest rates may be correlated with inflation trends, which would impact our loss trends. Sustained low interest rates have negatively affected and may continue to negatively affect the performance of our investments and reduce the level of investment income earned on our investment portfolios. We experience lower investment income as well as lower sales of new Life and Retirement insurance products and policies when a low or declining U.S. interest rate environment persists, and/or interest rates turn or, in certain circumstances remain negative across various global economies. For example, the current low interest rate environment has negatively affected sales of interest rate sensitive products in our industry and negatively impacted the profitability of our existing business as we reinvest cash flows from investments, including due to increased calls and prepayments of fixed maturity securities and mortgage loans, at rates below the average yield of our existing portfolios. Due to practical and capital markets limitations, we have not been and may not be able to fully mitigate our interest rate risk by matching exposure of our assets relative to our liabilities. Continued low levels of interest rates have and could continue to impair our ability to earn the returns assumed in the pricing and the reserving for our products at the time they were sold and issued.
28 AIG | 2021 Form 10-K
In addition, fluctuations in interest rates may expose us to the risk of increases in certain statutory reserve requirements that are based on formulas or models that consider interest rates, which would reduce statutory capital, and increases in capital requirements and the amount of assets we must maintain to support statutory reserves, which would reduce surplus.
On the other hand, in periods of rapidly increasing interest rates, we may not be able to replace, in a timely manner, the investments in our general account with higher yielding investments needed to keep interest rate sensitive products competitive. Therefore, we may have to accept a lower investment spread and, thus, lower profitability, or face a decline in sales and greater loss of existing contracts and related assets. In addition, policy loans, surrenders and withdrawals tend to increase as policyholders seek investments with higher perceived returns as interest rates rise. These impacts may result in significant cash outflows requiring that we sell investments at a time when the prices of those investments are adversely affected by the increase in interest rates, which could result in realized investment losses. An increase in interest rates could also have a material adverse effect on the value of our investment portfolio, for example, by decreasing the estimated fair values of the fixed income securities that constitute a substantial portion of our investment portfolio. This in turn could adversely affect our ability to realize our deferred tax assets.
Reserves and Exposures
The amount and timing of insurance and reinsurance liability claims are difficult to predict and such claims may exceed the related liability for unpaid losses and loss adjustment expenses or future policy benefits, or the liabilities associated with certain guaranteed benefits and indexed features accounted for as embedded derivatives at fair value. We regularly review the adequacy of the established liability for unpaid losses and loss adjustment expenses and future policy benefits, as well as liabilities associated with certain guaranteed benefits and indexed features accounted for as embedded derivatives at fair value. We also conduct extensive analyses of our reserves and embedded derivatives during the year. Our liability for unpaid losses and loss adjustment expenses, future policy benefits and embedded derivatives, however, may develop adversely and materially impact our businesses, results of operations, financial condition and liquidity.
For General Insurance, estimation of ultimate net losses, loss expenses and the liability for unpaid losses and loss adjustment expenses is a complex process, particularly for both long-tail and medium-tail liability lines of business. These lines include, but are not limited to, excess casualty, workers’ compensation, general liability, commercial automobile liability, environmental and crisis management coverages, Financial Lines, insurance and risk management programs for large corporate customers and other customized structured insurance products, as well as excess and umbrella liability, errors and omissions, products liability, programs and specialty. There is also greater uncertainty in establishing reserves with respect to new business, particularly new business involving recently introduced product lines. In these cases, there is less historical experience or knowledge and less data upon which the actuaries can rely. Estimating reserves is further complicated by unexpected claims or unintended coverages that emerge due to unexpected events, such as COVID-19. These emerging issues may increase the size or number of claims beyond our underwriting intent and may not become apparent for many years after a policy is issued.
While we use a number of analytical reserve development techniques to project future loss development, the liability for unpaid losses and loss adjustment expenses has been and may continue to be significantly affected by changes in loss cost trends or loss development factors that were relied upon in setting the liability for unpaid losses and loss adjustment expenses. These changes in loss cost trends or loss development factors could be due to changes in actual versus expected claims and losses, difficulties in predicting changes, such as changes in inflation, unemployment, or other social or economic factors affecting claims, including the effects of the COVID-19 pandemic, judicial and legislative actions, and changes in the tort environment. Any deviation in loss cost trends or in loss development factors might not be identified for an extended period of time after we record the initial loss reserve estimates for any accident year or number of years.
For Life and Retirement, establishment and ongoing calculations of future policy benefits and related reinsurance assets is a complex process, with significant judgmental inputs, assumptions and modeling techniques. The inputs and assumptions used in connection with calculations of reserves for future policy benefits are inherently uncertain. Experience may develop adversely such that additional reserves must be established or the value of embedded derivatives may increase. Adverse experience could arise out of a number of factors, including, but not limited to, severe short-term events, such as a pandemic or changes to policyholder behavior during stressed economic periods, or due to misestimation of long-term assumptions such as mortality, interest rates, credit spreads, equity market levels and volatility and persistency assumptions. Certain variables, such as policyholder behavior, are difficult to estimate and can have a significant impact on reserves and embedded derivatives. Life and Retirement reviews and updates actuarial assumptions at least annually, typically in the third quarter for reserves and embedded derivatives. Additionally, Life and Retirement regularly carries out loss recognition testing for GAAP reporting and cash flow testing for statutory reporting.
For additional information on reserve development, see Part II, Item 7. MD&A – Insurance Reserves.
For additional information on our loss reserves, see Part II, Item 7. MD&A – Critical Accounting Estimates – Loss Reserves and Note 12 to the Consolidated Financial Statements.
AIG | 2021 Form 10-K 29
For additional information regarding these products, see Notes 4 and 13 to the Consolidated Financial Statements, Item 1. Business – Regulation, and Part II, Item 7. MD&A – Critical Accounting Estimates – Liabilities for Guaranteed Benefit Features of Variable Annuity, Fixed Annuity and Fixed Index Annuity Products.
Reinsurance may be unavailable or too expensive relative to its benefit, and may not be adequate to protect us against losses. Our subsidiaries are major purchasers of third-party reinsurance and we use reinsurance as part of our overall risk management strategy. Our reinsurance business also purchases retrocessional reinsurance, which allows a reinsurer to cede to another company all or part of the reinsurance obligations originally assumed by the reinsurer. While reinsurance does not discharge our subsidiaries from their obligation to pay claims for losses insured or reinsured under our policies, it does make the reinsurer liable to the subsidiaries for the reinsured portion of the risk. For this reason, reinsurance is an important tool to manage transaction and insurance line risk retention and to mitigate losses, including as a result of catastrophes. Market conditions beyond our control may impact the availability and cost of reinsurance or retrocessional reinsurance and could have a material adverse effect on our business, results of operations and financial condition. For example, reinsurance is typically more difficult or costly to obtain after a year or consecutive years with a large number of major catastrophes. We may, at certain times, be forced to incur additional costs for reinsurance or may be unable to obtain sufficient reinsurance on acceptable terms. In the latter case, we would have to accept an increase in exposure to risk, reduce the amount of business written by our subsidiaries or seek alternatives in line with our risk limits, or a combination thereof.
Additionally, we are exposed to credit risk with respect to our subsidiaries’ reinsurers to the extent the reinsurance receivable is not secured, or is inadequately secured, by collateral or does not benefit from other credit enhancements. We also bear the risk that a reinsurer is, or may be, unwilling to pay amounts we have recorded as reinsurance recoverables for any reason, including that (i) the terms of the reinsurance contract do not reflect the intent of the parties to the contract or there is a disagreement between the parties as to their intent, or (ii) the terms of the contract cannot be legally enforced. We also bear the risk that (i) the terms of the contract are interpreted by a court or arbitration panel differently than expected, (ii) the reinsurance transaction performs differently than we anticipated compared to the original structure, terms or conditions, or (iii) a change in laws and regulations, or in the interpretation of the laws and regulations, materially impacts a reinsurance transaction. The insolvency of one or more of our reinsurers, the inability or unwillingness of such reinsurers to make timely payments under the terms of our contracts or payments in an amount equal to our reinsurance recoverable, or the risk that the reinsurance transaction does not operate as intended, could have a material adverse effect on our results of operations and liquidity.
Additionally, the use of reinsurance placed in the capital markets may not provide the same levels of protection as traditional reinsurance transactions. Any disruption, volatility and uncertainty in these markets, such as following a major catastrophic event, may limit our ability to access such markets on terms favorable to us or at all. Also, to the extent that we intend to use structures based on an industry loss index or other non-indemnity trigger rather than on actual losses incurred by us, we could be subject to residual risk.
Our Life and Retirement companies also utilize intercompany reinsurance arrangements to provide capital benefits to their affiliated cedants. They have also begun and may continue to pursue reinsurance transactions and permitted practices to manage the capital impact of statutory reserve requirements under applicable reserving rules, including principle-based reserving (PBR). The application of actuarial guidelines and PBR involves numerous interpretations. If state insurance departments do not agree with our interpretations or if regulations change with respect to our ability to manage the capital impact of certain statutory reserve requirements, the statutory reserve requirements of our Life and Retirement companies could increase, or the ability of our Life and Retirement companies to take reserve credit for reinsurance transactions could be reduced or eliminated. Additionally, if the ratings of our Life and Retirement companies decline, we could incur higher costs to obtain reinsurance, each of which could adversely affect sales of our products and our financial condition or results of operations.
We currently have limited catastrophe reinsurance coverage for terrorist attacks. Further, the availability of private sector reinsurance for terrorism is limited. We benefit from the Terrorism Risk Insurance Program Reauthorization Act (TRIPRA), which provides U.S. government risk assistance to the insurance industry to manage the exposure to terrorism incidents in the U.S. TRIPRA was reauthorized in December 2019 for a further seven years. Under TRIPRA, once our losses for certain acts of terrorism exceed a deductible equal to 20 percent of our direct commercial property and casualty insurance premiums for covered lines for the prior calendar year, the federal government will reimburse us for 80 percent of losses in excess of our deductible, up to a total industry program limit of $100 billion. TRIPRA does not cover losses in certain lines of business such as personal property and personal casualty. We also rely on the government sponsored and government arranged terrorism reinsurance programs, including pools, in force in applicable non-U.S. jurisdictions.
For additional information on our reinsurance recoverable, see Part II, Item 7. MD&A – Enterprise Risk Management – Insurance Risks – Reinsurance Activities – Reinsurance Recoverable.
30 AIG | 2021 Form 10-K
For information regarding the impact of the Majority Interest Fortitude sale on our reinsurance program, see Reserves and Exposures – “Following the Majority Interest Fortitude Sale, our largest reinsurance counterparty, Fortitude Re, is no longer controlled by us, and a failure by Fortitude Re to perform its obligations could have a material effect on our business, results of operations or liquidity and the accounting treatment of our reinsurance agreements with Fortitude Re could also lead to volatility in our net income” below.
For information regarding the effects of the COVID-19 pandemic on our reinsurance program, see Market Conditions – “COVID-19 has adversely affected, and is expected to continue to adversely affect, our global business, results of operations, financial condition and liquidity, and its ultimate impact will depend on future developments that are uncertain and cannot be predicted” above.
Our consolidated results of operations, liquidity, financial condition and ratings are subject to the effects of natural and man-made catastrophic events. Events such as hurricanes, windstorms, hailstorms, flooding, earthquakes, wildfires, solar storms, war or other military action, acts of terrorism, explosions and fires, cyber-crimes, product defects, pandemics and other highly contagious diseases, mass torts, civil unrest and other catastrophes have adversely affected our business in the past and could do so in the future. For example, we incurred pre-tax catastrophe losses of $1.4 billion in 2021, which included losses in our General Insurance business from flooding and rainstorms, windstorms and hailstorms and winter storms, and pre-tax catastrophe losses of $2.4 billion in 2020, which included losses in our General Insurance business from the COVID-19 pandemic, windstorms and hailstorms, hurricanes, wildfires and civil unrest.
Catastrophic events, and any relevant regulations, could result in losses in any business in which we operate, and could expose us to:
widespread claim costs associated with property, workers’ compensation, accident and health, travel, business interruption and mortality and morbidity claims;
loss resulting from a decline in the value of our invested assets;
limitations on our ability to recover deferred tax assets;
loss resulting from actual policy experience that is adverse compared to the assumptions made in product pricing;
revenue loss due to decline in customer base;
declines in value and/or losses with respect to companies and other entities whose securities we hold and counterparties we transact business with and have credit exposure to, including reinsurers; and
significant disruptions to our physical infrastructure, systems and operations.
Natural and man-made catastrophic events are generally unpredictable. Our exposure to catastrophe-related loss depends on various factors, including the frequency and severity of the catastrophes, the availability of reinsurance, the rate of inflation and the value and geographic or other concentrations of insured companies and individuals. Vendor models and proprietary assumptions and processes that we use to manage catastrophe exposure may prove to be ineffective due to incorrect assumptions or estimates. For example, modeling for terrorism, cyber events and pandemics is more difficult and may be less reliable.
In addition, legislative and regulatory initiatives and court decisions following major catastrophes (both natural and man-made) could require us to pay the insured beyond the provisions of the original insurance policy and may prohibit the application of a deductible, resulting in inflated and unanticipated claims; or impose other restrictions after the occurrence of a major catastrophe, which would reduce our ability to mitigate exposure.
For additional information on potential catastrophic events, including a sensitivity analysis of our exposure to certain catastrophes, see Part II, Item 7. MD&A – Enterprise Risk Management – Insurance Risks.
For information regarding the effects of climate change on our business, see Reserves and Exposures – “Climate change may adversely affect our business and financial condition” below.
For information regarding the effects of the COVID-19 pandemic on our business, see Market Conditions – “COVID-19 has adversely affected, and is expected to continue to adversely affect, our global business, results of operations, financial condition and liquidity, and its ultimate impact will depend on future developments that are uncertain and cannot be predicted” above.
Concentration of our insurance, reinsurance and other risk exposures may have adverse effects. We are exposed to risks as a result of concentrations in our insurance and reinsurance policies, investments, derivatives and other obligations that we undertake for customers and counterparties. We manage these risks related to concentration by monitoring the accumulation of our exposures to factors such as exposure type and size, industry, geographic region, counterparty and other factors. We also seek to use third-party reinsurance, hedging and other arrangements to limit or offset exposures that exceed our retention and risk appetite limits. In certain circumstances, however, these risk management arrangements may not be available on acceptable terms or may prove to be ineffective. Our risk exposures under insurance and reinsurance policies, derivatives and other obligations are, from time to time, compounded by risk exposure assumed in our investment business. Also, our exposure for certain single risk coverages and other
AIG | 2021 Form 10-K 31
coverages may be so large that adverse experience compared to our expectations may have a material adverse effect on our consolidated results of operations or result in additional statutory capital requirements for our subsidiaries.
In addition, the separation of our Life and Retirement business, if completed, could increase the materiality of these potential concentrations in the remaining portfolio. For additional information on risks associated with the separation of the Life and Retirement business from AIG, see Business Operations – “No assurances can be given that the separation of our Life and Retirement business will occur or as to the specific terms or timing thereof. In addition, the separation could cause the emergence or exacerbate the effects of other risks to which AIG is exposed” below.
Also see Part II, Item 7. MD&A – Business Segment Operations – General Insurance – Business Strategy and – Outlook – Industry and Economic Factors, and Part II, Item 7. MD&A – Business Segment Operations – Life and Retirement – Business Strategy and – Outlook – Industry and Economic Factors.
Following the Majority Interest Fortitude Sale, our largest reinsurance counterparty, Fortitude Re, is no longer controlled by us, and a failure by Fortitude Re to perform its obligations could have a material effect on our business, results of operations or liquidity and the accounting treatment of our reinsurance agreements with Fortitude Re could also lead to volatility in our net income. As of June 2, 2020, we completed the Majority Interest Fortitude Sale (as defined in Item 7. Executive Summary – Sale of Fortitude Holdings), upon which Fortitude Group Holdings, LLC (Fortitude Holdings), the parent of Fortitude Re, became controlled 71.5% by affiliates of The Carlyle Group Inc. and 25% by affiliates of T&D Holdings, Inc., and our ownership interest in Fortitude Holdings was reduced to 3.5%. As of December 31, 2021, approximately $29.6 billion of reserves from AIG’s Life and Retirement Run-Off Lines and approximately $3.8 billion of reserves from AIG’s General Insurance Run-Off Lines, related to business written by multiple wholly-owned AIG subsidiaries, had been ceded to Fortitude Re under these reinsurance transactions. These reserve balances are fully collateralized pursuant to the terms of the reinsurance agreements. While we retained a seat on the board of managers of Fortitude Holdings, our ability to influence its operations going forward will be very limited. Our subsidiaries continue to remain primarily liable to policyholders under the business reinsured by Fortitude Re. As a result, if Fortitude Re is unable to successfully operate independently, or other issues arise that affect its financial condition or ability to satisfy or perform its obligations to our subsidiaries under the various reinsurance arrangements in force between Fortitude Re and such subsidiaries, we could experience a material adverse effect on our results of operations and liquidity to the extent the amount of collateral posted in respect of our reinsurance receivable is inadequate. Further, as is customary in similar reinsurance agreements, upon the occurrence of certain termination and recapture triggers on the part of Fortitude Re under the applicable reinsurance agreements, our subsidiaries may elect or may be required, to recapture the business ceded under such reinsurance agreements, which would result in a substantial increase to our net insurance liabilities and an increase in our solvency capital requirements. These termination and recapture triggers are standard termination and recapture events and include Fortitude Re becoming insolvent or being placed into liquidation, rehabilitation, conservatorship, supervision, receivership, bankruptcy or similar proceedings, certain regulatory ratios falling below certain thresholds, in the case of those reinsurance agreements made with Life and Retirement, Fortitude Re’s failure to perform under the reinsurance agreements, or its entry into certain transactions without receiving our consent. Additionally, beginning in June 2023, Fortitude Re will have certain rights to replace AIG Asset Management (U.S.), LLC (AMG) as investment manager with respect to the assets supporting the reinsurance and to direct our subsidiaries to appoint a replacement investment manager with respect to those assets, if such appointment is reasonably acceptable to our subsidiaries and subject to the satisfaction of certain other conditions. If Fortitude Re were to so direct our subsidiaries to appoint another investment manager to replace AMG as investment manager with respect to the assets supporting the reinsurance, it could disrupt our internal investment advisory capabilities and cause a reduction in management fees received by AMG, which could result in a material adverse effect on our business, results of operations and financial condition.
Furthermore, the reinsurance transactions between AIG and Fortitude Re are structured as modified coinsurance (modco) for the Life and Retirement Run-Off Lines and loss portfolio transfer arrangements with funds withheld for the General Insurance Run-Off Lines. In modco and funds withheld arrangements, the investments supporting the reinsurance agreements, and which reflect the majority of the consideration that would be paid to the reinsurer for entering into the transaction, are withheld by, and therefore continue to reside on the balance sheet of, the ceding company (i.e., AIG and its subsidiaries) thereby creating an obligation for the ceding company to pay the reinsurer (i.e., Fortitude Re) at a later date. Additionally, as AIG maintains ownership of these investments, AIG will maintain its existing accounting for these assets (e.g., the changes in fair value of available for sale securities will be recognized within other comprehensive income). As a result of the deconsolidation resulting from the Majority Interest Fortitude Sale, AIG has established a funds withheld payable to Fortitude Re while simultaneously establishing a reinsurance asset representing reserves for the insurance coverage that Fortitude Re has assumed. The funds withheld payable contains an embedded derivative and changes in fair value of the embedded derivative related to the funds withheld payable are recognized in earnings through realized gains (losses). This embedded derivative is considered a total return swap with contractual returns that are attributable to various assets and liabilities associated with these reinsurance agreements. The manner in which we account for these various reinsurance agreements has and will continue to lead to volatility in our GAAP net income.
32 AIG | 2021 Form 10-K
For additional information on the sale of Fortitude Holdings see Part II, Item 7. MD&A – Consolidated Results of Operations.
For additional information on our exposure to credit risk of reinsurers, see Reserves and Exposures – “Reinsurance may be unavailable or too expensive relative to its benefit, and may not be adequate to protect us against losses” above.
Our subsidiaries may be required to accelerate the amortization of deferred policy acquisition costs (DAC) and record additional liabilities for future policy benefits due to interest rate fluctuations, increased lapses and surrenders, declining investment returns and other events. We incur significant costs in connection with acquiring new and renewal insurance business. DAC represents deferred costs that are incremental and directly related to the successful acquisition of new business or renewal of existing business. The recovery of these costs is generally dependent upon the future profitability of the related business, but DAC amortization varies based on the type of contract. For long-duration traditional business, DAC is generally amortized in proportion to premium revenue and varies with lapse experience. Actual lapses in excess of expectations can result in an acceleration of DAC amortization, and therefore, adversely impact our pre-tax income.
DAC for investment-oriented products is generally amortized in proportion to actual and estimated gross profits. Estimated gross profits are affected by a number of factors, including levels of current and expected interest rates, net investment income and credit spreads, net realized gains and losses, fees, surrender rates, mortality experience, policyholder behavior experience and equity market returns and volatility. If actual and/or future estimated gross profits are less than originally expected, then the amortization of these costs would be accelerated in the period this is determined and would result in a charge to income. For example, if interest rates rise rapidly and significantly, customers with policies that have interest crediting rates below the current market may seek competing products with higher returns and we may experience an increase in surrenders and withdrawals of life and annuity contracts, and thereby a strain on cash flow. Additionally, this would also result in a decrease in expected future profitability and an acceleration of the amortization of DAC, and therefore lower than expected pre-tax income earned during the then current period.
We also periodically review products for potential loss recognition events, principally insurance-oriented products. This review involves estimating the future profitability of in-force business and requires significant management judgment about assumptions including, but not limited to, mortality, morbidity, persistency, maintenance expenses and investment returns, including net realized gains (losses). If actual experience or revised future expectations result in projected future losses, we may be required to amortize any remaining DAC and record additional liabilities through a charge to policyholder benefits and losses occurred in the then current period, which could negatively affect our business, results of operations, financial condition and liquidity.
For additional information on DAC and future policy benefits, see Part II, Item 7. MD&A – Critical Accounting Estimates and Notes 8 and 12 to the Consolidated Financial Statements.
For additional information on changes to accounting standards for long-duration insurance contracts, see Estimates and Assumptions – “Changes in accounting principles and financial reporting requirements will impact our consolidated results of operations and financial condition.”
Losses due to nonperformance or defaults by counterparties may materially and adversely affect the value of our investments, our profitability and sources of liquidity. We are exposed to credit risk arising from exposures to various counterparties related to investments, derivatives, premiums receivable, certain General Insurance businesses and reinsurance recoverables. These counterparties include, but are not limited to, issuers of fixed income and equity securities we hold, borrowers of loans we hold, customers, plan sponsors, trading counterparties, counterparties under swaps and other derivatives instruments, reinsurers, corporate and governmental entities whose payments or performance we insure, joint venture partners, clearing agents, exchanges, clearing houses, custodians, brokers and dealers, commercial banks, investment banks, intra-group counterparties with respect to derivatives and other third parties, financial intermediaries and institutions and guarantors. These counterparties may default on their obligations to us due to bankruptcy, insolvency, receivership, financial distress, lack of liquidity, adverse economic conditions, operational failure, fraud, government intervention and other reasons. In addition, for exchange-traded derivatives, such as futures, options as well as "cleared" over-the-counter derivatives, we are generally exposed to the credit risk of the relevant central counterparty clearing house and futures commission merchants through which we clear derivatives. Defaults by these counterparties on their obligations to us could have a material adverse effect on the value of our investments, business, financial condition, results of operations and liquidity.
An insolvency of, or the appointment of a receiver to rehabilitate or liquidate, a significant competitor could negatively impact our business if such appointment were to impact consumer confidence in our products and services. Additionally, if the underlying assets supporting the structured securities we invest in are expected to default or actually default on their payment obligations, our securities may incur losses.
In addition, our exposure to credit risk may be exacerbated in periods of market or credit stress, as derivative counterparties take a more conservative view of their acceptable credit exposure to us, resulting in reduced capacity to execute derivative-based hedges.
AIG | 2021 Form 10-K 33
Climate change may adversely affect our business and financial condition. AIG supports the scientific consensus that climate change is a reality of increasing global concern. Climate change, indicated by higher concentrations of greenhouse gases, a warming atmosphere and ocean, wildfires, diminished snow and ice, and a rise in sea levels, appears to have contributed to an increase in the frequency and severity of natural disasters and the creation of uncertainty as to future trends and exposures. As such, climate change presents significant financial implications for the insurance industry in areas such as underwriting, claims and investments, as well as risk capacity, financial reserving and operations.
Climate change presents challenges to our ability to effectively underwrite, model and price catastrophe risk particularly if the frequency and severity of catastrophic events such as pandemics, hurricanes, tornadoes, floods, wildfires and windstorms and other natural disasters continue to increase. For example, losses resulting from actual policy experience may be adverse as compared to the assumptions made in product pricing as well as mortality assumptions and our ability to mitigate our exposure may be reduced.
Climate change-related risks may also adversely impact the value of the securities that we hold or lead to credit risk of other counterparties we transact business with, including reinsurers. Our reputation or corporate brand could also be negatively impacted as a result of changing customer or societal perceptions of organizations that we either insure or invest in due to their actions (or lack thereof) with respect to climate change. Any policies adopted by investors to address changing societal perceptions on climate change, could result in increased compliance cost to our businesses and changes to our corporate governance and risk management practices, and may affect the type of assets we hold in our investment portfolio.
In addition, regulators have imposed and may continue to impose new requirements or issue new guidance aimed at addressing or mitigating climate change-related risks. For example, on November 15, 2021, the NYDFS issued final guidance on how New York insurers are expected to analyze and manage the risks posed by climate change, including by integrating the consideration of climate risks into the insurer’s governance structure, considering the current and forward-looking impact of climate-related factors on the insurer’s business environment and incorporating climate risks into the insurer’s existing financial risk management. The NYDFS expects New York insurers to implement its guidance relating to board governance and to have specific plans in place to implement the guidance relating to organizational structure by August 15, 2022. Additional actions by foreign governments, regulators and international standard setters could result in substantial additional regulation to which we may be subject. It is also possible that the laws and regulations adopted in foreign jurisdictions regarding climate change-related risks will differ from one another, and that they could be inconsistent with the laws and regulations of other jurisdictions in which we operate, including the United States.
Additionally, litigation related to climate change has increased in recent years. Many lawsuits center on enforcement or interpretation of environmental laws and regulations, often seeking to use litigation as a tool to influence governmental and corporate climate policies. Other cases seek damages for contribution to climate change or for insufficient disclosure around material financial risks. Increased litigation of this nature could trigger losses under liability policies, such as directors’ and officers’ insurance policies, increase our liabilities and affect the viability of certain of our business lines.
In addition, severe weather and other effects of climate change result in more frequent and more severe damages, leading to lawsuits. Wildfires in the western U.S., resulting in significant litigation liability for utility companies, are an example of this. Indirect climate change effects are also seen in litigation over flooding, mudslides and other severe weather that results in injury or damage, as well as in construction defect litigation, chemical release lawsuits, and workers’ compensation claims. Litigation related to climate change may, through increased claims from our customers and adverse impacts to the value of the securities that we hold adversely impact our business and results of operations.
We also have faced and may continue to face business continuity risk as a result of climate change-related incidents that may disrupt business operations, including extreme weather events. We cannot predict the long-term impacts of climate change on our business and results of operations.
For information regarding risks associated with other catastrophic events, see Reserves and Exposures – “Our consolidated results of operations, liquidity, financial condition and ratings are subject to the effects of natural and man-made catastrophic events” above.
INVESTMENT PORTFOLIO AND CONCENTRATION OF INVESTMENTS
Our investment portfolio is concentrated in certain segments of the economy, and the performance and value of our investment portfolio are subject to a number of risks and uncertainties, including changes in interest rates and credit spreads. In addition, a significant portion of our investment portfolio is now managed by Blackstone, which makes its performance and value subject to Blackstone’s ability to successfully manage it. Our results of operations and financial condition have in the past been, and may in the future be, adversely affected by the degree of concentration in our investment portfolio. For example, we have significant holdings of real estate and real estate-related investments, including residential mortgage-backed, commercial mortgage-backed and other asset-backed securities and residential and commercial mortgage loans. We also have significant exposures to financial institutions and, in particular, to money center banks and global banks, certain industries, such as energy and utilities, the U.S. federal, state and local government issuers and authorities, and global financial institutions,
34 AIG | 2021 Form 10-K
governments and corporations. Events or developments that have a negative effect on any particular industry, asset class, group of related industries or geographic region may adversely affect the valuation of our investments to the extent they are concentrated in such segments. Our ability to sell assets in such segments may be limited.
Our investments are also subject to market risks and uncertainties, including, in addition to interest rate risk, changes in the level of credit spreads, currency rates, and commodity and equity prices, each of which has affected and will continue to affect the value of investments in our investment portfolio as well as the performance of, and returns generated by, such investments. The discontinuation of actions taken by legislators and monetary authorities in advance of substantial economic recovery could adversely impact the performance of our investment portfolio. For information regarding risks associated with interest rate volatility, see Market Conditions – “Sustained low, declining or negative interest rates, or rapidly increasing interest rates, have materially and adversely affected and may continue to materially and adversely affect our profitability” above.
Furthermore, our alternative investment portfolio, which is subject to volatility in equity markets, includes investments for which changes in fair value are reported through pre-tax income. An economic downturn or decline in the capital markets may have a material adverse effect on our investment income, including as a result of decreases in the fair value of alternative investments.
In addition, in connection with its acquisition of a 9.9 percent equity stake in SAFG Retirement Services, Inc. (SAFG), AIG entered into a long-term asset management relationship with Blackstone, pursuant to which Blackstone is managing an initial $50 billion of Life and Retirement’s existing investment portfolio, with that amount increasing by increments of $8.5 billion per year for the next five years beginning in the fourth quarter of 2022, for an aggregate of $92.5 billion. As part of this arrangement, Blackstone is serving as the exclusive external investment manager for certain asset classes, which is expected to lead to an increase in investment management fees payable by us as compared to expenses we have historically incurred for similar services. Also, the exclusivity provisions and termination provisions may prevent our subsidiaries from retaining other external investment managers with respect to the subject asset classes who may produce better returns on investments than Blackstone. Furthermore, Blackstone’s ability to allocate and invest our assets across a range of suitable investment opportunities may be limited in certain circumstances due to compliance with the asset management agreements (including the investment and allocation guidelines thereunder). If Blackstone is unable to effectively manage our portfolio, the concentration of assets in our portfolio that are managed by Blackstone could adversely affect our business, results of operations, financial condition and liquidity.
Our valuation of investments and derivatives involves the application of methodologies and assumptions to derive estimates, which may differ from actual experience and could result in changes to investment valuations that may materially adversely affect our business, results of operations, financial condition and liquidity or lead to volatility in our net income. During periods of market disruption, it has been and may continue to be difficult to value certain of our investments or derivatives if trading becomes less frequent and/or market data becomes less observable. There may be cases where certain assets in normally active markets with significant observable data become inactive with insufficient observable data due to the financial environment or market conditions in effect at that time. As a result, valuations may include inputs and assumptions that are less observable or require greater estimation and judgment as well as valuation methods that are more complex. These values may not be realized in a market transaction, may not reflect the value of the asset and may change very rapidly as market conditions change and valuation assumptions are modified. Decreases in value and/or an inability to realize that value in a market transaction or other disposition may have a material adverse effect on our business, results of operations, financial condition and liquidity.
For information regarding volatility in accounting as it relates to Fortitude Re, see Reserves and Exposures – “Following the Majority Interest Fortitude Sale, our largest reinsurance counterparty, Fortitude Re, is no longer controlled by us, and a failure by Fortitude Re to perform its obligations could have a material effect on our business, results of operations or liquidity and the accounting treatment of our reinsurance agreements with Fortitude Re could also lead to volatility in our net income” above.
LIQUIDITY, CAPITAL AND CREDIT
AIG Parent’s ability to access funds from our subsidiaries is limited, and our sources of liquidity may be insufficient to meet our needs, including providing capital that may be required by our subsidiaries. As a holding company, AIG Parent depends on dividends, distributions and other payments from its subsidiaries to fund dividends on AIG Common Stock and Series A Preferred Stock, to fund repurchases of AIG Common Stock and debt obligations and to make payments due on its obligations, including its outstanding debt and tax obligations. The majority of our investments are held by our regulated subsidiaries. Any inability by our subsidiaries to make payments, dividends or other distributions in an amount sufficient to enable AIG Parent to meet its cash requirements could have an adverse effect on our operations, and on our ability to pay dividends, repurchase AIG Common Stock and debt obligations, meet our debt service obligations, pay our operating expenses and meet capital and liquidity needs of our other subsidiaries.
AIG | 2021 Form 10-K 35
The ability of our subsidiaries to pay dividends or other distributions to us in the future will depend on their earnings, tax considerations, covenants contained in any financing or other agreements, applicable regulatory restrictions and rating agency requirements. In addition, such payments could be limited as a result of claims against our subsidiaries by their creditors, including suppliers, vendors, lessors and employees. In addition, our insurance subsidiaries are limited in their ability to make dividend payments or other distributions to AIG Parent in the future because of the need to support their own capital levels or because of regulatory limits and restrictions. Such restrictions are based in part on the prior year’s statutory income, capital and surplus, and unassigned funds (surplus) and require our insurance subsidiaries to hold a specific amount of minimum reserves in order to meet future obligations on their outstanding policies. Changes in, or reinterpretations of, these regulatory standards could constrain the ability of our subsidiaries to pay dividends or to advance or repay funds in sufficient amounts and at times necessary to meet our debt obligations and corporate expenses.
Our decision to pursue strategic changes or transactions in our business and operations may also subject our subsidiaries’ dividend plans to heightened regulatory scrutiny and could make obtaining regulatory approvals for extraordinary distributions by our subsidiaries, if required, more difficult. We are also subject to certain other restrictions on our capital from time to time.
Certain of our subsidiaries, for example, need sufficient liquidity in order to maintain regulatory capital ratios, comply with rating agency requirements, meet unexpected cash flow obligations, satisfy capital maintenance and guarantee agreements and collateralize debt. If our liquidity is insufficient to meet our needs, we may need to have recourse to third-party financing, external capital markets or other sources of liquidity, which may not be available or could be expensive. The availability and cost of any additional financing at any given time depends on a variety of factors, including general market conditions, the volume of trading activities, the overall availability of credit, regulatory actions and our credit ratings and credit capacity. It is also possible that, as a result of such recourse to external financing, customers, lenders or investors could develop a negative perception of our long- or short-term financial prospects. Disruptions, volatility and uncertainty in the financial markets, and downgrades in our financial strength or credit ratings, may limit our ability to access external capital markets at times and on terms favorable to us to meet our capital and liquidity needs or restrict our access to the external capital markets or other financing sources. If AIG Parent is unable to satisfy a capital need of a subsidiary, the credit rating agencies could downgrade the subsidiary’s financial strength ratings or the subsidiary could become insolvent or, in certain cases, could be seized by its regulator.
In the ordinary course of our business, we are required to post collateral for our insurance company subsidiaries from time to time. If our reinsurance liabilities increase, we may be required to post additional collateral for insurance company clients that we reinsure. In addition, we may be required to post additional collateral due to regulatory changes from time to time. The need to post this additional collateral, if significant enough, may require us to sell investments at a loss in order to provide securities of suitable credit quality or otherwise secure adequate capital at an unattractive cost. This could adversely impact our business, financial condition, results of operations and cash flows.
For additional information on our liquidity, see Part II, Item 7. MD&A – Liquidity and Capital Resources.
For additional information on rating agency requirements, see Liquidity, Capital and Credit – “A downgrade by one or more of the rating agencies in the Insurer Financial Strength ratings of our insurance or reinsurance companies could limit their ability to write or prevent them from writing new business and impair their retention of customers and in-force business, and a downgrade in our credit ratings could adversely affect our business, results of operations, financial condition and liquidity” below.
We may not be able to generate cash to meet our needs due to the illiquidity of some of our investments. We and our subsidiaries have a diversified investment portfolio. However, economic conditions as well as adverse capital market conditions, including a lack of buyers, the inability of potential buyers to obtain financing on reasonable terms, volatility, credit spread changes, interest rate changes, foreign currency exchange rates and/or declines in collateral values have in the past impacted, and may in the future impact, the liquidity and value of our investments.
We have investments in certain securities, including certain fixed income structured and privately placed securities as well as investments in private equity funds and hedge funds, mortgage loans, finance receivables and real estate that are less liquid than other types of securities. Collectively, investments in these assets had a carrying value of $62 billion at December 31, 2021. If it became necessary to sell such assets in a stressed market environment, the prices achieved in any sale of such securities may be lower than their carrying value, which could cause a material adverse effect on our business, financial condition, results of operations and cash flows. Adverse changes in the valuation of real estate and real estate-linked assets, deterioration of capital markets and widening credit spreads have in the past, and may in the future, materially adversely affect the liquidity and the value of our investment portfolios, including our residential and commercial mortgage related securities portfolios.
In the event additional liquidity is required by one or more of our companies, it may be difficult for us to generate additional liquidity by selling, pledging or otherwise monetizing these or other of our investments at reasonable prices and time frames.
36 AIG | 2021 Form 10-K
A downgrade by one or more of the rating agencies in the Insurer Financial Strength ratings of our insurance or reinsurance companies could limit their ability to write or prevent them from writing new business and impair their retention of customers and in-force business, and a downgrade in our credit ratings could adversely affect our business, results of operations, financial condition and liquidity. Insurer Financial Strength (IFS) ratings are an important factor in establishing the competitive position of insurance and reinsurance companies. IFS ratings measure an insurance or reinsurance company’s ability to meet its obligations to contract holders and policyholders.
Credit rating agencies estimate a company’s ability to meet its ongoing financial obligations and high IFS and credit ratings help maintain public confidence in a company’s products, facilitate marketing of products and enhance a company’s competitive position. Downgrades of the IFS ratings of our insurance or reinsurance companies could prevent these companies from selling, or make it more difficult for them to succeed in selling, products and services, make it more difficult for them to obtain new reinsurance or obtain it on reasonable pricing terms or result in increased policy cancellations, lapses and surrenders, termination of, or increased collateral posting obligations under, assumed reinsurance contracts, or return of premiums. Under credit rating agency policies concerning the relationship between parent and subsidiary ratings, a downgrade in AIG Parent’s credit ratings could result in a downgrade of the IFS ratings of our insurance or reinsurance subsidiaries. Similarly, under credit rating agency policies, a downgrade of the IFS ratings of our insurance and reinsurance subsidiaries could also result in a downgrade in AIG Parent’s credit ratings.
In addition, a downgrade of our long-term debt ratings by one or more of the major rating agencies could potentially increase our financing costs and limit the availability of financing. A downgrade would also require us to post additional collateral payments related to derivative transactions to which we are a party, and could permit the termination of these derivative transactions. Additionally, a downgrade in our IFS or credit ratings could cause counterparties to limit or reduce their exposure to us and thus reduce our ability to manage our market risk exposures effectively during times of market stress. This could adversely affect our business, our consolidated results of operations in a reporting period and/or our liquidity.
In response to the announcement by AIG in October 2020 of its intention to separate the Life and Retirement business from AIG, Fitch placed the credit ratings of AIG on “Rating Watch Negative,” Moody’s placed the debt ratings of AIG on review for downgrade and S&P placed the credit ratings of AIG and the financial strength ratings of most of the General Insurance subsidiaries on CreditWatch with negative implications. Moody’s and Fitch affirmed the financial strength ratings and outlooks on our insurance subsidiaries. In connection with the announcement by AIG in July 2021 that it reached a definitive agreement with Blackstone to acquire a 9.9 percent equity stake in our Life and Retirement business, Moody’s lowered its debt ratings of AIG to Baa2 from Baa1 and assigned a stable outlook. Moody’s also revised the outlook on the A2 financial strength ratings of our Life and Retirement subsidiaries to negative from stable. A further downgrade in the credit and debt ratings of AIG could negatively impact our business, results of operations, financial condition and liquidity.
For additional information on rating agency actions in response to AIG’s announced intention to separate its Life and Retirement business from AIG, see Part II, Item 7. MD&A – Liquidity and Capital Resources –Rating Agency Actions Related to the Announced Separation of Life and Retirement.
Changes in the method for determining LIBOR and the continuing phase out of LIBOR and uncertainty related to LIBOR replacement rates may affect our business, results of operations, financial condition and liquidity. We have significant assets, liabilities and obligations with interest rates tied to the London Interbank Offered Rate (LIBOR) for U.S. dollars and other currencies. Starting January 1, 2022, all LIBOR settings either ceased to be provided by any administrator, or are no longer representative for all non-U.S. dollar LIBOR settings and one-week and two-month U.S. dollar (USD) LIBOR settings, and we expect the same will occur immediately after June 30, 2023 for the remaining USD LIBOR settings, absent subsequent action by the relevant authorities. In addition, while GBP and JPY LIBOR is currently being reported on a synthetic basis for certain tenors, there can be no assurance that such non-USD synthetic LIBOR or USD LIBOR will remain available in the future.
Significant recommendations as to alternative rates and as to protocols have been advanced, and continue to be advanced, by various regulators and market participants, including the Alternative Reference Rates Committee of the United States Federal Reserve (ARRC), the International Swaps and Derivatives Association (ISDA), the UK FCA and the U.S. Congress, and legislative action by the State of New York, but there can be no assurance that the various recommendations or legislative action will be effective at preventing or mitigating disruption as a result of the transition. In particular, for U.S. dollar LIBOR, the ARRC has selected the Secured Overnight Financing Rate (SOFR) as its preferred replacement benchmark and has formally recommended, in limited cases, a term rate based on SOFR; both ARRC and ISDA have taken significant steps toward implementing various fallback provisions and protocols; and for British pound sterling, relevant authorities have promoted use of Sterling Overnight Index Average (SONIA) as a replacement for LIBOR. However, the market transition away from LIBOR to alternative reference rates, including SOFR or SONIA, is complex and could result in disruptions, among other things, due to differences between LIBOR (an unsecured forward-looking term rate) and alternative rates that are based on historical measures of overnight secured rates; due to failure of market participants to fully accept such alternative rates; or due to difficulties in amending legacy LIBOR contracts or implementing processes for determining new alternative rates.
AIG | 2021 Form 10-K 37
The consequences of LIBOR reform could adversely affect the market for LIBOR-based securities, the payment obligations under our existing LIBOR-based liabilities and our ability to issue funding agreements bearing a floating rate of interest, as well as the value of financial and insurance products tied to LIBOR, investment portfolio or the substantial amount of derivatives contracts we use to hedge our assets, insurance and other liabilities.
Our actions taken to address the transition from LIBOR for U.S. dollar and other currencies and to mitigate potential risks include, among other things, ensuring new legal contracts, existing legal contracts if necessary and our asset and debt issuances include appropriate LIBOR fallback provisions and identifying fallback provisions in existing contracts and investments which mature after the relevant LIBOR phase-out date; updating valuation and actuarial models that utilize LIBOR; determining the impact of new accounting and tax requirements; adjusting applicable technology applications to be able to support both LIBOR and new alternative rates; and executing and monitoring trades (including test transactions) for derivatives, assets and debt issuances utilizing the new alternative reference rates. We cannot, however, be certain that these measures will effectively mitigate potential risks related to the transition from LIBOR. In addition, we anticipate there may be additional risks to our current processes and information systems that will need to be identified and evaluated by us. Uncertainty as to the nature of such potential changes, alternative reference rates or other reforms could materially and adversely affect our business, results of operations, financial condition and liquidity.
Business and operations
No assurances can be given that the separation of our Life and Retirement business will occur or as to the specific terms or timing thereof. In addition, the separation could cause the emergence or exacerbate the effects of other risks to which AIG is exposed. On October 26, 2020, AIG announced its intention to separate its Life and Retirement business from AIG. On November 2, 2021, Blackstone acquired a 9.9 percent equity stake in SAFG, which is the holding company for AIG’s Life and Retirement business, for $2.2 billion in an all cash transaction, subject to adjustment if the final pro forma adjusted book value is greater or lesser than the target pro forma adjusted book value. Similar to other business dispositions, the separation involves a number of risks, including (i) unanticipated developments that may delay, prevent or otherwise adversely affect our ability to effect a separation; (ii) significant costs and disruption or distraction of management from AIG’s other business operations, whether or not a separation is completed; (iii) satisfaction of various conditions and approvals, including approval by the AIG Board of Directors, and receipt of insurance and other required regulatory approvals, and satisfaction of any applicable requirements of the Securities and Exchange Commission; (iv) other regulatory requirements that could impact our operations or capital requirements or delay or impede completion of a separation; (v) rating agency actions; (vi) unforeseen losses, liabilities or asset impairment arising from the structure of any definitive separation transaction; and (vii) if we are successful in separating the business, increased concentration of our business operations. Further, a valuation allowance may need to be established in the reporting period in which tax deconsolidation occurs with respect to certain tax loss and credit carryforwards to the extent the deconsolidation of the Life and Retirement entities from the AIG consolidated federal income tax group affects our ability to utilize such tax attributes. While we currently believe that, following the sale of 9.9 percent equity stake in SAFG to Blackstone, an initial public offering is the next step in the separation of the Life and Retirement business from AIG, no assurance can be given regarding the form that future separation transactions may take or the specific terms or timing thereof, or that a separation will in fact occur.
In addition, the separation of our Life and Retirement business, if completed, could cause the emergence or exacerbate the effects of many of the other risks noted herein, including: (i) the risk of indemnity claims that could be made against us in connection with divested businesses; (ii) our ability to utilize certain tax loss and credit carryforwards to offset future taxable income going forward; (iii) competition for employees and managing retention of key employees; (iv) maintaining relationships with certain key distributors; (v) concentration of our insurance and other risk exposures; and (vi) increased exposure to certain risks related to deriving revenue from non-U.S. sources. A significant delay in the consummation of the separation could also exacerbate these risks.
For information regarding risks associated with rating agency actions, see Liquidity, Capital and Credit – “A downgrade by one or more of the rating agencies in the Insurer Financial Strength ratings of our insurance or reinsurance companies could limit their ability to write or prevent them from writing new business and impair their retention of customers and in-force business, and a downgrade in our credit ratings could adversely affect our business, results of operations, financial condition and liquidity” above. In addition, see Part II, Item 7. MD&A – Liquidity and Capital Resources – Rating Agency Actions Related to the Announced Separation of Life and Retirement; see also “Business or asset acquisitions and dispositions may expose us to certain risks” below.
Failure to effectively execute on AIG 200 could result in costs that are greater than expected, savings that are less than expected and disruption to our businesses that could have a material effect on our operations or financial condition. In 2019, we announced AIG 200, our global, multi-year and enterprise-wide program involving transformational change across the Company. AIG 200 is comprised of ten operational programs mapped against four core objectives that are complex and require significant investment and resource prioritization. While we are already two years into a three-year program and have delivered on multiple milestones, we still may not fully achieve some or all of the expected benefits from these operational programs, and the work we are undertaking could result in disruption to our businesses and loss of talent. Other risks associated with AIG 200 include delays
38 AIG | 2021 Form 10-K
in execution across the programs, particularly with respect to implementation of technology platforms, lack of sufficient resources to execute on a timely basis, inefficiencies stemming from changes that may be required to programs or sequencing, failure to meet operational and financial targets due to additional priorities or other factors, and the inability to secure regulatory approvals, if and when needed. These risks may impair our ability to achieve anticipated improvements in our businesses or may otherwise harm our operations which could materially and adversely affect our businesses, financial condition and cash flow.
Pricing for our products is subject to our ability to adequately assess risks and estimate related losses. We seek to price our insurance and reinsurance products such that premiums, policy fees and other charges and future net investment income earned on revenues received will result in an acceptable profit in excess of expected claims, assumed expenses and the cost of capital. Our business is dependent on our ability to price our products effectively and charge appropriate premiums. Pricing adequacy depends on a number of factors and assumptions, including proper evaluation of insurance risks, our expense levels, expected net investment income to be realized, our response to rate actions taken by competitors, legal and regulatory developments and the ability to obtain regulatory approval for rate changes. For example, some of our life insurance policies and annuity contracts provide management the right to adjust certain nonguaranteed charges or benefits and interest crediting rates if necessary; however, this right is limited and may be subject to guaranteed minimums or maximums, and the exercise of these rights could result in reputational and/or litigation risk. Management establishes target returns for each product based upon the factors described above, certain underwriting assumptions and capital requirements, including statutory, GAAP and economic capital models. We monitor and manage pricing and sales to achieve target returns on new business, but we may not be able to achieve those returns due to the factors discussed above. Inadequate pricing and the difference between estimated results of the above factors compared to actual results could have a material adverse effect on the profitability of our operations and our financial condition.
Guarantees within certain of our products may increase the volatility of our results. Certain of our annuity and life insurance products include features that guarantee a certain level of benefits, including guaranteed minimum death benefits, guaranteed living benefits, and products with guaranteed interest crediting rates, including crediting rate guarantees tied to the performance of various market indices. Many of these features are accounted for at fair value as embedded derivatives under GAAP, and they have significant exposure to capital markets and insurance risks. An increase in valuation of liabilities associated with the guaranteed features results in a decrease in our profitability and depending on the magnitude of any such increase, could materially and adversely affect our financial condition, including our capitalization, as well as our financial strength ratings.
We employ a capital markets hedging strategy to partially offset the economic impacts of movements in equity, interest rate and credit markets, however, our hedging strategy may not effectively offset movements in our GAAP and statutory surplus and may otherwise be insufficient in relation to our obligations. Furthermore, we are subject to the risk that changes in policyholder behavior or actual levels of mortality/longevity as compared to assumptions in pricing, combined with adverse market events, could produce losses not addressed by the risk management techniques employed. These factors, individually or collectively, may have a material adverse effect on our business, financial condition, results of operations or liquidity including our ability to receive dividends from our operating companies.
For information regarding market risk management related to these product features see Part II, Item 7. MD&A – Enterprise Risk Management – Insurance Risks – Life and Retirement Companies’ Key Risks – Variable Annuity, Index Annuity and Universal Risk Management and Hedging Programs.
Differences between the change in fair value of the GAAP embedded derivatives, as well as associated statutory and tax liabilities, and the value of the related hedging portfolio may occur and can be caused by movements in the level of equity, interest rate and credit markets, market volatility, policyholder behavior and mortality/longevity rates that differ from our assumptions and our inability to purchase hedging instruments at prices consistent with the desired risk and return trade-off. The occurrence of one or more of these events has in the past resulted in, and could in the future result in, an increase in the fair value of liabilities associated with the guaranteed benefits or decline in the value of our hedges, or a decline in the value of our hedges without an offsetting decline in our liabilities, thus reducing our pre-tax net income and shareholders’ equity.
While we believe that our actions have reduced the risks related to guaranteed benefits and guaranteed interest crediting, our risk exposures are not fully, and may not be effectively, hedged.
For additional information on these products see Notes 4 and 13 to the Consolidated Financial Statements, Item 1. Business – Regulation and Part II, Item 7. MD&A – Critical Accounting Estimates – Liabilities for Guaranteed Benefit Features of Variable Annuity, Fixed Annuity and Fixed Index Annuity Products.
AIG | 2021 Form 10-K 39
Our foreign operations expose us to risks that may affect our operations. We provide insurance, reinsurance, investment and other financial products and services to both businesses and individuals in approximately 70 countries and jurisdictions. A substantial portion of our business is conducted outside the United States, and we intend to continue to grow our business in strategic markets. Operations outside the United States have in the past been, and may in the future be, affected by regional economic downturns, changes in foreign currency exchange rates, political events or upheaval, sanctions policies, nationalization and other restrictive government or regulatory actions, which could also affect our other operations.
The degree of regulation and supervision in foreign jurisdictions varies. AIG subsidiaries operating in foreign jurisdictions must satisfy local regulatory requirements and it is possible that local licenses may require AIG Parent to meet certain conditions. Licenses issued by foreign authorities to our subsidiaries are subject to modification and revocation. Consequently, our insurance subsidiaries could be prevented from conducting future business in some of the jurisdictions where they currently operate. Adverse actions from any single country could adversely affect our results of operations, depending on the magnitude of the event and our financial exposure at that time in that country.
In addition, AIG Parent and its subsidiaries are subject to various extraterritorial laws and regulations, including such laws adopted by the United States that affect how we do business around the world. These laws and regulations may conflict and we may incur penalties and/or reputational harm if we fail to adhere to them. For example, increased international data localization and cross-border data transfer regulatory restrictions and anti-sanctions laws may affect how we do business around the world and may cause us to incur penalties and/or suffer reputational harm.
Our restructuring initiatives may not yield our expected reductions in expenses and improvements in operational and organizational efficiency. Outside of our AIG 200 transformational program and announced plan to separate the Life and Retirement business, we continue to undertake certain restructuring initiatives in the ordinary course of business. We may not be able to fully realize the anticipated expense reductions and operational and organizational efficiency improvements because the actual costs to implement these initiatives may exceed our estimates or we may be unable to fully implement and execute these initiatives as planned. Our businesses and results of operations may be negatively impacted if we are unable to realize these anticipated expense reductions and efficiency improvements or if implementing these initiatives harms our relationships with customers or employees or our competitive position. The successful implementation of these initiatives may continue to require us to effect workforce reductions, business rationalizations, systems enhancements, business process outsourcing, business and asset dispositions and acquisitions and other actions, which depend on a number of factors, some of which are beyond our control.
We may experience difficulty in marketing and distributing products through our current and future distribution channels and the use of third parties may result in additional liabilities. Although we distribute our products through a wide variety of distribution channels, we maintain relationships with certain key distributors. Distributors have in the past, and may in the future, elect to renegotiate the terms of existing relationships, limit the products they sell, including the types of products offered by us, or otherwise reduce or terminate their distribution relationships with us, with or without cause. This could be due to various reasons, such as industry consolidation of distributors or other industry changes that increase the competition for access to distributors, developments in laws or regulations that affect our business or industry, including the marketing and sale of our products and services, adverse developments in our business, strategic decisions that impact our business, adverse rating agency actions or concerns about market-related risks. An interruption or reduction in certain key relationships could materially affect our ability to market our products and could have a material adverse effect on our businesses, operating results and financial condition.
Alternatively, renegotiated terms may not be attractive or acceptable to distributors, or we may terminate one or more distribution agreements due to, for example, a loss of confidence in, or a change in control of, one of the third-party distributors. An interruption or reduction in certain key relationships could materially affect our ability to market our products and could materially and adversely affect our business, results of operations, financial condition and liquidity.
In addition, we can, in certain circumstances, be held responsible for the actions of our distributors, including broker-dealers, registered representatives, insurance agents and agencies, marketing organizations, and their respective employees, agents and representatives, in connection with the marketing and sale of our products by such parties and persons in a manner that is deemed not compliant with applicable laws and regulations. This is particularly acute with respect to unaffiliated distributors where we may not be able to directly monitor or control the manner in which our products are sold through third-party firms despite our training and compliance programs. Further, misconduct by employees, agents and representatives of our broker-dealer subsidiaries in the sale of our products could also result in violations of law by us or our subsidiaries, regulatory sanctions and serious reputational or financial harm. The precautions we take to prevent and detect the foregoing activities may not be effective. If our products are distributed to customers for whom they are unsuitable or distributed in a manner deemed inappropriate, we could suffer reputational and/or other financial harm to our business.
For information regarding suitability standards, see Item 1. Business – Regulation – U.S. Regulation.
40 AIG | 2021 Form 10-K
We are exposed to certain risks if we are unable to maintain the availability of our critical technology systems and data and safeguard the confidentiality and integrity of our data, which could compromise our ability to conduct business and adversely affect our consolidated business, results of operations, financial condition and liquidity. We use information technology systems, infrastructure and networks and other operational systems to store, retrieve, evaluate and use customer, employee, and company data and information. Our business is highly dependent on our ability to access these systems and networks to perform necessary business functions. In the event of a natural disaster, a computer virus, unauthorized access, a terrorist attack, cyberattack or other disruption inside or outside the U.S., our systems may be inaccessible to our employees, customers or business partners for an extended period of time, and we may be unable to meet our business obligations for an extended period of time if our data or systems are disabled, manipulated, destroyed or otherwise compromised. Additionally, some of our systems and networks are older, legacy-type systems that are less efficient and require an ongoing commitment of significant resources to maintain or upgrade. Supply chain disruptions or delays could prevent us from maintaining and implementing changes, updates and upgrades to our systems and networks in a timely manner or at all. System and network failures or outages could compromise our ability to perform business functions in a timely manner, which could harm our ability to conduct business, hurt our relationships with our business partners and customers and expose us to legal claims as well as regulatory investigations and sanctions, any of which could have a material adverse effect on our business, results of operations, financial condition and liquidity.
Some of these systems and networks also rely upon third-party systems, which themselves may rely on the systems of other third parties. Problems caused by, or occurring in relation to, our third-party providers and systems, including those resulting from breakdowns or other disruptions in information technology services provided by a third-party provider, failure of a third-party provider to provide current or higher volumes of required services or cyber-attacks and security breaches at a third-party provider may in the future materially and adversely affect our business, results of operations, financial condition and liquidity.
Like other global companies, the systems and networks we maintain and third party systems and networks we use have in the past been, and will likely in the future be, subject to or targets of unauthorized or fraudulent access, including physical or electronic break-ins or unauthorized tampering, as well as attempted cyber and other security threats and other computer-related penetrations such as “denial of service” attacks, phishing, untargeted but sophisticated and automated attacks, and other disruptive software. Also, like other global companies, we have an increasing challenge of attracting and retaining highly qualified security personnel to assist us in combatting these security threats. The frequency and sophistication of such threats continue to increase and often become further heightened in connection with geopolitical tensions.
We continuously monitor and develop our information technology networks and infrastructure in an effort to prevent, detect, address and mitigate the risk of threats to our data, systems and networks, including malware and computer virus attacks, ransomware, unauthorized access, business e-mail compromise, misuse, denial-of-service attacks, system failures and disruptions. There is no assurance that our security measures, including information security policies, administrative, technical and physical controls and other actions designed as preventative, will provide fully effective protection from such events. AIG maintains insurance to cover operational risks, such as cyber risk and technology outages, but this insurance may not cover all costs associated with the consequences of personal, confidential or proprietary information being compromised. In some cases, such compromise may not be immediately detected which may make it difficult to recover critical services, damage assets and compromise the integrity and security of data including our policyholder, employee, agent, and other confidential information processed through our systems and networks. Additionally, since we rely heavily on information technology and systems and on the integrity and timeliness of data to run our businesses and service our customers, any such compromise or security event and may impede or interrupt our business operations and our ability to service our customers, and otherwise may materially and adversely affect our business, results of operations, financial condition and liquidity.
We are continuously evaluating and enhancing systems and processes. These continued enhancements and changes, as well as changes designed to update and enhance our protective measures to address new threats, may increase the risk of a system or process failure or the creation of a gap in the associated security measures. Any such failure or gap could materially and adversely affect our business, results of operations, financial condition and liquidity.
We routinely transmit, receive and store personal, confidential and proprietary information by email and other electronic means. Although we attempt to keep such information confidential and secure, we may be unable to do so in all events, especially with clients, vendors, service providers, counterparties and other third parties who may not have or use appropriate controls to protect personal, confidential or proprietary information. The compromise of personal, confidential or proprietary information could cause a loss of data, give rise to remediation or other expenses, expose us to liability under U.S. and international laws and regulations, and subject us to litigation, investigations, sanctions, and regulatory and law enforcement action, and result in reputational harm and loss of business, which could have a material adverse effect on our business, results of operations, financial condition and liquidity.
AIG | 2021 Form 10-K 41
Furthermore, certain of our businesses are subject to compliance with laws and regulations enacted by U.S. federal and state governments, the European Union or other jurisdictions or enacted by various regulatory organizations or exchanges relating to the privacy and security of the information of clients, employees or others. The variety of applicable privacy and information security laws and regulations exposes us to heightened regulatory scrutiny, requires us to incur significant technical, legal and other expenses in an effort to ensure and maintain compliance and will continue to impact our business in the future by increasing legal, operational and compliance costs. While we have taken steps to comply with privacy and information security laws, we cannot guarantee that our efforts will meet the evolving standards imposed by data protection authorities. If we are found not to be in compliance with these privacy and security laws and regulations, we may be subject to additional potential private consumer, business partner or securities litigation, regulatory inquiries, and governmental investigations and proceedings, and we may incur damage to our reputation. Any such developments may subject us to material fines and other monetary penalties and damages, divert management’s time and attention, and lead to enhanced regulatory oversight, any of which could have a material adverse effect on our business, results of operations, financial condition and liquidity. Additionally, we expect that developments in privacy and cybersecurity worldwide will increase the financial and reputational implications following a significant breach of our or our third-party suppliers’ information technology systems. New and currently unforeseen regulatory issues could also arise from the increased use of emerging technology, data and digital services. If we are found not to be in compliance with these laws and regulations concerning emerging technology, data and digital services, we could be subjected to significant civil and criminal liability and exposed to reputational harm. For additional information on privacy, data protection and cybersecurity regulations. For additional information on data protection and cybersecurity regulations, see Item 1. Business – Regulation – U.S. Regulation – Privacy, Data Protection and Cybersecurity and – International Regulation – Privacy, Data Protection and Cybersecurity, and Part II, Item 7. MD&A – Enterprise Risk Management – Operational Risk Management – Cybersecurity Risk.
We have been required to further rely on our technology systems as a result of the fact that all non-essential staff were transitioned to a remote work environment in response to the COVID-19 pandemic and thus, the risk of a gap in our security measures and the risk of a system or process failure is heightened.
For information regarding the effects of the COVID-19 pandemic on our business, see Market Conditions – “COVID-19 has adversely affected, and is expected to continue to adversely affect, our global business, results of operations, financial condition and liquidity, and its ultimate impact will depend on future developments that are uncertain and cannot be predicted” above.
Third parties we rely upon to provide certain business and administrative services on our behalf may not perform as anticipated, which could have an adverse effect on our business and results of operations. We rely on the use of third-party providers to deliver contracted services in a broad range of areas. For example, we have engaged with Accenture plc for the delivery of services related to the administration or servicing of certain policies and contracts and investment assets, investment accounting, information technology and operational functions, finance and actuarial services, human resources and information technology services related to infrastructure, application development and maintenance. In addition, in connection with its acquisition of an equity stake in SAFG, AIG entered into a long-term asset management relationship with Blackstone, pursuant to which Blackstone is managing an initial $50 billion of Life and Retirement’s existing investment portfolio, with that amount increasing by increments of $8.5 billion per year for the next five years beginning in the fourth quarter of 2022, for an aggregate of $92.5 billion. For information regarding our reliance on Blackstone as a third-party asset manager, see “Our investment portfolio is concentrated in certain segments of the economy, and the performance and value of our investment portfolio are subject to a number of risks and uncertainties, including changes in interest rates and credit spreads. In addition, a significant portion of our investment portfolio is now managed by Blackstone, which makes its performance and value subject to Blackstone’s ability to successfully manage it” above.
Some of these providers are located outside the U.S., which exposes us to business disruptions and political risks inherent when conducting business outside of the U.S. We periodically negotiate provisions and renewals of these relationships, and there can be no assurance that such terms will remain acceptable to us, such third parties or regulators. If such third-party providers experience disruptions, fail to meet applicable licensure requirements, do not perform as anticipated or in compliance with applicable laws and regulations, terminate or fail to renew our relationships, or such third-party providers in turn rely on services from another third-party provider, who experiences such disruptions, licensure failures, nonperformance or noncompliance, termination or non-renewal of its contractual relationships, we may experience operational difficulties, an inability to meet obligations (including, but not limited to, contractual, legal, regulatory or policyholder obligations), a loss of business, increased costs or reputational harm, compromises to our data integrity, or suffer other negative consequences, all of which may have a material adverse effect on our business, consolidated results of operations, liquidity and financial condition. Third parties performing regulated activities on our behalf, such as sales and servicing of insurance products, pose a heightened risk as we may be held accountable for third party conduct that is not in compliance with applicable law.
42 AIG | 2021 Form 10-K
For information regarding cyber risk arising from third-party providers, see Business and Operations – “We are exposed to certain risks if we are unable to maintain the availability of our critical technology systems and data and safeguard the confidentiality and integrity of our data, which could compromise our ability to conduct business and adversely affect our consolidated business, results of operations, financial condition and liquidity” above.
For information regarding increased risks arising from our reliance on third parties as a result of the COVID-19 pandemic, see Market Conditions – “COVID-19 has adversely affected, and is expected to continue to adversely affect, our global business, results of operations, financial condition and liquidity, and its ultimate impact will depend on future developments that are uncertain and cannot be predicted” above.
Business or asset acquisitions and dispositions may expose us to certain risks. The completion of any business or asset acquisition or disposition is subject to certain risks, including those relating to the receipt of required regulatory approvals, the terms and conditions of regulatory approvals including any financial accommodations required by regulators, our ability to satisfy such terms, conditions and accommodations, the occurrence of any event, change or other circumstances that could give rise to the termination of a transaction and the risk that parties may not be willing or able to satisfy the conditions to a transaction. As a result, there can be no assurance that any business or asset acquisition or disposition will be completed as contemplated, or at all, or regarding the expected timing of the completion of the acquisition or disposition. For example, on October 26, 2020, AIG announced its intention to separate its Life and Retirement business from AIG. While we currently believe that, following the sale of a 9.9 percent equity stake in SAFG to Blackstone, an initial public offering is the next step in the separation of the Life and Retirement business from AIG, no assurance can be given regarding the form that future separation transactions may take or the specific terms or timing thereof, or that a separation will in fact occur. In addition, any separation transaction will be subject to the satisfaction of various conditions and approvals, including approval by the AIG Board of Directors, receipt of insurance and other required regulatory approvals, and satisfaction of any applicable requirements of the SEC. There can be no guarantee that we will receive the required approvals or that closing conditions will be satisfied in order to consummate the separation of the Life and Retirement business and for any other disposition.
Once we complete acquisitions or dispositions, there can be no assurance that we will realize the anticipated economic, strategic or other benefits of any transaction. For example, the integration of businesses we acquire may not be as successful as we anticipate or there may be undisclosed risks present in such businesses. Acquisitions involve a number of risks, including operational, strategic, financial, accounting, legal, compliance and tax risks. Difficulties integrating an acquired business may result in the acquired business performing differently than we expected (including through the loss of customers) or in our failure to realize anticipated expense-related efficiencies. Our existing businesses could also be negatively impacted by acquisitions. Risks resulting from future acquisitions may have a material adverse effect on our results of operations and financial condition. In connection with a business or asset disposition, we may also hold a concentrated position in securities of the acquirer as part of the consideration, which subjects us to risks related to the price of equity securities and our ability to monetize such securities. In addition, with respect to certain dispositions, we are subject to regulatory and other restrictions on our use of proceeds. We have also provided and may provide financial guarantees and indemnities in connection with the businesses we have sold or may sell, as described in greater detail in Note 15 to the Consolidated Financial Statements. While we do not currently believe that claims under these indemnities will be material, it is possible that significant indemnity claims could be made against us. If such a claim or claims were successful, it could have a material adverse effect on our results of operations, cash flows and liquidity.
For additional information regarding the risks associated with AIG’s separation of its Life and Retirement business, see Business and Operations – “No assurances can be given that the separation of our Life and Retirement business will occur or as to the specific terms or timing thereof. In addition, the separation could cause the emergence or exacerbate the effects of other risks to which AIG is exposed” above.
For additional information on these financial guarantees and indemnities, see Note 15 to the Consolidated Financial Statements.
Significant legal or regulatory proceedings may adversely affect our business, results of operations or financial condition. In the normal course of business, we face significant risk from regulatory and governmental investigations and civil actions, litigation and other forms of dispute resolution in various domestic and foreign jurisdictions. In our insurance and reinsurance operations, we frequently engage in litigation and arbitration concerning the scope of coverage under insurance and reinsurance contracts, and face litigation and arbitration in which our subsidiaries defend or indemnify their insureds under insurance and reinsurance contracts. Additionally, from time to time, various regulatory and governmental agencies review the transactions and practices of AIG and our subsidiaries in connection with industry-wide and other inquiries into, among other matters, the business practices of current and former operating insurance subsidiaries. Such investigations, inquiries or examinations have and could develop into administrative, civil or criminal proceedings or enforcement actions, in which remedies could include fines, penalties, restitution or alterations in our business practices, and could result in additional expenses, limitations on certain business activities and reputational damage.
AIG | 2021 Form 10-K 43
AIG, our subsidiaries and their respective officers and directors are also subject to, or may become subject to, a variety of additional types of legal disputes brought by holders of AIG securities, customers, employees and others, alleging, among other things, breach of contractual or fiduciary duties, bad faith, indemnification and violations of federal and state statutes and regulations. Certain of these matters may also involve potentially significant risk of loss due to the possibility of significant jury awards and settlements, punitive damages or other penalties. Many of these matters are also highly complex and seek recovery on behalf of a class or similarly large number of plaintiffs. It is therefore inherently difficult to predict the size or scope of potential future losses arising from them, and developments in these matters could have a material adverse effect on our consolidated financial condition or consolidated results of operations.
For information regarding certain legal proceedings, including certain tax controversies, see Notes 15 and 21 to the Consolidated Financial Statements.
For information regarding potential litigation exposure as a result of the COVID-19 pandemic, see Market Conditions – “COVID-19 has adversely affected, and is expected to continue to adversely affect, our global business, results of operations, financial condition and liquidity, and its ultimate impact will depend on future developments that are uncertain and cannot be predicted” above.
Increasing scrutiny and evolving expectations from investors, customers, regulators and other stakeholders regarding environmental, social and governance matters may adversely affect our reputation or otherwise adversely impact our business and results of operations. There is increasing scrutiny and evolving expectations from investors, customers, regulators and other stakeholders on ESG practices and disclosures, including those related to environmental stewardship, climate change, diversity, equity and inclusion, racial justice and workplace conduct. Regulators have imposed and likely will continue to impose ESG-related rules and guidance, which may conflict with one another and impose additional costs on us or expose us to new or additional risks. Moreover, certain organizations that provide information to investors have developed ratings for evaluating companies on their approach to different ESG matters, and unfavorable ratings of our company or our industries may lead to negative investor sentiment and the diversion of investment to other companies or industries. In 2021, we published our first ESG report detailing the Company’s ESG assessments and priorities and made a commitment to reduce our operational carbon emissions to net zero by 2050. If we are unable to meet these targets, standards, or expectations, whether established by us or third parties, it could result in adverse publicity, reputational harm, or loss of customer and/or investor confidence, which could adversely affect our business and results of operations.
For information on the effects of climate change on our business, see Reserves and Exposures – “Climate change may adversely affect our business and financial condition” above.
Our risk management policies and procedures may prove to be ineffective and leave us exposed to unidentified or unanticipated risk, which could adversely affect our businesses, results of operations, financial condition and liquidity. We have developed and continue to enhance enterprise-wide risk management policies and procedures to identify, monitor and mitigate risk and loss to which we are exposed, which include hedging programs designed to manage market risk and reinsurance to manage geographic accumulations. There are, however, inherent limitations to risk management strategies because there may exist, or develop in the future, risks that we have not sufficiently or accurately anticipated or identified. For example, our hedging programs utilize various derivative instruments, including but not limited to equity options, futures contracts, interest rate swaps and swaptions, as well as other hedging instruments, which may not effectively or completely reduce our risk; and assumptions underlying models used to measure accumulations and support reinsurance purchases may prove inaccurate and could leave us exposed to larger than expected catastrophe losses in a given year. In addition, our current business continuity and disaster recovery plans may not be sufficient to reduce the impact of pandemics and other natural or man-made catastrophic events that are beyond our anticipated thresholds or impact tolerances.
If our risk management policies and procedures are ineffective, we may suffer unexpected losses and could be materially adversely affected. As our businesses change and the markets in which we operate evolve and new risks emerge, including for example risks related to climate change or meeting stakeholder expectations relating to environmental, social or governance issues, our risk management framework may not evolve at the same pace as those changes. As a result, there is a risk that new products or new business strategies may present risks that are not appropriately identified, monitored or managed. The effectiveness of our risk management strategies may be limited, resulting in losses, because of market stress, unanticipated financial market movements or unanticipated claims experience from adverse mortality, morbidity or policyholder behavior. In addition, there can be no assurance that we can effectively review and monitor all risks or that all of our employees will understand and follow (or comply with) our risk management policies and procedures.
44 AIG | 2021 Form 10-K
We may not be able to protect our intellectual property and may be subject to infringement claims. We rely on a combination of contractual rights and copyright, trademark, patent and trade secret laws to establish and protect our intellectual property. Effective intellectual property rights protection may be unavailable, limited, or subject to change in some countries where we do or plan to do business. Although we use a broad range of measures to protect our intellectual property rights, third parties may infringe or misappropriate our intellectual property. We have, and may in the future, litigate to enforce and protect our intellectual property and to determine its scope, validity or enforceability, which could divert significant resources and may not prove successful. Litigation to enforce our intellectual property rights may not be successful and cost a significant amount of money. The loss of intellectual property protection or the inability to secure or enforce the protection of our intellectual property assets could harm our reputation and have a material adverse effect on our business and our ability to compete. Third parties may have, or may eventually be issued, patents or other protections that could be infringed by our products, methods, processes or services or could limit our ability to offer certain product features. Consequently, we also may be subject to costly litigation in the event that another party alleges our operations or activities infringe upon their intellectual property rights, including patent rights, or violate license usage rights. Any such intellectual property claims and any resulting litigation could result in significant expense and liability for damages, and in some circumstances we could be enjoined from providing certain products or services to our customers, or utilizing and benefiting from certain patent, copyrights, trademarks, trade secrets or licenses, or alternatively could be required to enter into costly licensing arrangements with third parties, all of which could have a material adverse effect on our business, consolidated results of operations and financial condition.
REGULATION
Our businesses are heavily regulated and changes in laws and regulations may affect our operations, increase our insurance subsidiary capital requirements or reduce our profitability. Our operations generally, and our insurance and reinsurance subsidiaries in particular, are subject to extensive and potentially conflicting laws and regulations in the jurisdictions in which we operate. Our business and financial condition are also subject to supervision and regulation by authorities in the various jurisdictions in which we do business. Federal, state and foreign regulators also periodically review and investigate our insurance and reinsurance businesses, including AIG-specific and industry-wide practices. The primary purpose of insurance regulation is the protection of our insurance and reinsurance contract holders. The extent of regulation on our insurance and reinsurance business varies across the jurisdictions where we operate, but generally is governed by laws that delegate regulatory, supervisory and administrative authority to insurance departments and similar regulatory agencies. The laws and regulations that apply to our business and operations generally grant regulatory agencies and/or self-regulatory organizations broad rulemaking and enforcement powers, including the power to regulate the issuance, sale and distribution of our products, the manner in which we underwrite our policies, the delivery of our services, the nature or extent of disclosures that we give our customers, the compensation of our distribution partners, the manner in which we handle claims on our policies and the administration of our policies and contracts, as well as the power to limit or restrict our business for failure to comply with applicable laws and regulations. Our Life and Retirement companies and their distributors are also subject to laws and regulations governing the standard of care applicable to sales of our products, the provision of advice to our customers and the manner in which certain conflicts of interest arising from or related to such sales or giving of advice are to be addressed. In addition, federal and state securities laws and regulations apply to certain of our insurance products that are considered ‘securities’ under such laws, including our variable annuity contracts, variable life insurance policies and the separate accounts that issue them, as well as our broker-dealer, investment advisor and mutual fund operations.
For additional information on the regulatory regimes we are subject to, including the Dodd-Frank Wall Street Reform and Consumer Protection Act and the standard of care-related regulations administered by the DOL, see Item 1. Business – Regulation – U.S. Regulation.
Significant legislative and regulatory activity has occurred at both the U.S. federal and state levels, as well as globally, in response to the COVID-19 pandemic and its impact on insurance consumers. While some of these legislative and regulatory initiatives have expired, any resurgence of the COVID-19 virus may lead to a renewal of those initiatives. We cannot predict what form future legal and regulatory responses to concerns about COVID-19 and related public health issues will take, or how such responses will impact our business.
We strive to comply with laws and regulations applicable to our businesses, operations and legal entities, including maintenance of all required licenses and approvals. The application of and compliance with such laws and regulations may be subject to interpretation, evolving industry practices and regulatory expectations that could result in increased compliance costs. The relevant authorities may not agree with our interpretation of these laws and regulations, including, for example, our implementation of new or revised requirements related to capital, accounting treatment or reserving such as those governing PBR, or with our policies and procedures adopted to address evolving industry practices or meet regulatory expectations. Such authorities’ interpretations and views may also change from time to time. It is also possible that the laws, regulations and interpretations across various jurisdictions in which we do business may conflict with one another and affect how we do business in the United States and globally. If we are found not to have complied with applicable legal or regulatory requirements, these authorities could preclude or temporarily suspend us from carrying on
AIG | 2021 Form 10-K 45
some or all of our activities, impose substantial administrative penalties such as fines or require corrective actions, which individually or in the aggregate could interrupt our operations and materially and adversely affect our reputation, business, results of operations and financial condition. Additionally, when such authorities’ interpretation of new or revised requirements related to capital, accounting treatment and/or valuation manual or reserving (such as PBR) materially differs from ours, we have incurred or may incur higher operating costs, or sales of products subject to such requirements or treatment may be affected.
In the United States, the RBC formula is designed to measure the adequacy of an insurer’s statutory surplus in relation to the risks inherent in its business. Regulators in other jurisdictions in which we do business have adopted capital and liquidity standards applicable to insurers and reinsurers operating in their jurisdiction. Failure to comply with such RBC capital, liquidity and similar requirements, or as otherwise may be agreed by us or one of our insurance company subsidiaries with an insurance regulator, would generally permit the insurance regulator to take certain regulatory actions that could materially impact the affected company’s operations. Those actions range from requiring an insurer to submit a plan describing how it would regain a specified RBC ratio to a mandatory regulatory takeover of the company. The NAIC and the IAIS are also developing and testing methodologies for assessing group-wide regulatory capital, which might evolve into more formal group-wide capital requirements on certain insurance companies and/or their holding companies that may augment state-law RBC standards, and similar international standards, that apply at the legal entity level, and such capital calculations may be made, in whole or in part, on bases other than the statutory statements of our insurance and reinsurance subsidiaries. We cannot predict the effect these initiatives may have on our business, results of operations, liquidity and financial condition.
We also cannot predict the impact that laws and regulations adopted in foreign jurisdictions may have on the financial markets generally or our businesses, results of operations or cash flows. It is possible such laws and regulations, our satisfaction of the IAIG criteria and certain standard-setting initiatives by the FSB and the IAIS, including, but not limited to, the IAIS’ Common Framework for the Supervision of IAIGs, a holistic framework for the assessment and mitigation of systemic risk and the development and refinement of a risk-based global ICS, Solvency II and European Data Protection Board Cross Border Data Transfer in the European Union, may significantly alter our business practices. For example, regulators have imposed and may continue to impose new requirements or issue new guidance aimed at addressing or mitigating climate change-related risks. They may also limit our ability to engage in capital or liability management, require us to raise additional capital, and impose burdensome requirements and additional costs. It is also possible that the laws and regulations adopted in foreign jurisdictions will differ from one another, and that they could be inconsistent with the laws and regulations of other jurisdictions in which we operate, including the United States.
For additional information on our regulatory environment, see Item 1. Business – Regulation.
For information regarding the effects of regulations related to climate change on our business, see Reserves and Exposures – “Climate change may adversely affect our business and financial condition” above.
For information regarding the regulatory response to the COVID-19 pandemic, see Market Conditions – “COVID-19 has adversely affected, and is expected to continue to adversely affect, our global business, results of operations, financial condition and liquidity, and its ultimate impact will depend on future developments that are uncertain and cannot be predicted” above.
New laws and regulations or new interpretations of current laws and regulations, both domestically and internationally, may affect our businesses, results of operations, financial condition and ability to compete effectively. Legislators, regulators and self-regulatory organizations have in the past, and may in the future, periodically consider various proposals that may affect or restrict, among other things, our business practices, product designs and distribution relationships, how we market, sell or service certain products we offer, our capital, reserving and accounting requirements, or the profitability of certain of our businesses. For example, our life insurance and annuity products provide the customer with certain federal income tax advantages. A tax law change that eliminates all or a portion of these advantages may reduce the demand from consumers for our products and change the likelihood of customers surrendering or rolling over existing contracts.
Further, new laws and regulations may affect or significantly limit our ability to conduct certain businesses at all, including proposals relating to restrictions on the type of activities in which financial institutions are permitted to engage. These proposals or changes in legislation or regulation could also impose additional taxes on a limited subset of financial institutions and insurance companies (either based on size, activities, geography or other criteria), limit our ability to engage in capital or liability management, require us to raise additional capital, and impose burdensome requirements and additional costs. It is uncertain whether and how these and other such proposals or changes in legislation or regulation would apply to us, those who sell or service our products, or our competitors or how they could impact our ability to compete effectively, as well as our business, consolidated results of operations, liquidity and financial condition.
For information regarding the regulatory response to the COVID-19 pandemic, see Market Conditions – “COVID-19 has adversely affected, and is expected to continue to adversely affect, our global business, results of operations, financial condition and liquidity, and its ultimate impact will depend on future developments that are uncertain and cannot be predicted” above.
46 AIG | 2021 Form 10-K
For information regarding climate change on our business, see Reserves and Exposures – “Climate change may adversely affect our business and financial condition” above.
Certain provisions of Dodd-Frank remain relevant to insurance groups generally, including AIG. The Financial Stability Oversight Council (Council) rescinded our designation as a nonbank SIFI on September 29, 2017, but the Council remains authorized under Dodd-Frank to determine, subject to certain statutory and regulatory standards and to the Council’s guidance, which was recently changed to favor an activities-based approach to systemic risk identification and mitigation, that certain nonbank financial companies be designated as nonbank SIFIs subject to supervision by the Board of Governors of the Federal Reserve System and enhanced prudential standards. The Council may also recommend that state insurance regulators or other regulators apply new or heightened standards and safeguards for activities or practices that we and other insurers or other nonbank financial services companies, including insurers, engage in. Additionally, Dodd-Frank directs existing and newly created government agencies and bodies to promulgate regulations implementing the law, which is an ongoing process. There remains considerable uncertainty as to the potential adoption and timing of additional regulatory changes related to Dodd-Frank. We cannot predict the requirements of any additional regulations that may be ultimately adopted or the impact they may have on our businesses, consolidated results of operations, liquidity and financial condition.
For additional information on provisions of Dodd-Frank that remain relevant to insurance groups generally, see Item 1. Business – Regulation – U.S. Regulation – Dodd-Frank.
An “ownership change” could limit our ability to utilize tax loss and credit carryforwards to offset future taxable income. As of December 31, 2021, on a U.S. GAAP basis, we had U.S. federal net operating loss carryforwards of approximately $27.6 billion and $0.3 billion in foreign tax credits. Our ability to use these tax attributes to offset future taxable income may be significantly limited if we experience an “ownership change” as defined in Section 382 of the Internal Revenue Code. In general, an ownership change will occur when the percentage of AIG Parent's ownership (measured by value) by one or more “5-percent shareholders” (as defined in the Internal Revenue Code) has increased by more than 50 percentage points over the lowest percentage owned by such shareholders at any time during the prior three years (calculated on a rolling basis). An entity that experiences an ownership change generally will be subject to an annual limitation on its utilization of pre-ownership change tax loss and credit carryforwards equal to the equity value of the corporation immediately before the ownership change, multiplied by the long-term, tax-exempt rate posted monthly by the IRS (AFR) (subject to certain adjustments). The annual limitation would be increased each year to the extent that there is an unused limitation in a prior year. The limitation on our ability to utilize tax loss and credit carryforwards arising from an ownership change under Section 382 of the Internal Revenue Code would be dependent on the value of our equity and the AFR at the time of any ownership change. If we were to experience an “ownership change”, it is possible that a significant portion of our tax loss and credit carryforwards could expire before we would be able to use them to offset future taxable income.
Our shareholders have adopted a protective amendment to our Amended and Restated Certificate of Incorporation (Protective Amendment), which is designed to prevent certain transfers of AIG Common Stock that could result in an “ownership change”. Further, we have a Tax Asset Protection Plan (the Plan) in place, which is designed to reduce the likelihood of an “ownership change” by (i) discouraging any person or group from becoming a 4.99 percent shareholder and (ii) discouraging any existing 4.99 percent shareholder from acquiring additional shares of AIG Common Stock. The Protective Amendment generally restricts any transfer of AIG Common Stock that would (i) increase the ownership by any person to 4.99 percent or more of AIG Common Stock then outstanding or (ii) increase the percentage of AIG Common Stock owned by a Five Percent Stockholder (as defined in the Plan). Despite the intentions of the Plan and the Protective Amendment to deter and prevent an “ownership change”, such an event may still occur. In addition, the Plan and the Protective Amendment may make it more difficult and more expensive to acquire us, and may discourage open market purchases of AIG Common Stock or a non-negotiated tender or exchange offer for AIG Common Stock. Accordingly, the Plan and the Protective Amendment may limit a shareholder’s ability to realize a premium over the market price of AIG Common Stock in connection with any stock transaction. The Plan is currently set to expire on December 11, 2022, but our Board of Directors may, consistent with past practice, adopt an amendment to extend the Plan beyond this expiration date. The Protective Amendment will expire on May 13, 2023 but may be extended by our shareholders in similar fashion.
Changes to tax laws could increase our corporate taxes or make some of our products less attractive to consumers. The current United States administration and Congressional leadership have proposed changes to the U.S. corporate and international tax systems, as well as increasing the taxation of U.S. individuals, including capital gains taxation.
An increase in the statutory U.S. federal corporate income tax rate will negatively impact AIG’s future after-tax earnings. Other changes, such as a proposed minimum tax on book income could impact AIG’s after-tax earnings or cash flow.
The administration and Congressional leadership have also proposed changes to complex provisions in the U.S. international tax system, including the base erosion and anti-abuse tax (BEAT) and global intangible low-taxed income (GILTI). These changes could impact AIG’s after-tax earnings or cash flow. Furthermore, there is the possibility of further regulatory guidance on certain aspects of the BEAT and GILTI, which could impact the amounts recorded with respect to these international provisions, possibly materially.
AIG | 2021 Form 10-K 47
In addition to changing the taxation of corporations in general, there are proposals for increases in tax rates for individuals, capital gains, and changes to the estate tax. These changes could impact demand in the U.S. for life insurance and annuity contracts.
New tax laws outside the U.S. similar to BEAT or enacted in response to proposals by the Organisation for Economic Co-operation and Development in the European Union could make substantive changes to the global international tax regime. Such changes could impact cross border reinsurance transactions, which could increase our tax costs globally.
Finally, it is possible that tax laws will be further changed either in a technical corrections bill or entirely new legislation. It remains difficult to predict whether or when there will be any tax law changes or further guidance by the authorities in the U.S. or elsewhere in the world having a material adverse effect on our business, consolidated results of operations, liquidity and financial condition, as the impact of proposals on our business can vary substantially depending upon the specific changes or further guidance made and how the changes or guidance are implemented by the authorities.
For additional information, see Part II, Item 7. MD&A – Consolidated Results of Operations – U.S. Tax Law Changes.
The USA PATRIOT Act, the Foreign Corrupt Practices Act, the regulations administered by the U.S. Department of the Treasury, Office of Foreign Assets Control and similar laws and regulations that apply to us may expose us to significant penalties. As a company that operates in approximately 70 countries and jurisdictions, AIG is subject to myriad regulations which govern items such as sanctions, bribery and anti-money laundering, for which failure to comply exposes us to significant penalties. The USA PATRIOT Act of 2001 requires companies to know certain information about their clients and to monitor their transactions for suspicious activities. The Foreign Corrupt Practices Act makes it unlawful for certain classes of persons and entities to make payments to foreign government officials to assist in obtaining or retaining business. Also, the Department of the Treasury’s Office of Foreign Assets Control administers regulations that restrict or prohibit dealings within U.S. jurisdictions involving certain organizations, individuals, countries, and financial products. The UK, the EU and other jurisdictions maintain similar laws and regulations. The laws and regulations of other jurisdictions may sometimes conflict with those of the U.S. Despite meaningful measures to ensure lawful conduct, which include training, audits and internal control policies and procedures, we may not always be able to prevent our employees or third parties acting on our behalf from violating these laws. As a result, we could be subject to criminal and civil penalties as well as disgorgement. We could be required to make changes or enhancements to our compliance measures that could increase our costs, and we could be subject to other remedial actions. Violations of these laws or allegations of such violations could disrupt our operations, cause reputational harm, cause management distraction and result in a material adverse effect on our competitive position, results of operations, financial condition or liquidity.
ESTIMATES AND ASSUMPTIONS
Estimates or assumptions used in the preparation of financial statements and modeled results used in various areas of our business may differ materially from actual experience. Our financial statements are prepared in conformity with U.S. Generally Accepted Accounting Principles (U.S. GAAP), which requires the application of accounting policies that often involve a significant degree of judgment. The accounting policies that we consider most dependent on the application of estimates and assumptions, and therefore may be viewed as critical accounting estimates, are described in Item 7. MD&A – Critical Accounting Estimates. These accounting estimates require the use of assumptions, some of which are highly uncertain at the time of estimation. These estimates are based on judgment, current facts and circumstances, and, when applicable, internally developed models. Therefore, actual results could differ from these estimates, possibly in the near term, and could have a material effect on our consolidated financial statements.
In addition, we employ models to price products, calculate reserves and value assets and execute hedging strategies, as well as to assess risk and determine capital requirements, among other uses. These models are complex and rely on estimates and projections that are inherently uncertain, may use incomplete, outdated or incorrect data or assumptions and may not operate as intended. To the extent that any of our operating practices and procedures do not accurately produce, or reproduce, data that we use to conduct any or all aspects of our business, such differences may negatively impact our business, reputation, results of operations, and financial condition. For example, modeling for man-made catastrophes, such as terrorism and cyber events is especially difficult and less reliable given such models are in the early stages of development and therefore, not widely adopted or available. In addition, actions taken by governments and monetary authorities in response to the COVID-19 pandemic have affected and may affect the models we use to estimate volatility, among other items, which could adversely affect our business. For our Life and Retirement companies, examples of factors that could negatively impact our assumptions and estimates include significant changes in policyholder behavior assumptions such as lapses, surrenders and withdrawal rates as well as the amount of withdrawals, fund performance, equity market returns and volatility and interest rate levels. As our businesses continue to expand and evolve, the number and complexity of models we employ has grown, increasing our inherent exposure to error in the design, implementation or use of models, including the associated input data, controls and assumptions, and the controls we have in place to mitigate their risk may not be effective in all cases.
48 AIG | 2021 Form 10-K
Changes in accounting principles and financial reporting requirements will impact our consolidated results of operations and financial condition. Our financial statements are prepared in accordance with U.S. GAAP, which are periodically revised. Accordingly, from time to time, we are required to adopt new or revised accounting standards issued by recognized authoritative bodies, including the Financial Accounting Standards Board (FASB).
The FASB has revised the accounting standards for certain long-duration insurance contracts. The FASB issued Accounting Standards Update No. 2018-12 – Targeted Improvements to the Accounting for Long-Duration Contracts, which has an effective date of January 1, 2023 and will significantly change the accounting measurements and disclosures for long-duration insurance contracts, which primarily relates to our life and annuity products as well as certain accident and health products, among others. The implementation of these changes has imposed and will continue to impose special demands on us in the areas of governance, employee training, internal controls and disclosure and affect how we manage our business, all of which will impact our consolidated results of operations, liquidity and financial condition. In addition, implementation of the changes could impact our products, in-force management and asset liability management strategies and have other implications on operations and technology.
The adoption of this newly issued standard will, and other future accounting standards may impact our reported consolidated results of operations, liquidity and reported financial condition and may cause investors to perceive greater volatility in our financial results, negatively impacting our level of investor interest and investment.
For information regarding the impact of accounting pronouncements that have been issued but are not yet required to be implemented, see Note 2 to the Consolidated Financial Statements.
If our businesses do not perform well and/or their estimated fair values decline, we may be required to recognize an impairment of our goodwill or establish an additional valuation allowance against the deferred income tax assets, which could have a material adverse effect on our results of operations and financial condition. Goodwill represents the excess of the amounts we paid to acquire subsidiaries and other businesses over the fair value of their net assets at the date of acquisition. We test goodwill at least annually for impairment and conduct interim qualitative assessments on a periodic basis. Impairment testing is performed based upon estimates of the fair value of the “reporting unit” to which the goodwill relates. In 2021, for substantially all of the reporting units we elected to bypass the qualitative assessment of whether goodwill impairment may exist and, therefore, performed quantitative assessments that supported a conclusion that the fair value of all of the reporting units tested exceeded their book value. The fair value of the reporting unit is impacted by the performance of the business and could be adversely impacted if new business, customer retention, profitability or other drivers of performance differ from expectations, or upon the occurrence of certain events, including a significant and adverse change in regulations, legal factors, accounting standards or business climate, or an adverse action or assessment by a regulator. Our goodwill balance was $4.1 billion at December 31, 2021. If it is determined that goodwill has been impaired, we must write down goodwill by the amount of the impairment, with a corresponding charge to net income (loss). These write-downs could have a material adverse effect on our consolidated results of operations, liquidity and financial condition. For additional information on goodwill impairment, see Part II, Item 7. MD&A – Critical Accounting Estimates – Goodwill Impairment and Note 11 to the Consolidated Financial Statements.
Deferred income tax represents the tax effect of the differences between the book and tax basis of assets and liabilities. Deferred tax assets are assessed periodically by management to determine if they are realizable. As of December 31, 2021, we had net deferred tax assets, after valuation allowance, of $11.5 billion, related to federal, foreign, and state and local jurisdictions. The performance of the business, the geographic and legal entity source of our income, tax planning strategies, and the ability to generate future taxable income from a variety of sources and planning strategies including capital gains, is factored into management’s determination. If, based on available evidence, it is more likely than not that the deferred tax asset will not be realized, then a valuation allowance must be established with a corresponding charge to net income, which such action we have taken from time to time. Such charges could have a material adverse effect on our consolidated results of operations, liquidity and financial condition. For additional information on deferred tax assets, see Part II, Item 7. MD&A – Critical Accounting Estimates – Income Taxes and Note 21 to the Consolidated Financial Statements.
AIG | 2021 Form 10-K 49
COMPETITION and employees
We face intense competition in each of our business lines, and technological changes may present new and intensified challenges to our businesses. Our businesses operate in highly competitive environments, both domestically and overseas. Our principal competitors are other large multinational insurance organizations, as well as banks, investment banks and other nonbank financial institutions. The financial services industry, including the insurance industry, is highly competitive. Within the U.S., our General Insurance companies compete with other stock companies, specialty insurance organizations, mutual insurance companies and other underwriting organizations. Our Life and Retirement companies compete in the U.S. with life and retirement insurance companies and other participants in related financial services fields. Overseas, our subsidiaries compete for business with global insurance groups, local companies and the foreign insurance operations of large U.S. insurers.
General Insurance companies and Life and Retirement companies compete through a combination of risk acceptance criteria, product pricing, and terms and conditions. Reductions of our credit ratings or IFS ratings or negative publicity may make it more difficult to compete to retain existing customers and to maintain our historical levels of business with existing customers, counterparties and distribution relationships. A decline in our position as to any one or more of these factors could adversely affect our profitability.
Technological advancements and innovation in the insurance industry, including those related to evolving customer preferences, the digitization of insurance products and services, acceleration of automated underwriting, and electronic processes present competitive risks. Technological advancements and innovation are occurring in distribution, underwriting, recordkeeping, advisory, claims and operations at a rapid pace, and that pace may increase, particularly as companies increasingly use data analytics and technology as part of their business strategy. Additional costs may also be incurred in order to implement changes to automate procedures critical to our distribution channels in order to increase flexibility of access to our services and products. While we seek opportunities to leverage technological advancements and innovation for our customers’ benefit, our business and results of operations could be materially and adversely affected if external technological advancements or innovation, or the regulation of technological advancements or innovation, limit our ability to retain existing business, write new business at adequate rates or on appropriate terms, render our insurance products less suitable or impact our ability to adapt or deploy current products as quickly and effectively as our competitors.
Competition for employees in our industry is intense, and managing key employee succession is critical to our success. We may not be able to attract and retain the key employees and highly skilled people we need to support our business. Our success depends, in large part, on our ability to attract and retain key people, which may be difficult due to the intense competition in our industry for key employees with demonstrated ability. Recruiting and retention of talent has become especially challenging in the current employment market, fueled in part by changes due to the COVID-19 pandemic. In addition, we may experience higher than expected employee turnover and difficulty attracting new employees as a result of uncertainty from strategic actions and organizational and operational changes, including as a result of the planned separation of the Life and Retirement business from AIG. Losing any of our key people, including key sales or business personnel, could also have a material adverse effect on our operations given their skills, knowledge of our business, years of industry experience and the potential difficulty of promptly finding qualified replacement employees. Additionally, we may face increased costs if, as a result of the competitive market and recent inflationary pressures, we must offer and pay a greater level of remuneration to attract or replace certain critical employees or hire contractors to fill highly skilled roles while vacant. Our business, consolidated results of operations, financial condition and liquidity could be materially adversely affected if we are unsuccessful in attracting and retaining key employees.
In addition, we would be adversely affected if we fail to adequately plan for the succession of our senior management and other key employees. While we have succession plans and long-term compensation plans designed to retain our employees, our succession plans may not operate effectively and our compensation plans cannot guarantee that the services of these employees will continue to be available to us.
Employee error and misconduct may be difficult to detect and prevent and may result in significant losses. There have been a number of cases involving fraud or other misconduct by employees in the financial services industry in recent years and we are also exposed to the risk that employee misconduct could occur. Our human resources and compliance departments work collaboratively to monitor for fraud and conduct extensive training for employees. However, employee misconduct may still occur. Instances of fraud, illegal acts, errors, failure to document transactions properly or to obtain proper internal authorization, misuse of customer or proprietary information, or failure to comply with regulatory requirements or our internal policies may result in losses and/or reputational damage.
50 AIG | 2021 Form 10-K
ITEM 1B | Unresolved Staff Comments
There are no unresolved written comments that were received from the SEC staff 180 days or more before the end of our fiscal year relating to periodic or current reports under the Exchange Act.
ITEM 2 | Properties
We lease our corporate headquarters located at 1271 Avenue of the Americas, New York, New York. We operate from approximately 140 offices in the United States and approximately 260 offices in approximately 50 foreign countries. We own 13 office buildings in the United States.
Our General Insurance companies own offices in 11 foreign countries including Bermuda, Ecuador, Japan, Mexico, the UK and Venezuela. The remainder of the office space we use is leased. We believe that our leases and properties are sufficient for our current purposes.
LOCATIONS OF CERTAIN ASSETS
As of December 31, 2021, approximately 8 percent of our consolidated assets were located outside the U.S. and Canada, including $2.2 billion of cash and securities on deposit with regulatory authorities in those locations.
For additional information on geographic locations see Note 3 to the Consolidated Financial Statements.
For information regarding total carrying values of cash and securities deposited by our insurance subsidiaries under requirements of regulatory authorities see Note 5 to the Consolidated Financial Statements.
Operations outside the U.S. and Canada and assets held abroad may be adversely affected by political developments in foreign countries, including tax changes, nationalization and changes in regulatory policy, as well as by consequence of hostilities and unrest. The risks of such occurrences and their overall effect upon us vary from country to country and cannot be predicted. If expropriation or nationalization does occur, our policy is to take all appropriate measures to seek recovery of any affected assets. Certain of the countries in which our business is conducted have currency restrictions that generally cause a delay in a company’s ability to repatriate assets and profits.
For additional information see Item 1A. Risk Factors – Business and Operations and – Regulation.
ITEM 3 | Legal Proceedings
For a discussion of legal proceedings see Note 15 to the Consolidated Financial Statements, which is incorporated herein by reference.
ITEM 4 | Mine Safety Disclosures
Not applicable.
AIG | 2021 Form 10-K 51
ITEM 5 | Market for Registrant’s Common Equity, Related Stockholder Matters and Issuer Purchases of Equity Securities
Part II
ITEM 5 | Market for Registrant’s Common Equity, Related Stockholder Matters and Issuer Purchases of Equity Securities
AIG’s common stock, par value $2.50 per share (AIG Common Stock), is listed on the New York Stock Exchange (NYSE: AIG).There were approximately 20,386 stockholders of record of AIG Common Stock as of February 8, 2022.
Equity Compensation Plans
Our table of equity compensation plans will be included in the definitive proxy statement for AIG’s 2022 Annual Meeting of Shareholders. The definitive proxy statement will be filed with the SEC no later than 120 days after the end of AIG’s fiscal year pursuant to Regulation 14A.
Purchases of Equity Securities
The following table provides information about purchases made by or on behalf of AIG or any “affiliated purchaser” (as defined in Rule 10b-18(a)(3) under the Securities Exchange Act of 1934 (the Exchange Act)) of AIG Common Stock during the three months ended December 31, 2021:
| Total Number |
| Average | Total Number of Shares | Approximate Dollar Value of Shares |
| ||
| of Shares |
| Price Paid | Purchased as Part of Publicly | that May Yet Be Purchased Under the |
| ||
Period | Repurchased |
| per Share | Announced Plans or Programs | Plans or Programs (in millions) |
| ||
October 1 – 31 | 5,345,684 | $ | 57.77 | 5,345,684 |
| $ | 4,627 |
|
November 1 – 30 | 5,281,916 |
| 58.47 | 5,281,916 |
|
| 4,318 |
|
December 1 – 31 | 6,801,563 |
| 55.10 | 6,801,563 |
|
| 3,943 |
|
Total | 17,429,163 | $ | 56.94 | 17,429,163 |
| $ | 3,943 |
|
On August 3, 2021, our Board of Directors authorized a share repurchase authorization of AIG Common Stock of $6.0 billion (inclusive of the approximately $908 million remaining under the Board’s prior share repurchase authorization).
During the three-month period ended December 31, 2021, we purchased approximately 17 million shares of AIG Common Stock under this authorization for an aggregate purchase price of approximately $992 million.
As of December 31, 2021, approximately $3.9 billion remained under the authorization. From January 1, 2022 to February 15, 2022, we repurchased approximately 9 million shares of AIG Common Stock for an aggregate purchase price of approximately $522 million pursuant to an Exchange Act Rule 10b5-1 repurchase plan. Shares may be repurchased from time to time in the open market, private purchases, through forward, derivative, accelerated repurchase or automatic repurchase transactions or otherwise. Certain of our share repurchases have been and may from time to time be effected through Exchange Act Rule 10b5-1 repurchase plans. The timing of any future share repurchases will depend on market conditions, our business and strategic plans, financial condition, results of operations, liquidity and other factors. The repurchase of AIG Common Stock is also subject to the terms of AIG’s Series A 5.85% Non-Cumulative Preferred Stock (Series A Preferred Stock), pursuant to which AIG may not (other than in limited circumstances) purchase, redeem or otherwise acquire AIG Common Stock unless the full dividends for the latest completed dividend period on all outstanding shares of Series A Preferred Stock have been declared and paid or provided for.
For additional information on our share purchases see Notes 16 and 22 to the Consolidated Financial Statements.
52 AIG | 2021 Form 10-K
ITEM 5 | Market for Registrant’s Common Equity, Related Stockholder Matters and Issuer Purchases of Equity Securities
Common Stock Performance Graph
The following Performance Graph compares the cumulative total shareholder return on AIG Common Stock for a five-year period (December 31, 2016 to December 31, 2021) with the cumulative total return of the S&P’s 500 stock index (which includes AIG), the S&P Property and Casualty Insurance Index and the S&P Life and Health Insurance Index.
Value of $100 Invested on December 31, 2016
(All $ as of December 31st)
|

Dividend reinvestment has been assumed and returns have been weighted to reflect relative stock market capitalization.
| As of December 31, | ||||||||||||||||
|
| 2016 |
|
| 2017 |
|
| 2018 |
|
| 2019 |
|
| 2020 |
|
| 2021 |
AIG | $ | 100.00 |
| $ | 93.14 |
| $ | 63.25 |
| $ | 84.49 |
| $ | 64.84 |
| $ | 99.81 |
S&P 500 |
| 100.00 |
|
| 121.83 |
|
| 116.49 |
|
| 153.17 |
|
| 181.35 |
|
| 233.41 |
S&P 500 Property & Casualty Insurance Index |
| 100.00 |
|
| 122.39 |
|
| 116.64 |
|
| 146.82 |
|
| 157.04 |
|
| 187.31 |
S&P 500 Life & Health Insurance |
| 100.00 |
|
| 116.43 |
|
| 92.24 |
|
| 113.63 |
|
| 102.86 |
|
| 140.59 |
ITEM 6 | Selected Financial Data
Not applicable.
AIG | 2021 Form 10-K 53
ITEM 7 | Management’s Discussion and Analysis of Financial Condition and Results of Operations
Cautionary Statement Regarding Forward-Looking Information
This Annual Report on Form 10-K and other publicly available documents may include, and officers and representatives of AIG may from time to time make and discuss, statements which, to the extent they are not statements of historical or present fact, may constitute “forward looking statements” within the meaning of the U.S. Private Securities Litigation Reform Act of 1995. These forward-looking statements are intended to provide management’s current expectations or plans for AIG’s future operating and financial performance, based on assumptions currently believed to be valid. Forward-looking statements are often preceded by, followed by or include words such as “will,” “believe,” “anticipate,” “expect,” “expectations,” “intend,” “plan,” “strategy,” “prospects,” “project,” “anticipate,” “should,” “see,” “guidance,” “outlook,” “confident,” “focused on achieving,” “view,” “target,” “goal,” “estimate” and other words of similar meaning in connection with a discussion of future operating or financial performance. These statements may include, among other things, projections, goals and assumptions that relate to future actions, prospective services or products, future performance or results of current and anticipated services or products, sales efforts, expense reduction efforts, the outcome of contingencies such as legal proceedings, anticipated organizational, business or regulatory changes, such as the separation of the Life and Retirement business, the effect of catastrophes, such as the COVID-19 pandemic, and macroeconomic events, anticipated dispositions, monetization and/or acquisitions of businesses or assets, or successful integration of acquired businesses, management succession and retention plans, exposure to risk, trends in operations and financial results, and other statements that are not historical facts.
All forward-looking statements involve risks, uncertainties and other factors that may cause AIG’s actual results and financial condition to differ, possibly materially, from the results and financial condition expressed or implied in the forward-looking statements. Factors that could cause AIG’s actual results to differ, possibly materially, from those in the specific projections, goals, assumptions and statements include, without limitation:
54 AIG | 2021 Form 10-K
AIG’s ability to successfully separate the Life and Retirement business and the impact any separation may have on AIG, its businesses, employees, contracts and customers; the occurrence of catastrophic events, both natural and man-made, including COVID-19, other pandemics, civil unrest and the effects of climate change; the effect of economic conditions in the markets in which AIG and its businesses operate in the U.S. and globally and any changes therein, including financial market conditions, fluctuations in interest rates and foreign currency exchange rates and inflationary pressures; AIG’s ability to effectively execute on the AIG 200 operational programs designed to modernize AIG’s operating infrastructure and enhance user and customer experiences, and AIG’s ability to achieve anticipated cost savings from AIG 200; the impact of potential information technology, cybersecurity or data security breaches, including as a result of supply chain disruptions, cyber-attacks or security vulnerabilities, the likelihood of which may increase due to extended remote business operations as a result of COVID-19; the impact of COVID-19 and responses thereto, including new or changed governmental policy and regulatory actions, on AIG’s business, financial condition and results of operations; availability of reinsurance or access to reinsurance on acceptable terms; disruptions in the availability of AIG’s electronic data systems or those of third parties; changes to the valuation of AIG’s investments; actions by rating agencies with respect to AIG’s credit and financial strength ratings as well as those of its businesses and subsidiaries; | concentrations in AIG’s investment portfolios, including as a result of our asset management relationship with Blackstone; the effectiveness of strategies to recruit and retain key personnel and to implement effective succession plans; the effectiveness of AIG’s enterprise risk management policies and procedures, including with respect to business continuity and disaster recovery plans; changes in judgments concerning the recognition of deferred tax assets and the impairment of goodwill; AIG’s ability to effectively execute on ESG targets and standards; AIG’s ability to successfully dispose of, monetize and/or acquire businesses or assets or successfully integrate acquired businesses; nonperformance or defaults by counterparties, including Fortitude Reinsurance Company Ltd. (Fortitude Re); changes in judgments concerning potential cost-saving opportunities; changes to our sources of or access to liquidity; changes in judgments or assumptions concerning insurance underwriting and insurance liabilities; the requirements, which may change from time to time, of the global regulatory framework to which AIG is subject; significant legal, regulatory or governmental proceedings; and such other factors discussed in: –Part I, Item 1A. Risk Factors of this Annual Report; and –this Part II, Item 7. Management’s Discussion and Analysis of Financial Condition and Results of Operations (MD&A) of this Annual Report. |
The forward-looking statements speak only as of the date of this report, or in the case of any document incorporated by reference, the date of that document. We are not under any obligation (and expressly disclaim any obligation) to update or alter any projections, goals, assumptions or other statements, whether written or oral, that may be made from time to time, whether as a result of new information, future events or otherwise. Additional information as to factors that may cause actual results to differ materially from those expressed or implied in the forward-looking statements is disclosed from time to time in our other filings with the SEC.
AIG | 2021 Form 10-K 55
Throughout the MD&A, we use certain terms and abbreviations, which are summarized in the Glossary and Acronyms.
We have incorporated into this discussion a number of cross-references to additional information included throughout this Annual Report to assist readers seeking additional information related to a particular subject.
56 AIG | 2021 Form 10-K
Use of Non-GAAP Measures
Throughout this MD&A, we present our financial condition and results of operations in the way we believe will be most meaningful and representative of our business results. Some of the measurements we use are “non-GAAP financial measures” under SEC rules and regulations. GAAP is the acronym for “generally accepted accounting principles” in the United States. The non-GAAP financial measures we present may not be comparable to similarly-named measures reported by other companies.
We use the following operating performance measures because we believe they enhance the understanding of the underlying profitability of continuing operations and trends of our business segments. We believe they also allow for more meaningful comparisons with our insurance competitors. When we use these measures, reconciliations to the most comparable GAAP measure are provided on a consolidated basis in the Consolidated Results of Operations section of this MD&A.
Book value per common share, excluding accumulated other comprehensive income (loss) (AOCI) adjusted for the cumulative unrealized gains and losses related to Fortitude Re funds withheld assets and deferred tax assets (DTA) (Adjusted book value per common share) is used to show the amount of our net worth on a per-common share basis after eliminating items that can fluctuate significantly from period to period including changes in fair value of AIG’s available for sale securities portfolio, foreign currency translation adjustments and U.S. tax attribute deferred tax assets. This measure also eliminates the asymmetrical impact resulting from changes in fair value of our available for sale securities portfolio wherein there is largely no offsetting impact for certain related insurance liabilities. In addition, we adjust for the cumulative unrealized gains and losses related to Fortitude Re funds withheld assets held by AIG in support of Fortitude Re’s reinsurance obligations to AIG post deconsolidation of Fortitude Re (Fortitude Re funds withheld assets) since these fair value movements are economically transferred to Fortitude Re. We exclude deferred tax assets representing U.S. tax attributes related to net operating loss carryforwards and foreign tax credits as they have not yet been utilized. Amounts for interim periods are estimates based on projections of full-year attribute utilization. As net operating loss carryforwards and foreign tax credits are utilized, the portion of the DTA utilized is included in these book value per common share metrics. Adjusted book value per common share is derived by dividing total AIG common shareholders’ equity, excluding AOCI adjusted for the cumulative unrealized gains and losses related to Fortitude Re funds withheld assets, and DTA (Adjusted Common Shareholders’ Equity), by total common shares outstanding.
Return on common equity – Adjusted after-tax income excluding AOCI adjusted for the cumulative unrealized gains and losses related to Fortitude Re funds withheld assets and DTA (Adjusted return on common equity) is used to show the rate of return on common shareholders’ equity. We believe this measure is useful to investors because it eliminates items that can fluctuate significantly from period to period, including changes in fair value of our available for sale securities portfolio, foreign currency translation adjustments and U.S. tax attribute deferred tax assets. This measure also eliminates the asymmetrical impact resulting from changes in fair value of our available for sale securities portfolio wherein there is largely no offsetting impact for certain related insurance liabilities. In addition, we adjust for the cumulative unrealized gains and losses related to Fortitude Re funds withheld assets since these fair value movements are economically transferred to Fortitude Re. We exclude deferred tax assets representing U.S. tax attributes related to net operating loss carryforwards and foreign tax credits as they have not yet been utilized. Amounts for interim periods are estimates based on projections of full-year attribute utilization. As net operating loss carryforwards and foreign tax credits are utilized, the portion of the DTA utilized is included in Adjusted return on common equity. Adjusted return on common equity is derived by dividing actual or annualized adjusted after-tax income attributable to AIG common shareholders by average Adjusted Common Shareholders’ Equity.
Adjusted after-tax income attributable to AIG common shareholders is derived by excluding the tax effected adjusted pre-tax income (APTI) adjustments described below, dividends on preferred stock, noncontrolling interest on net realized gains (losses) and other non-operating expenses and the following tax items from net income attributable to AIG:
deferred income tax valuation allowance releases and charges;
changes in uncertain tax positions and other tax items related to legacy matters having no relevance to our current businesses or operating performance; and
net tax charge related to the enactment of the Tax Cuts and Jobs Act (the Tax Act).
Adjusted revenues exclude Net realized gains (losses), income from non-operating litigation settlements (included in Other income for GAAP purposes) and changes in fair value of securities used to hedge guaranteed living benefits (included in Net investment income for GAAP purposes). Adjusted revenues is a GAAP measure for our segments.
AIG | 2021 Form 10-K 57
Adjusted pre-tax income is derived by excluding the items set forth below from income from continuing operations before income tax. This definition is consistent across our segments. These items generally fall into one or more of the following broad categories: legacy matters having no relevance to our current businesses or operating performance; adjustments to enhance transparency to the underlying economics of transactions; and measures that we believe to be common to the industry. APTI is a GAAP measure for our segments. Excluded items include the following:
changes in fair value of securities used to hedge guaranteed living benefits; changes in benefit reserves and deferred policy acquisition costs (DAC), value of business acquired (VOBA), and deferred sales inducements (DSI) related to net realized gains and losses; changes in the fair value of equity securities; net investment income on Fortitude Re funds withheld assets; following deconsolidation of Fortitude Re, net realized gains and losses on Fortitude Re funds withheld assets; loss (gain) on extinguishment of debt; all net realized gains and losses except earned income (periodic settlements and changes in settlement accruals) on derivative instruments used for non-qualifying (economic) hedging or for asset replication. Earned income on such economic hedges is reclassified from net realized gains and losses to specific APTI line items based on the economic risk being hedged (e.g. net investment income and interest credited to policyholder account balances); | income or loss from discontinued operations; net loss reserve discount benefit (charge); pension expense related to lump sum payments to former employees; net gain or loss on divestitures; non-operating litigation reserves and settlements; restructuring and other costs related to initiatives designed to reduce operating expenses, improve efficiency and simplify our organization; the portion of favorable or unfavorable prior year reserve development for which we have ceded the risk under retroactive reinsurance agreements and related changes in amortization of the deferred gain; integration and transaction costs associated with acquiring or divesting businesses; losses from the impairment of goodwill; and non-recurring costs associated with the implementation of non-ordinary course legal or regulatory changes or changes to accounting principles. |
General Insurance
– Ratios: We, along with most property and casualty insurance companies, use the loss ratio, the expense ratio and the combined ratio as measures of underwriting performance. These ratios are relative measurements that describe, for every $100 of net premiums earned, the amount of losses and loss adjustment expenses (which for General Insurance excludes net loss reserve discount), and the amount of other underwriting expenses that would be incurred. A combined ratio of less than 100 indicates underwriting income and a combined ratio of over 100 indicates an underwriting loss. Our ratios are calculated using the relevant segment information calculated under GAAP, and thus may not be comparable to similar ratios calculated for regulatory reporting purposes. The underwriting environment varies across countries and products, as does the degree of litigation activity, all of which affect such ratios. In addition, investment returns, local taxes, cost of capital, regulation, product type and competition can have an effect on pricing and consequently on profitability as reflected in underwriting income and associated ratios.
– Accident year loss and accident year combined ratios, as adjusted (Accident year loss ratio, ex-CAT and Accident year combined ratio, ex-CAT): both the accident year loss and accident year combined ratios, as adjusted, exclude catastrophe losses and related reinstatement premiums, prior year development, net of premium adjustments, and the impact of reserve discounting. Natural catastrophe losses are generally weather or seismic events, in each case, having a net impact on AIG in excess of $10 million and man-made catastrophe losses, such as terrorism and civil disorders that exceed the $10 million threshold. We believe that as adjusted ratios are meaningful measures of our underwriting results on an ongoing basis as they exclude catastrophes and the impact of reserve discounting which are outside of management’s control. We also exclude prior year development to provide transparency related to current accident year results.
Life and Retirement
– Premiums and deposits: includes direct and assumed amounts received and earned on traditional life insurance policies, group benefit policies and life-contingent payout annuities, as well as deposits received on universal life, investment-type annuity contracts, Federal Home Loan Bank (FHLB) funding agreements and mutual funds. We believe the measure of premiums and deposits is useful in understanding customer demand for our products, evolving product trends and our sales performance period over period.
Results from discontinued operations are excluded from all of these measures.
58 AIG | 2021 Form 10-K
Critical Accounting Estimates
The preparation of financial statements in accordance with GAAP requires the application of accounting policies that often involve a significant degree of judgment.
The accounting policies that we believe are most dependent on the application of estimates and assumptions, which are critical accounting estimates, are related to the determination of: |
loss reserves; future policy benefit reserves for life and accident and health insurance contracts; liabilities for guaranteed benefit features of variable annuity, fixed annuity and fixed index annuity products; embedded derivative liabilities for fixed index annuity and life products; estimated gross profits to value deferred acquisition costs and unearned revenue for investment-oriented products; reinsurance assets, including the allowance for credit losses and disputes; goodwill impairment; allowance for credit losses on certain investments, primarily on loans and available for sale fixed maturity securities; legal contingencies; fair value measurements of certain financial assets and financial liabilities; and income taxes, in particular the recoverability of our deferred tax asset and establishment of provisions for uncertain tax positions. |
These accounting estimates require the use of assumptions about matters, some of which are highly uncertain at the time of estimation. To the extent actual experience differs from the assumptions used, our consolidated financial condition, results of operations and cash flows could be materially affected.
Loss Reserves
Loss reserves represent the accumulation of estimates of unpaid claims, including estimates for claims incurred but not reported and loss adjustment expenses, less applicable discount. We regularly review and update the methods used to determine loss reserve estimates. Because these estimates are subject to the outcome of future events, changes in estimates are common given that loss trends vary and time is often required for changes in trends to be recognized and confirmed.
The estimate of loss reserves relies on several key judgments:
the determination of the actuarial methods used as the basis for these estimates;
the relative weights given to these models by product line;
the underlying assumptions used in these models; and
the determination of the appropriate groupings of similar product lines and, in some cases, the disaggregation of dissimilar losses within a product line.
Numerous assumptions are made in determining the best estimate of reserves for each line of business, in consideration of expected ultimate losses, loss cost trends and development factors, where appropriate. The importance of any one assumption can vary by both line of business and accident year. Because such assumptions may differ from actual experience, there is potential for significant variation in the development of loss reserves. This estimation uncertainty is particularly relevant for long-tail lines of business.
All of our methods to calculate net reserves include assumptions about estimated reinsurance recoveries and their collectability. Reinsurance collectability is evaluated independently of the reserving process and appropriate allowances for uncollectible reinsurance are established.
AIG | 2021 Form 10-K 59
Overview of Loss Reserving Process and Methods
Our loss reserves can generally be categorized into two distinct groups: short-tail reserves and long-tail reserves. Short-tail reserves consist principally of U.S. Property and Special Risks, Europe Property and Special Risks, U.S. Personal Insurance, and Europe and Japan Personal Insurance. Long-tail reserves include U.S. Workers’ Compensation, U.S. Excess Casualty, U.S. Other Casualty, U.S. Financial Lines, Europe Casualty and Financial Lines, and U.S. Run-Off Long Tail Insurance Lines.
Short-Tail Reserves
For our short-tail coverages, such as property, where the nature of claims is generally high frequency with short reporting periods, with volatility arising from occasional severe events, the process for recording non-catastrophe quarterly loss reserves is geared toward maintaining IBNR based on percentages of net earned premiums for that business, rather than projecting ultimate loss ratios based on reported losses. For example, the IBNR reserve required for the latest accident quarter for a product line such as homeowners might be approximately 20 percent of the quarter’s earned premiums. This level of reserve would generally be recorded regardless of the actual losses reported in the current quarter, thus recognizing severe events as they occur. The percent of premium factor reflects both our expectation of the ultimate loss costs associated with the line of business and the expectation of the percentage of ultimate loss costs that have not yet been reported. The expected ultimate loss costs generally reflect the average loss costs from a period of preceding accident quarters that have been adjusted for changes in rate and loss cost levels, mix of business, known exposure to unreported losses, or other factors affecting the line of business. The expected percentage of ultimate loss costs that have not yet been reported would be derived from historical loss emergence patterns. For more mature quarters, specific loss development methods would be used to determine the IBNR. For other product lines where the nature of claims is high frequency but low severity, methods including loss development, frequency/severity or a multiple of average monthly losses may be used to determine IBNR reserves. IBNR for claims arising from catastrophic events or events of unusual severity would be determined in close collaboration with the claims department’s evaluation of known information, using alternative techniques or expected percentages of ultimate loss cost emergence based on historical loss emergence of similar claim types.
Long-Tail Reserves
Estimation of loss reserves for our long-tail Casualty lines of business is a complex process and depends on a number of factors, including the product line and volume of business, as well as estimates of reinsurance recoveries. Experience in more recent accident years generally provides limited statistical credibility of reported net losses on long-tail Casualty lines of business. That is because in the more recent accident years, a relatively low proportion of estimated ultimate net incurred losses are reported or paid. Therefore, IBNR reserves constitute a relatively high proportion of loss reserves.
For our long-tail lines, we generally make actuarial and other assumptions with respect to the following:
Loss cost trend factors, which are used to establish expected loss ratios for subsequent accident years based on the projected loss ratios for prior accident years.
Expected loss ratios, which are used for the latest accident year and, in some cases, for accident years prior to the latest accident year. The expected loss ratio generally reflects the projected loss ratio from prior accident years, adjusted for the loss cost trend and the effect of rate changes and other quantifiable factors on the loss ratio.
Loss development factors, which are used to project the reported losses for each accident year to an ultimate basis. Generally, the actual loss development factors observed from prior accident years would be used as a basis to determine the loss development factors for the subsequent accident years.
Tail factors, which are development factors used for certain long-tail lines of business (for example, excess casualty, workers’ compensation and general liability), to project future loss development for periods that extend beyond the available development data. The development of losses to the ultimate loss for a given accident year for these lines may take decades and the projection of ultimate losses for an accident year is very sensitive to the tail factors selected beyond a certain age.
We record quarterly changes in loss reserves for each product line of business. The overall change in our loss reserves is based on the sum of the changes for all product lines of business. For most long-tail product lines of business, the quarterly loss reserve changes are based on the estimated current loss ratio for each subset of coverage less any amounts paid. Also, any change in estimated ultimate losses from prior accident years deemed to be necessary based on the results of our latest detailed valuation reviews, large loss analyses, or other analytical techniques, either positive or negative, is reflected in the loss reserve and incurred losses for the current quarter. Differences between actual loss emergence in a given period and our expectations based on prior loss reserve estimates are used to monitor reserve adequacy between detailed valuation reviews and may also influence our judgment with respect to adjusting reserve estimates.
60 AIG | 2021 Form 10-K
Details of the Loss Reserving Process
The process of determining the current loss ratio for each product line of business is based on a variety of factors. These include considerations such as: prior accident year and policy year loss ratios; rate changes; and changes in coverage, reinsurance, or mix of business. Other considerations include actual and anticipated changes in external factors such as trends in loss costs, inflation, employment rates or unemployment duration or in the legal and claims environment. The current loss ratio for each product line of business is intended to represent our best estimate after reflecting all relevant factors. At the close of each quarter, the assumptions and data underlying the loss ratios are reviewed to determine whether they remain appropriate. This process includes a review of the actual loss experience in the quarter, actual rate changes achieved, actual changes in reinsurance, quantifiable changes in coverage or mix of business, and changes in other factors that may affect the loss ratio. The loss ratio is changed to reflect the revised estimate if this review suggests that the previously determined loss ratio is no longer appropriate.
We conduct a comprehensive loss reserve detailed valuation review at least annually for each product line of business in accordance with Actuarial Standards of Practice. These standards provide that the unpaid loss estimate may be presented in a variety of ways, such as a point estimate, a range of estimates, a point estimate based on the expected value of several reasonable estimates, or a probability distribution of the unpaid loss amount. Our actuarial best estimate for each product line of business represents an expected value generally considering a range of reasonably possible outcomes.
The reserve analysis for each product line of business is performed by a credentialed actuarial team in collaboration with claims, underwriting, business unit management, risk management and senior management. Our actuaries consider the ongoing applicability of prior data groupings and update numerous assumptions, including the analysis and selection of loss development and loss trend factors. They also determine and select the appropriate actuarial or other methods used to develop our best estimate for each business product line, and may employ multiple methods and assumptions for each product line. These data groupings, accident year weights, method selections and assumptions necessarily change over time as business mix changes, development factors mature and become more credible and loss characteristics evolve. Through the execution of these detailed valuation reviews an actuarial best estimate of the loss reserve is determined. The sum of these estimates for each product line of business yields an overall actuarial best estimate for that line of business.
For certain product lines, we measure sensitivities and determine explicit ranges around the actuarial best estimate using multiple methodologies and varying assumptions. Where we have ranges, we use them to inform our selection of best estimates of loss reserves by product line of business. Our range of reasonable estimates is not intended to cover all possibilities or extreme values and is based on known data and facts at the time of estimation.
We consult with third-party environmental litigation and engineering specialists, third-party toxic tort claims professionals, third-party clinical and public health specialists, third-party workers’ compensation claims adjusters and third-party actuarial advisors to help inform our judgments, as needed.
A critical component of our detailed valuation reviews is an internal peer review of our reserving analyses and conclusions, where actuaries independent of the initial review evaluate the reasonableness of assumptions used, methods selected and weightings given to different methods. In addition, each detailed valuation review is subjected to a review and challenge process by specialists in our Enterprise Risk Management group.
Key factors considered in performing detailed actuarial reviews, include:
an assessment of economic conditions including inflation, employment rates or unemployment duration;
changes in the legal, regulatory, judicial and social environment including changes in road safety, public health and cleanup standards;
changes in medical cost trends (inflation, intensity and utilization of medical services) and wage inflation trends;
underlying policy pricing, terms and conditions including attachment points and policy limits;
changes in claims handling philosophy, operating model, processes and related ongoing enhancements;
third-party claims reviews that are periodically performed for key product lines of business such as toxic tort, environmental and other complex casualty;
third-party actuarial reviews that are periodically performed for key product lines of business;
input from underwriters on pricing, terms, and conditions and market trends; and
changes in our reinsurance program, pricing and commutations.
AIG | 2021 Form 10-K 61
Actuarial and Other Methods for Our Lines of Business
Our actuaries determine the appropriate actuarial methods and segmentation. This determination is based on a variety of factors including the nature of the losses associated with the product line of business, such as the frequency or severity of the claims. In addition to determining the actuarial methods, the actuaries determine the appropriate loss reserve groupings of data. This determination is a judgmental, dynamic process and refinements to the groupings are made every year. The groupings may change to reflect observed or emerging patterns within and across product lines, or to differentiate risk characteristics (for example, size of deductibles and extent of third-party claims specialists used by our insureds). As an example of reserve segmentation, we write many unique subsets of professional liability insurance, which cover different products, industry segments, and coverage structures. While for pricing or other purposes, it may be appropriate to evaluate the profitability of each subset individually, we believe it is appropriate to combine the subsets into larger groups for reserving purposes to produce a greater degree of credibility in the loss experience. This determination of data segmentation and related actuarial methods is assessed, reviewed and updated at least annually.
The actuarial methods we use most commonly include paid and incurred loss development methods, expected loss ratio methods, including “Bornhuetter Ferguson” and “Cape Cod”, and frequency/severity models. Loss development methods utilize the actual loss development patterns from prior accident years updated through the current year to project the reported losses to an ultimate basis for all accident years. We also use this information to update our current accident year loss selections. Loss development methods are generally most appropriate for lines of business that exhibit a stable pattern of loss development from one accident year to the next, and for which the components of the product line have similar development characteristics. For example, property exposures would generally not be combined into the same product line as casualty exposures, and primary casualty exposures would generally not be combined into the same product line as excess casualty exposures. We continually refine our loss reserving techniques and adopt further segmentations based on our analysis of differing emerging loss patterns for certain product lines. We generally use expected loss ratio methods in cases where the reported loss data lacked sufficient credibility to utilize loss development methods, such as for new product lines of business or for long-tail product lines at early stages of loss development. Frequency/severity models may be used where sufficient frequency counts are available to apply such approaches.
Expected loss ratio methods rely on the application of an expected loss ratio to the earned premium for the product line of business to determine the liability for loss reserves and loss adjustment expenses. For example, an expected loss ratio of 70 percent applied to an earned premium base of $10 million for a product line of business would generate an ultimate loss estimate of $7 million. Subtracting any paid losses and loss adjustment expenses would result in the indicated loss reserve for this product line. Under the Bornhuetter Ferguson method, the expected loss ratio is applied only to the expected unreported portion of the losses. For example, for a long-tail product line of business for which only 10 percent of the losses are expected to be reported at the end of the accident year, the expected loss ratio would be used to represent the 90 percent of losses still unreported. The actual reported losses at the end of the accident year would be added to determine the total ultimate loss estimate for the accident year. Subtracting the reported paid losses and loss adjustment expenses would result in the indicated loss reserve. In the example above, the expected loss ratio of 70 percent would be multiplied by 90 percent. The result of 63 percent would be applied to the earned premium of $10 million resulting in an estimated unreported loss of $6.3 million. Actual reported losses would be added to arrive at the total ultimate losses. If the reported losses were $1 million, the ultimate loss estimate under the Bornhuetter Ferguson method would be $7.3 million versus the $7 million amount under the expected loss ratio method described above. Thus, the Bornhuetter Ferguson method gives partial credibility to the actual loss experience to date for the product line of business. Loss development methods generally give full credibility to the reported loss experience to date. In the example above, loss development methods would typically indicate an ultimate loss estimate of $10 million, as the reported losses of $1 million would be estimated to reflect only 10 percent of the ultimate losses.
A key advantage of loss development methods is that they respond more quickly to any actual changes in loss costs for the product line of business. Therefore, if loss experience is unexpectedly deteriorating or improving, the loss development method gives full credibility to the changing experience. Expected loss ratio methods would be slower to respond to the change, as they would continue to give more weight to a prior expected loss ratio, until enough evidence emerged to modify the expected loss ratio to reflect the changing loss experience. On the other hand, loss development methods have the disadvantage of overreacting to changes in reported losses if the loss experience is anomalous due to the various key factors described above and the inherent volatility in some of the lines. For example, the presence or absence of large losses at the early stages of loss development could cause the loss development method to overreact to the favorable or unfavorable experience by assuming it is a fundamental shift in the development pattern. In these instances, expected loss ratio methods such as Bornhuetter Ferguson have the advantage of recognizing large losses without extrapolating unusual large loss activity onto the unreported portion of the losses for the accident year.
The Cape Cod method is a hybrid between the loss development and Bornhuetter Ferguson methods, where the historic loss data and loss development factor assumptions are used to determine the expected loss ratio estimate in the Bornhuetter Ferguson method.
62 AIG | 2021 Form 10-K
Frequency/severity methods generally rely on the determination of an ultimate number of claims and an average severity for each claim for each accident year. Multiplying the estimated ultimate number of claims for each accident year by the expected average severity of each claim produces the estimated ultimate loss for the accident year. Frequency/severity methods generally require a sufficient volume of claims in order for the average severity to be predictable. Average severity for subsequent accident years is generally determined by applying an estimated annual loss cost trend to the estimated average claim severity from prior accident years. In certain cases, a structural approach may also be used to predict the ultimate loss cost. Frequency/severity methods have the advantage that ultimate claim counts can generally be estimated more quickly and accurately than can ultimate losses. Thus, if the average claim severity can be accurately estimated, these methods can more quickly respond to changes in loss experience than other methods. However, for average severity to be predictable, the product line of business must consist of homogenous types of claims for which loss severity trends from one year to the next are reasonably consistent and where there are limited changes to deductible levels or limits. Generally these methods work best for high frequency, low severity product lines of business such as personal auto. However, frequency and severity metrics are also used to test the reasonability of results for other product lines of business and provide indications of underlying trends in the data. In addition, ultimate claim counts can be used as an alternative exposure measure to earned premiums in the Cape Cod method.
Structural driver analytics seek to explain the underlying drivers of frequency/severity. A structural driver analysis of frequency/severity is particularly useful for understanding the key drivers of uncertainty in the ultimate loss cost. For example, for the excess workers’ compensation product line of business, we have attempted to corroborate our judgment by considering the impact on severity of the future potential for deterioration of an injured worker’s medical condition, the impact of price inflation on the various categories of medical expense and cost of living adjustments on indemnity benefits, the impact of injured worker mortality and claim specific settlement and loss mitigation strategies, etc., using the following:
Claim by claim reviews, often facilitated by third-party specialists, to determine the stability and likelihood of settling an injured worker’s indemnity and medical benefits;
Analysis of the potential for future deterioration in medical condition unlikely to be picked up by a claim file review and associated with potentially costly medical procedures (i.e., increases in both utilization and intensity of medical care) over the course of the injured worker’s lifetime;
Analysis of the cost of medical price inflation for each category of medical spend (services and devices) and for cost of living adjustments in line with statutory requirements;
Portfolio specific mortality level and mortality improvement assumptions based on a mortality study conducted for our primary and excess workers’ compensation portfolios and our opinion of future longevity trends for the open reported cases;
Ground-up consideration of the reinsurance recoveries expected for the product line of business for reported claims with extrapolation for unreported claims; and
The effects of various run-off loss management strategies that have been developed by our run-off unit.
In recent years, we have expanded our analysis of structural drivers to additional product lines of business as a means of corroborating our judgments using traditional actuarial techniques. For example, we have explicitly used external estimates of future medical inflation and mortality in estimating the loss development tail for excess of deductible primary workers’ compensation business. Using external forecasts for items such as these can improve the accuracy and stability of our estimates.
The estimation of liability for loss reserves and loss adjustment expenses relating to asbestos and environmental pollution losses on insurance policies written many years ago is typically subject to greater uncertainty than other types of losses. This is due to inconsistent court decisions, as well as judicial interpretations and legislative actions that in some cases have tended to broaden coverage beyond the original intent of such policies or have expanded theories of liability. In addition, reinsurance recoverable balances relating to asbestos and environmental loss reserves are subject to greater uncertainty due to the underlying age of the claim, underlying legal issues surrounding the nature of the coverage, and determination of proper policy period. For these reasons, these balances tend to be subject to increased levels of disputes and legal collection activity when actually billed. The insurance industry as a whole is engaged in extensive litigation over these coverage and liability issues and is thus confronted with a continuing uncertainty in its efforts to quantify these exposures.
We continue to receive claims asserting injuries and damages from toxic waste, hazardous substances, and other environmental pollutants and alleged claims to cover the cleanup costs of hazardous waste dump sites, referred to collectively as environmental claims, and indemnity claims asserting injuries from asbestos. The vast majority of these asbestos and environmental losses emanate from policies written in 1984 and prior years. Commencing in 1985, standard policies contained absolute exclusions for pollution-related damage and asbestos. The current environmental policies that we specifically price and underwrite for environmental risks on a claims-made basis have been excluded from the analysis.
AIG | 2021 Form 10-K 63
The majority of our exposures for asbestos and environmental losses are related to excess casualty coverages, not primary coverages. The litigation costs are treated in the same manner as indemnity amounts, with litigation expenses included within the limits of the liability we incur. Individual significant loss reserves, where future litigation costs are reasonably determinable, are established on a case-by-case basis.
Key Assumptions of our Actuarial Methods by Line of Business
Line of | Key Assumptions |
U.S. Workers’ | We generally use a combination of loss development and expected loss ratio methods for U.S. Workers’ Compensation as this is a long-tail line of business. The loss cost trend assumption is not believed to be material with respect to our guaranteed cost loss reserves. This is primarily because our actuaries are generally able to use loss development projections for all but the most recent accident year’s reserves, so there is limited need to rely on loss cost trend assumptions for primary workers’ compensation business. |
| The tail factor is typically the most critical assumption, and small changes in the selected tail factor can have a material effect on our carried reserves. For example, the tail factors beyond twenty years for guaranteed cost business could vary by one and one-half percent below to two percent above those indicated in the 2021 detailed valuation review. For excess of deductible business, in our judgment, it is reasonably likely that tail factors beyond twenty years could vary by four percent below to six percent above those indicated in the 2021 detailed valuation review. |
U.S. Excess Casualty | We utilize various loss cost trend assumptions for different segments of the portfolio. In our judgment, after evaluating the historical loss cost trends from prior accident years since the early 1990s, it is reasonably likely that actual loss cost trends applicable to the year-end 2021 detailed valuation review for U.S. Excess Casualty may range five percent lower or higher than this estimated loss trend. The loss cost trend assumption is critical for the U.S. Excess Casualty line of business due to the long-tail nature of the losses, and it is applied across many accident years. Thus, there is the potential for the loss reserves with respect to a number of accident years (the expected loss ratio years) to be significantly affected by changes in loss cost trends that were initially relied upon in setting the loss reserves. These changes in loss trends could be attributable to changes in inflation or in the judicial environment, or in other social or economic conditions affecting losses. U.S. Excess Casualty is a long-tail line of business and any deviation in loss development factors might not be discernible for an extended period of time subsequent to the recording of the initial loss reserve estimates for any accident year. Mass tort claims in particular may develop over a very extended period and impact multiple accident years, so we usually select a separate pattern for them. Thus, there is the potential for the loss reserves with respect to a number of accident years to be significantly affected by changes in loss development factors that were initially relied upon in setting the reserves. In our judgment, after evaluating the historical loss development factors from prior accident years since the early 1990s, in our judgment, it is reasonably likely that the actual loss development factors could vary by an amount equivalent to a six month shift from those actually utilized in the year-end 2021 detailed valuation review. This would impact projections both for accident years where the selections were directly based on loss development methods as well as the a priori loss ratio assumptions for accident years with selections based on Bornhuetter Ferguson or Cape Cod methods. Similar to loss cost trends, these changes in loss development factors could be attributable to changes in inflation or in the judicial environment, or in other social or economic conditions affecting losses. |
U.S. Other Casualty | The key uncertainties for other casualty lines are similar to U.S. Excess Casualty, as the underlying business is long-tailed and can be subject to variability in loss cost trends and changes in loss development factors. These may differ significantly by line of business as coverages such as general liability, medical malpractice and environmental may be subject to different risk drivers. |
64 AIG | 2021 Form 10-K
Line of | Key Assumptions |
U.S. Financial Lines
| The loss cost trends for U.S. Directors and Officers (D&O) liability business vary by year and subset. After evaluating the historical loss cost levels from prior accident years since the early 1990s, including the potential effect of losses relating to the credit crisis, in our judgment, it is reasonably likely that the actual variation in loss cost levels for these subsets could vary by approximately 10 percent lower or higher on a year-over-year basis than the assumptions actually utilized in the year-end 2021 reserve review. Because the U.S. D&O business has exhibited highly volatile loss trends from one accident year to the next, there is the possibility of an exceptionally high deviation. In our analysis, the effects of loss cost trend assumptions affect the results through the a priori loss ratio assumptions used for the Bornhuetter Ferguson and Cape Cod methods, which impact the projections for the more recent accident years. The selected loss development factors are also an important assumption, but are less critical than for U.S. Excess Casualty. Because these lines are written on a claims made basis, the loss reporting and development tail is much shorter than for U.S. Excess Casualty. However, the high severity nature of the losses does create the potential for significant deviations in loss development patterns from one year to the next. Similar to U.S. Excess Casualty, after evaluating the historical loss development factors from prior accident years since the early 1990s, in our judgment, it is reasonably likely that actual loss development factors could change by an amount equivalent to a shift by six months from those actually utilized in the year-end 2021 reserve review. |
UK/Europe Casualty and Financial Lines | Similar to U.S. business, European Casualty and Financial Lines can be significantly impacted by loss cost trends and changes in loss development factors. The variation in such factors can differ significantly by product and region. |
U.S. and UK/Europe Property and Special Risks | For short-tail lines such as Property and Special Risks, variance in outcomes for individual large claims or events can have a significant impact on results. These outcomes generally relate to unique characteristics of events such as catastrophes or losses with significant business interruption claims. |
U.S., UK/Europe and Japan Personal Insurance | Personal Insurance is short-tailed in nature similar to Property and Special Risks but less volatile. Variance in estimates can result from unique events such as catastrophes. In addition, some subsets of this business, such as auto liability, can be impacted by changes in loss development factors and loss cost trends. |
U.S. Run-Off Long Tail Insurance Lines | These are extremely long-tailed lines of business, and as such, carry a greater than normal degree of uncertainty when selecting loss development factors. Historically, we have used a combination of loss development methods and expected loss ratio methods for excess workers’ compensation and other run-off insurance lines. For environmental claims, we have utilized a variety of methods including traditional loss development approaches, claim department and other expert evaluations of the ultimate costs for certain claims and survival ratio metrics. |
Other Reserve Items | Loss adjustment expenses (LAE) are separated into two broad categories: allocated loss adjustment expenses, also referred to as legal defense and cost containment or “legal” and unallocated loss adjustment expenses, which includes certain claims adjuster fees and other internal claim management costs. We determine reserves for legal expenses for each line of business by one or more actuarial or structural driver methods. For most lines of business, legal costs are analyzed in conjunction with losses. For lines of business where they are separately analyzed the methods used generally include development methods comparable to those described for loss development methods. The development could be based on either the paid loss adjustment expenses or the ratio of paid loss adjustment expenses to paid losses, or both. Other methods include the utilization of expected ultimate ratios of paid loss expense to paid losses, based on actual experience from prior accident years or from similar product lines of business. The bulk of adjuster expenses are allocated and charged to individual claim files. For these expenses, we generally determine reserves based on calendar year ratios of adjuster expenses paid to losses paid for the particular product line of business. For other internal claim costs, which generally relate to specific claim department expenses that are not allocated to individual claim files such as technology costs and other broad initiatives, we look at historic and expected expenditures for these items and project these into the future. The incidence of LAE is directly related to the frequency, complexity and level of underlying claims. As a result, a key driver of variability in LAE is the variability in the overall claims, particularly for long tail lines. |
AIG | 2021 Form 10-K 65
The following sensitivity analysis table summarizes the effect on the loss reserve position of using certain alternative loss cost trend (for accident years where we use expected loss ratio methods) or loss development factor assumptions rather than the assumptions actually used in determining our estimates in the year-end loss reserve analyses in 2021:
December 31, 2021 | Increase (Decrease) |
|
|
| Increase (Decrease) | ||
(in millions) | to Loss Reserves |
|
|
| to Loss Reserves | ||
Loss cost trends: |
|
|
|
| Loss development factors: |
|
|
U.S. Excess Casualty: |
|
|
|
| U.S. Excess Casualty: |
|
|
4.5 percent increase | $ | 960 |
|
| 2.5 percent tail factor increase | $ | 1,030 |
3.5 percent decrease |
| (580) |
|
| 2.0 percent tail factor decrease |
| (830) |
U.S. Financial Lines (D&O) |
|
|
|
| U.S. Financial Lines (D&O) |
|
|
5.5 percent increase |
| 1,140 |
|
| 3.0 percent tail factor increase |
| 680 |
4.0 percent decrease |
| (700) |
|
| 2.25 percent tail factor decrease |
| (510) |
|
|
|
|
| U.S. Workers' Compensation: |
|
|
|
|
|
|
| Tail factor increase(a) |
| 790 |
|
|
|
|
| Tail factor decrease(b) |
| (540) |
(a) Tail factor increase of 1.5 percent for guaranteed cost business and 2 percent for deductible business.
(b) Tail factor decrease of 1 percent for guaranteed cost business and 1.5 percent for deductible business.
For additional information on our reserving process and methodology see Note 12 to the Consolidated Financial Statements.
Future Policy Benefit RESERVEs for Life and Accident and Health Insurance Contracts
Long-duration traditional products primarily include whole life insurance, term life insurance, and certain payout annuities for which the payment period is life-contingent, which include certain of our single premium immediate annuities including U.S. pension risk transfer (PRT) business and structured settlements. In addition, these products also include accident and health, and long-term care (LTC) insurance. The LTC block is in run-off and has been fully reinsured with Fortitude Re.
For long-duration traditional business, a “lock-in” principle applies. Generally, future policy benefits are payable over an extended period of time and related liabilities are calculated as the present value of future benefits less the present value of future net premiums (portion of the gross premium required to provide for all benefits and expenses). The assumptions used to calculate the benefit liabilities and DAC are set when a policy is issued and do not change with changes in actual experience, unless a loss recognition event occurs. The assumptions include mortality, morbidity, persistency, maintenance expenses, and investment returns. These assumptions are typically consistent with pricing inputs. The assumptions also include margins for adverse deviation, principally for key assumptions such as mortality and interest rates used to discount cash flows, to reflect uncertainty given that actual experience might deviate from these assumptions. Establishing margins at contract inception requires management judgment. The extent of the margin for adverse deviation may vary depending on the uncertainty of the cash flows, which is affected by the volatility of the business and the extent of our experience with the product.
66 AIG | 2021 Form 10-K
Overview of Loss Recognition Process and Methods
Loss recognition occurs if observed changes in actual experience or estimates result in projected future losses under loss recognition testing. To determine whether loss recognition exists, we determine whether a future loss is expected based on updated current best estimate assumptions. If loss recognition exists, the assumptions as of the loss recognition test date are locked-in and used in subsequent valuations and the net reserves continue to be subject to loss recognition testing. Because of the long-term nature of many of our liabilities subject to the “lock-in” principle, small changes in certain assumptions may cause large changes in the degree of reserve balances. In particular, changes in estimates of future invested asset returns have a large effect on the degree of reserve balances.
Groupings for loss recognition testing are consistent with our manner of acquiring, servicing, and measuring the profitability of the business and are applied by product groupings, that span across issuance years, including traditional life, payout annuities and LTC insurance. Once loss recognition has been recorded for a block of business, the old assumption set is replaced and the assumption set used for the loss recognition would then be subject to the lock-in principle. Our policy is to perform loss recognition testing net of reinsurance. The business ceded to Fortitude Re, is grouped separately. Since 100 percent of the risk has been ceded, no additional loss recognition events are expected to occur unless this business is recaptured.
Key judgments made in loss recognition testing include the following:
To determine investment returns used in loss recognition tests, we project future cash flows on the assets supporting the liabilities. The duration of these assets is generally comparable to the duration of the liabilities and such, assets are primarily comprised of diversified portfolio of high to medium quality fixed maturity securities, and may also include, to a lesser extent, alternative investments. Our projections include a reasonable allowance for investment expenses and expected credit losses over the projection horizon. A critical assumption in the projection of expected investment income is the assumed net rate of investment return at which excess cash flows are to be reinvested.
For mortality assumptions, base future assumptions take into account industry and our historical experience, as well as expected mortality changes in the future. The latter judgment is based on a combination of historical mortality trends and industry observations, public health and demography specialists that were consulted by AIG’s actuaries and published industry information.
For surrender rates, key judgments involve the correlation between expected increases/decreases in interest rates and increases/decreases in surrender rates. To support this judgment, we compare crediting rates on our products to expected rates on competing products under different interest rate scenarios.
Significant unrealized appreciation on investments in a low interest rate environment may cause DAC to be adjusted and additional future policy benefit liabilities to be recorded through a charge directly to accumulated other comprehensive income (changes related to unrealized appreciation or depreciation of investments). These charges are included, net of tax, with the change in net unrealized appreciation of investments. In applying changes related to unrealized appreciation of investments, the Company overlays unrealized gains and other changes related to unrealized appreciation of investments onto loss recognition tests.
For additional information on impact of changes related to unrealized appreciation (depreciation) to investments, see Note 8 to the Consolidated Financial Statements.
For universal life policies with secondary guarantees, we recognize certain liabilities in addition to policyholder account balances. For universal life policies with secondary guarantees, as well as other universal life policies for which profits followed by losses are expected at contract inception, a liability is recognized based on a benefit ratio of (i) the present value of total expected payments, in excess of the account value, over the life of the contract, divided by (ii) the present value of total expected assessments over the life of the contract. Universal life account balances as well as these additional liabilities related to universal life products are reported within Future Policy Benefits in the Consolidated Balance Sheets. These additional liabilities are also adjusted to reflect the effect of unrealized gains or losses on fixed maturity securities available for sale on accumulated assessments, with related changes recognized through Other comprehensive income (loss). The primary policyholder behavior assumptions for these liabilities include mortality, lapses and premium persistency. The primary capital market assumptions used for the liability for universal life secondary guarantees include discount rates and net earned rates.
For additional information on actuarial assumption updates see Insurance Reserves – Life and Annuity Future Policy Benefits, Policyholder Contract Deposits and DAC – Update of Actuarial Assumptions and Models – Investment-Oriented Products.
AIG | 2021 Form 10-K 67
LIABILITIES FOR Guaranteed Benefit Features of Variable Annuity, FIXED ANNUITY AND FIXED INDEX ANNUITY Products
Variable annuity products offered by our Individual Retirement and Group Retirement segments offer guaranteed benefit features. These guaranteed features include guaranteed minimum death benefits (GMDB) that are payable in the event of death and living benefits that guarantee lifetime withdrawals regardless of fixed account and separate account value performance. Living benefit features primarily include guaranteed minimum withdrawal benefits (GMWB).
For additional information on these features, see Note 13 to the Consolidated Financial Statements.
The liability for GMDB, which is recorded in future policy benefits, represents the expected value of benefits in excess of the projected account value, with the excess recognized ratably through Policyholder benefits over the accumulation period based on total expected fee assessments. The liabilities for variable annuity GMWB, which are recorded in Policyholder contract deposits, are accounted for as embedded derivatives measured at fair value, with changes in the fair value of the liabilities recorded in net realized gains (losses).
Certain of our fixed annuity and fixed index annuity contracts, which are not offered through separate accounts, contain optional GMWB benefits. Different versions of these GMWB riders contain different guarantee provisions. The liability for GMWB benefits in fixed annuity and fixed index annuity contracts for which the rider guarantee is considered to be clearly and closely related to the host contract are recorded in future policy benefits. This GMWB liability represents the expected value of benefits in excess of the projected account value, with the excess recognized ratably over the accumulation period based on total expected assessments, through Policyholder benefits. For rider guarantees that are linked to equity indices that are considered to be embedded derivatives that are not clearly and closely related to the host contract, the GMWB liability is recorded in Policyholder contract deposits and measured at fair value, with changes in the fair value of the liabilities recorded in net realized gains (losses).
Our exposure to the guaranteed amounts is equal to the amount by which the contract holder’s account balance is below the amount provided by the guaranteed feature. A deferred annuity contract may include more than one type of guaranteed benefit feature; for example, it may have both a GMDB and a GMWB. However, a policyholder can generally only receive payout from one guaranteed feature on a contract containing a death benefit and a living benefit, i.e., the features are generally mutually exclusive (except a surviving spouse who has a rider to potentially collect both a GMDB upon their spouse’s death and a GMWB during his or her lifetime). A policyholder cannot purchase more than one living benefit on one contract. Declines in the equity markets, increased volatility and a low interest rate environment increase our exposure to potential benefits under the guaranteed features, leading to an increase in the liabilities for those benefits.
For sensitivity analysis which includes the sensitivity of reserves for guaranteed benefit features to changes in the assumptions for interest rates, equity returns, volatility, and mortality see “Estimated Gross Profits to Value Deferred Acquisition Costs and Unearned Revenue for Investment-Oriented Products” below.
For additional information on market risk management related to these product features, see “Enterprise Risk Management – Insurance Risks – Life and Retirement Companies’ Key Risks – Variable Annuity, Index Annuity and Universal Life Risk Management and Hedging Programs.”
68 AIG | 2021 Form 10-K
The reserving methodology and assumptions used to measure the liabilities of our two largest guaranteed benefit features are presented in the following table:
Guaranteed Benefit Feature | Reserving Methodology & |
GMDB and Fixed and certain Fixed Index Annuity GMWB | We determine the GMDB liability at each balance sheet date by estimating the expected value of death benefits in excess of the projected account balance and recognizing the excess ratably over the accumulation period based on total expected fee assessments. For certain fixed and fixed index annuity products, we determine the GMWB liability at each balance sheet date by estimating the expected withdrawal benefits once the projected account balance has been exhausted ratably over the accumulation period based on total expected assessments. These GMWB features are deemed to not be embedded derivatives as the GMWB feature is determined to be clearly and closely related to the host contract. The present value of the total expected excess payments (e.g., payments in excess of account value) over the life of contract divided by the present value of total expected assessments is referred to as the benefit ratio. The magnitude and direction of the change in reserves may vary over time based on the emergence of the benefit ratio and the level of assessments. For additional information on how we reserve for variable and fixed index annuity products with guaranteed benefit features see Note 13 to the Consolidated Financial Statements. |
Key assumptions and projections include: • Interest credited that varies by year of issuance and products • Actuarially determined assumptions for mortality rates that are based upon industry and our historical experience modified to allow for variations in policy features and experience anomalies • Actuarially determined assumptions for lapse rates that are based upon industry and our historical experience modified to allow for variations in policy features and experience anomalies • Investment returns, based on stochastically generated scenarios • Asset returns that include a reversion to the mean methodology, similar to that applied for DAC In applying separate account asset growth assumptions for the variable annuity GMDB liability, we use a reversion to the mean methodology, the same as that applied to DAC. For the fixed index annuity GMWB liability, policyholder funds are projected assuming growth equal to current option values for the current crediting period followed by option budgets for all subsequent crediting periods. For the fixed annuity liability, policyholder fund growth projected assuming credited rates are expected to be maintained at a target pricing spread, subject to guaranteed minimums. | |
Variable Annuity and certain Fixed Index Annuity GMWB | GMWB living benefits on variable annuities and GMWB living benefits linked to equity indices on fixed index annuities are embedded derivatives that are required to be bifurcated from the host contract and carried at fair value with changes in the fair value of the liabilities recorded in realized gains (losses). The fair value of these embedded derivatives is based on assumptions that a market participant would use in valuing these embedded derivatives. For additional information on how we reserve for variable and fixed index annuity products with guaranteed benefit features see Note 13 to the Consolidated Financial Statements, and for information on fair value measurement of these embedded derivatives, including how we incorporate our own non-performance risk see Note 4 to the Consolidated Financial Statements. |
| The fair value of the embedded derivatives, which are Level 3 liabilities, is based on a risk-neutral framework and incorporates actuarial and capital market assumptions related to projected cash flows over the expected lives of the contracts. Key assumptions include: • Interest rates • Equity market returns • Market volatility • Credit spreads • Equity / interest rate correlation • Policyholder behavior, including mortality, lapses, withdrawals and benefit utilization. Estimates of future policyholder behavior are subjective and based primarily on our historical experience • In applying asset growth assumptions for the valuation of GMWBs, we use market-consistent assumptions calibrated to observable interest rate and equity option prices • Allocation of fees between the embedded derivative and host contract |
AIG | 2021 Form 10-K 69
embedded derivatives for fixed index annuity and Life Products
Fixed index annuity and life products provide growth potential based in part on the performance of a market index. Certain fixed index annuity products offer optional guaranteed benefit features similar to those offered on variable annuity products. Policyholders may elect to rebalance among the various accounts within the product at specified renewal dates. At the end of each index term, we generally have the opportunity to re-price the indexed component by establishing different participation rates or caps on equity indexed credited rates. The index crediting feature of these products results in the recognition of an embedded derivative that is required to be bifurcated from the host contract and carried at fair value with changes in the fair value of the liabilities recorded in Net realized gains (losses). Option pricing models are used to estimate fair value, taking into account assumptions for future equity index growth rates, volatility of the equity index, future interest rates, and our ability to adjust the participation rate and the cap on equity indexed credited rates in light of market conditions and policyholder behavior assumptions.
For additional information on market risk management related to these product features see Enterprise Risk Management – Insurance Risks – Life and Retirement Companies’ Key Risks – Variable Annuity, Index Annuity and Universal Life Risk Management and Hedging Programs.
ESTIMATED GROSS PROFITS TO VALUE DEFERRED ACQUISITION COSTS AND UNEARNED REVENUE for Investment–Oriented Products
Policy acquisition costs and policy issuance costs that are incremental and directly related to the successful acquisition of new or renewal of existing insurance contracts related to universal life insurance and investment-type products, for example, variable, fixed and fixed index annuities, (collectively, investment-oriented products) are generally deferred and amortized, with interest, in relation to the incidence of estimated gross profits to be realized over the expected lives of the contracts, except in instances where significant negative gross profits are expected in one or more periods. Investment oriented products have a long duration and a disclosed crediting interest rate. Total gross profits include both actual gross profits and estimates of gross profits for future periods. Estimated gross profits include current and projected interest rates, net investment income and spreads, net realized gains and losses, fees, surrender rates, mortality experience and equity market returns and volatility. In estimating future gross profits, lapse assumptions require judgment and can have a material impact on DAC amortization. For fixed index annuity contracts, the future spread between investment income and interest credited to policyholders is a significant judgment, particularly in a low interest rate environment. We regularly evaluate our assumptions used for estimated gross profits. If the assumptions used for estimated gross profits change, DAC and related reserves, including VOBA, DSI, guaranteed benefit reserves and unearned revenue reserve (URR), are recalculated using the new assumptions, and any resulting adjustment is included in income. Updating such assumptions may result in acceleration of amortization in some products and deceleration of amortization in other products.
In estimating future gross profits for variable annuity products as of December 31, 2021, a long-term annual asset growth assumption of 7.0 percent (before expenses that reduce the asset base from which future fees are projected) was applied to estimate the future growth in assets and related asset-based fees. In determining the asset growth rate, the effect of short-term fluctuations in the equity markets is partially mitigated through the use of a reversion to the mean methodology, whereby short-term asset growth above or below the long-term annual rate assumption impacts the growth assumption applied to the five-year period subsequent to the current balance sheet date. The reversion to the mean methodology allows us to maintain our long-term growth assumptions, while also giving consideration to the effect of actual investment performance. When actual performance significantly deviates from the annual long-term growth assumption, as evidenced by growth assumptions for the five-year reversion to the mean period falling below a certain rate (floor) or above a certain rate (cap) for a sustained period, judgment may be applied to revise or “unlock” the growth rate assumptions to be used for both the five-year reversion to the mean period as well as the long-term annual growth assumption applied to subsequent periods.
For additional information, see Insurance Reserves – Life and Annuity Future Policy Benefits, Policyholder Contract Deposits and DAC – DAC – Reversion to the Mean.
70 AIG | 2021 Form 10-K
The following table summarizes the sensitivity of changes in certain assumptions for DAC and DSI, embedded derivatives and other reserves related to guaranteed benefits and URR, measured as the related hypothetical impact on December 31, 2021 balances and the resulting hypothetical impact on pre-tax income, before hedging.
| Increase (decrease) in | |||||||||
|
|
|
| Other |
|
|
| Embedded |
|
|
|
|
|
| Reserves |
|
|
| Derivatives |
|
|
|
|
|
| Related to |
| Unearned |
| Related to |
|
|
December 31, 2021 |
| DAC/DSI |
| Guaranteed |
| Revenue |
| Guaranteed |
| Pre-Tax |
(in millions) |
| Asset |
| Benefits |
| Reserve |
| Benefits |
| Income |
Assumptions: |
|
|
|
|
|
|
|
|
|
|
Net Investment Spread |
|
|
|
|
|
|
|
|
|
|
Effect of an increase by 10 basis points | $ | 140 | $ | (49) | $ | (6) | $ | (154) | $ | 349 |
Effect of a decrease by 10 basis points |
| (150) |
| 49 |
| 1 |
| 158 |
| (358) |
Equity Return(a) |
|
|
|
|
|
|
|
|
|
|
Effect of an increase by 1% |
| 109 |
| (29) |
| - |
| (60) |
| 198 |
Effect of a decrease by 1% |
| (105) |
| 37 |
| - |
| 62 |
| (204) |
Volatility(b) |
|
|
|
|
|
|
|
|
|
|
Effect of an increase by 1% |
| (3) |
| 25 |
| - |
| (32) |
| 4 |
Effect of a decrease by 1% |
| 3 |
| (24) |
| - |
| 37 |
| (10) |
Interest Rate(c) |
|
|
|
|
|
|
|
|
|
|
Effect of an increase by 1% |
| - |
| - |
| - |
| (2,550) |
| 2,550 |
Effect of a decrease by 1% |
| - |
| - |
| - |
| 3,407 |
| (3,407) |
Mortality |
|
|
|
|
|
|
|
|
|
|
Effect of an increase by 1% |
| (10) |
| 41 |
| - |
| (54) |
| 3 |
Effect of a decrease by 1% |
| 10 |
| (41) |
| (1) |
| 54 |
| (2) |
Lapse |
|
|
|
|
|
|
|
|
|
|
Effect of an increase by 10% |
| (123) |
| (105) |
| (28) |
| (94) |
| 104 |
Effect of a decrease by 10% |
| 126 |
| 109 |
| 24 |
| 97 |
| (104) |
(a) Represents the net impact of a one percent increase or decrease in long-term equity returns for GMDB reserves and net impact of a one percent increase or decrease in the S&P 500 index on the value of the GMWB embedded derivative.
(b) Represents the net impact of a one percentage point increase or decrease in equity volatility.
(c) Represents the net impact of one percent parallel shift in the yield curve on the value of the GMWB embedded derivative. Does not represent interest rate spread compression on investment-oriented products.
The sensitivity ranges of 10 basis points, one percent and 10 percent are included for illustrative purposes only and do not reflect the changes in net investment spreads, equity return, volatility, interest rate, mortality or lapse used by AIG in its fair value analyses or estimates of future gross profits to value DAC and related reserves. Changes different from those illustrated may occur in any period and may result from different products.
The analysis of DAC, embedded derivatives and other reserves related to guaranteed benefits, and unearned revenue reserve is a dynamic process that considers all relevant factors and assumptions described above. We estimate each of the above factors individually, without the effect of any correlation among the key assumptions. An assessment of sensitivity associated with changes in any single assumption would not necessarily be an indicator of future results. The effects on pre-tax income in the sensitivity analysis table above do not reflect the related effects from our economic hedging program, which utilizes derivative and other financial instruments and is designed so that changes in value of those instruments move in the opposite direction of changes in the guaranteed benefit embedded derivative liabilities.
For additional information on guaranteed benefit features of our variable annuities and the related hedging program see Enterprise Risk Management – Insurance Risks – Life and Retirement Companies’ Key Risks – Variable Annuity, Index Annuity and Universal Life Risk Management and Hedging Programs, Insurance Reserves – Life and Annuity Future Policy Benefits, Policyholder Contract Deposits and DAC – Variable Annuity Guaranteed Benefits and Hedging Results, and Notes 4, 8 and 13 to the Consolidated Financial Statements.
For additional information on actuarial assumption updates see Insurance Reserves – Life and Annuity Future Policy Benefits, Policyholder Contract Deposits and DAC – Update of Actuarial Assumptions and Models – Investment-Oriented Products.
AIG | 2021 Form 10-K 71
Reinsurance ASSETS
In the ordinary course of business, our insurance companies may use both treaty and facultative reinsurance to minimize their net loss exposure to any single catastrophic loss event or to an accumulation of losses from a number of smaller events or to provide greater diversification of our businesses. Reinsurance assets include the balances due from reinsurance and insurance companies under the terms of our reinsurance agreements for paid and unpaid losses and loss adjustment expenses incurred, ceded unearned premiums and ceded future policy benefits for life and accident and health insurance contracts and benefits paid and unpaid.
The estimation of reinsurance recoverables involves a significant amount of judgment, particularly for latent exposures, such as asbestos, due to their long-tail nature. Reinsurance assets include reinsurance recoverables on unpaid losses and loss adjustment expenses that are estimated as part of our loss reserving process and, consequently, are subject to similar judgments and uncertainties as the estimation of gross loss reserves. Similarly, Other assets include reinsurance recoverables for contracts which are accounted for as deposits.
We assess the collectability of reinsurance recoverable balances in each reporting period, through either historical trends of disputes and credit events or financial analysis of the credit quality of the reinsurer. We record adjustments to reflect the results of these assessments through an allowance for credit losses and disputes that reduces the carrying amount of reinsurance and other assets on the consolidated balance sheets (collectively, reinsurance recoverables). This estimate requires significant judgment for which key considerations include:
paid and unpaid amounts recoverable;
whether the balance is in dispute or subject to legal collection;
the relative financial health of the reinsurer as determined by the Obligor Risk Ratings (ORRs) we assign to each reinsurer based upon our financial reviews; reinsurers that are financially troubled (i.e., in run-off, have voluntarily or involuntarily been placed in receivership, are insolvent, are in the process of liquidation or otherwise subject to formal or informal regulatory restriction) are assigned ORRs that will generate a significant allowance; and
whether collateral and collateral arrangements exist.
An estimate of the reinsurance recoverables lifetime expected credit losses is established utilizing a probability of default and loss given default method, which reflects the reinsurer’s ORR rating. The allowance for credit losses excludes disputed amounts. An allowance for disputes is established for a reinsurance recoverable using the losses incurred model for contingencies.
For additional information on reinsurance see Note 7 to the Consolidated Financial Statements.
GOODWILL Impairment
Goodwill represents the future economic benefits arising from assets acquired in a business combination that are not individually identified and separately recognized. Goodwill is tested for impairment annually, or more frequently if circumstances indicate an impairment may have occurred. A qualitative assessment may be performed, considering whether events or circumstances exist that lead to a determination that it is not more likely than not that the fair value of an operating segment is less than its carrying value. If management elects to perform a quantitative assessment to determine recoverability of carrying value or is compelled to do so based on the results of a qualitative assessment, the estimate of fair value involves applying one or a combination of common valuation approaches. These include discounted expected future cash flows, market-based earnings multiples and external appraisals, among other methods, all of which require management judgment and are subject to uncertainty, primarily as it relates to assumptions around business growth, earnings projections, and cost of capital.
For additional information on goodwill impairment see Part I, Item 1A. Risk Factors – Estimates and Assumptions and Note 11 to the Consolidated Financial Statements.
72 AIG | 2021 Form 10-K
allowance for credit losses ON CERTAIN INVESTMENTS
We maintain an allowance for the expected lifetime credit losses of commercial and residential mortgage loans and available for sale securities. The sufficiency of this allowance is reviewed quarterly using both quantitative and qualitative considerations, which are subject to risks and uncertainties.
Available for sale securities
If we intend to sell a fixed maturity security, or it is more likely than not that we will be required to sell a fixed maturity security before recovery of its amortized cost basis and the fair value of the security is below amortized cost, an impairment has occurred and the amortized cost is written down to current fair value, with a corresponding charge to realized losses. No allowance is established in these situations and any previously recorded allowance is reversed. When assessing our intent to sell a fixed maturity security, or whether it is more likely than not that we will be required to sell a fixed maturity security before recovery of its amortized cost basis, management evaluates relevant facts and circumstances including, but not limited to, decisions to reposition our investment portfolio, sales of securities to meet cash flow needs and sales of securities to take advantage of favorable pricing.
For fixed maturity securities for which a decline in the fair value below the amortized cost is due to credit related factors, an allowance is established for the difference between the estimated recoverable value and amortized cost with a corresponding charge to realized losses. The allowance for credit losses is limited to the difference between amortized cost and fair value. The estimated recoverable value is the present value of cash flows expected to be collected, as determined by management. The difference between fair value and amortized cost that is not associated with credit related factors is presented in unrealized appreciation (depreciation) of fixed maturity securities on which an allowance for credit losses was previously recognized (a separate component of accumulated other comprehensive income).
Commercial and residential mortgage loans
At the time of origination or purchase, an allowance for credit losses is established for mortgage and other loan receivables and is updated each reporting period. Changes in the allowance for credit losses are recorded in realized losses. This allowance reflects the risk of loss, even when that risk is remote, that is expected over the remaining contractual life of the loan. The allowance for credit losses considers available relevant information about the collectability of cash flows, including information about past events, current conditions, and reasonable and supportable forecasts of future economic conditions. We revert to historical information when we determine that we can no longer reliably forecast future economic assumptions.
The allowances for the commercial mortgage loans and residential mortgage loans are estimated utilizing a probability of default and loss given default model. Loss rate factors are determined based on historical data and adjusted for current and forecasted information. The loss rates are applied based on individual loan attributes and considering such data points as loan-to-value ratios, Fair Isaac Corporation (FICO) scores, and debt service coverage.
The estimate of credit losses also reflects management’s assumptions on certain macroeconomic factors that include, but are not limited to, gross domestic product growth, employment, inflation, housing price index, interest rates and credit spreads.
For additional information on the methodology and significant inputs, by investment type, that we use to determine the amount of impairment and allowances for loan losses see the discussion in Notes 5 and 6 to the Consolidated Financial Statements.
Legal Contingencies
We estimate and record a liability for potential losses that may arise from regulatory and government investigations and actions, litigation and other forms of dispute resolution to the extent such losses are probable and can be estimated. Determining a reasonable estimate of the amount of such losses requires significant management judgment. In many cases, it is not possible to determine whether a liability has been incurred or to estimate the ultimate or minimum amount of that liability until the matter is close to resolution. In view of the inherent difficulty of predicting the outcome of such matters, particularly in cases that are in the early stages of litigation or in which claimants seek substantial or indeterminate damages, we often cannot predict the outcome or estimate the eventual loss or range of reasonably possible losses related to such matters. Given the inherent unpredictability of such matters, the outcome of certain matters could, from time to time, have a material adverse effect on the company’s consolidated financial condition, results of operations or cash flows.
For additional information on legal, regulatory and litigation matters see Note 15 to the Consolidated Financial Statements.
AIG | 2021 Form 10-K 73
Fair Value Measurements of Certain Financial Assets and FINANCIAL Liabilities
Assets and liabilities recorded at fair value in the Consolidated Balance Sheets are measured and classified in a hierarchy for disclosure purposes consisting of three levels based on the observability of inputs available in the marketplace used to measure the fair value. We classify fair value measurements for certain assets and liabilities as Level 3 when they require significant unobservable inputs in their valuation. We consider unobservable inputs to be those for which market data is not available. Our assessment of the significance of a particular input to the fair value measurement of an asset or liability requires judgment.
For additional information about the valuation methodologies of financial instruments measured at fair value see Note 4 to the Consolidated Financial Statements.
Income Taxes
Deferred income taxes represent the tax effect of the differences between the amounts recorded in our Consolidated Financial Statements and the tax basis of assets and liabilities. Our assessment of net deferred income taxes represents management’s best estimate of the tax consequences of various events and transactions, which can themselves be based on other accounting estimates, resulting in incremental uncertainty in the estimation process.
Deferred Tax Asset Recoverability
The evaluation of the recoverability of our deferred tax asset and the need for a valuation allowance requires us to weigh all positive and negative evidence to reach a conclusion that it is more likely than not that all or some portion of the deferred tax asset will not be realized. The weight given to the evidence is commensurate with the extent to which it can be objectively verified. As such, changes in tax laws in countries where we transact business can impact our deferred tax asset valuation allowance. We consider multiple factors to reliably estimate future taxable income so we can determine the extent of our ability to realize net operating losses, foreign tax credits, realized capital loss and other carryforwards. These factors include forecasts of future income for each of our businesses, which incorporate forecasts of future statutory income for our insurance companies, and actual and planned business and operational changes, both of which include assumptions about future macroeconomic and AIG-specific conditions and events. We subject the forecasts to stresses of key assumptions and evaluate the effect on tax attribute utilization. We also apply stresses to our assumptions about the effectiveness of relevant prudent and feasible tax planning strategies. In performing our assessment of recoverability, we consider tax laws governing the utilization of net operating loss, capital loss and foreign tax credit carryforwards in each applicable jurisdiction. These tax laws are subject to change, resulting in incremental uncertainty in our assessment of recoverability.
Uncertain Tax Positions
Uncertain tax positions represent AIG’s liability for income taxes on tax years subject to review by the Internal Revenue Service or other tax authorities. We determine whether it is more likely than not that a tax position will be sustained, based on technical merits, upon examination by the relevant taxing authorities before any part of the benefit can be recognized in the financial statements. A tax position is measured at the largest amount of benefit that is greater than 50 percent likely to be realized upon settlement. The completion of review, or the expiration of federal statute of limitations for a given audit period could result in an adjustment to the liability for income taxes.
For a discussion of our framework for assessing the recoverability of our deferred tax asset and other tax topics see Note 21 to the Consolidated Financial Statements.
OTHER UNCERTAINTIES
For a discussion of other risks and uncertainties that could impact the Company’s results of operations or financial position, see Part I, Item 1A. Risk Factors and Note 15 to the Consolidated Financial Statements.
74 AIG | 2021 Form 10-K
Executive Summary
Overview
This overview of the MD&A highlights selected information and may not contain all of the information that is important to current or potential investors in our securities. You should read this Annual Report in its entirety for a more detailed description of events, trends, uncertainties, risks and critical accounting estimates affecting us.
Separation of Life and Retirement Business and Relationship with Blackstone Inc.
On October 26, 2020, AIG announced its intention to separate its Life and Retirement business from AIG. On November 2, 2021, AIG and Blackstone Inc. (Blackstone) completed the acquisition by Blackstone of a 9.9 percent equity stake in SAFG Retirement Services, Inc. (SAFG), which is the holding company for AIG’s Life and Retirement business, for $2.2 billion in an all cash transaction, subject to adjustment if the final pro forma adjusted book value is greater or lesser than the target pro forma adjusted book value. This resulted in a $629 million decrease to AIG’s shareholders’ equity. As part of the separation, most of AIG’s investment operations were transferred to SAFG or its subsidiaries as of December 31, 2021, and AIG entered into a long-term asset management relationship with Blackstone to manage an initial $50 billion of Life and Retirement’s existing investment portfolio beginning in the fourth quarter of 2021, with that amount increasing by increments of $8.5 billion per year for five years beginning in the fourth quarter of 2022, for an aggregate of $92.5 billion. In addition, Blackstone designated one member of the Board of Directors of SAFG, which consists of 11 directors. Pursuant to the definitive agreement, Blackstone will be required to hold its ownership interest in SAFG following the completion of the separation of the Life and Retirement business, subject to exceptions permitting Blackstone to sell 25%, 67% and 75% of its shares after the first, second and third anniversaries, respectively, of the initial public offering of SAFG (the IPO), with the transfer restrictions terminating in full on the fifth anniversary of the IPO. In the event that the IPO of SAFG is not completed prior to November 2, 2023, Blackstone will have the right to require AIG to undertake the IPO, and in the event that the IPO has not been completed prior to November 2, 2024, Blackstone will have the right to exchange all or a portion of its ownership interest in SAFG for shares of AIG’s common stock on the terms set forth in the definitive agreement. On November 1, 2021, SAFG declared a dividend payable to AIG Parent in the amount of $8.3 billion. In connection with such dividend, SAFG issued a promissory note to AIG Parent in the amount of $8.3 billion, which will be required to be paid to AIG Parent prior to the IPO of SAFG. As of February 16, 2022, no amounts have been paid under the promissory note. While we currently believe the IPO is the next step in the separation of the Life and Retirement business from AIG, no assurance can be given regarding the form that future separation transactions may take or the specific terms or timing thereof, or that a separation will in fact occur. Any separation transaction will be subject to the satisfaction of various conditions and approvals, including approval by the AIG Board of Directors, receipt of insurance and other required regulatory approvals, and satisfaction of any applicable requirements of the SEC.
For additional information on the sale of SAFG to Blackstone see Note 16 to the Consolidated Financial Statements.
On December 15, 2021, AIG and Blackstone Real Estate Income Trust (BREIT), a long-term, perpetual capital vehicle affiliated with Blackstone, completed the acquisition by BREIT of AIG’s interests in a U.S. affordable housing portfolio for $4.9 billion, in an all cash transaction, resulting in a pre-tax gain of $3.0 billion. The historical results of the U.S. affordable housing portfolio were reported in our Life and Retirement operating segments.
Debt Cash Tender Offers and Redemptions
In 2021, we repurchased, through cash tender offers, and redeemed $4.0 billion aggregate principal amount of certain notes and debentures issued or guaranteed by AIG, for an aggregate purchase price of $4.4 billion, resulting in a total loss on extinguishment of debt of $408 million.
Sale of Certain AIG Life and Retirement Retail Mutual Funds Business
On February 8, 2021, AIG announced the execution of a definitive agreement with Touchstone Investments (Touchstone), an indirect wholly-owned subsidiary of Western & Southern Financial Group, to sell certain assets of Life and Retirement’s Retail Mutual Funds business. This sale consisted of the reorganization of twelve of the retail mutual funds managed by SunAmerica Asset Management, LLC (SAAMCo), a Life and Retirement entity, into certain Touchstone funds and was subject to certain conditions, including approval of the fund reorganizations by the retail mutual fund boards of directors/trustees and fund shareholders. The transaction closed on July 16, 2021, at which time we received initial proceeds and the twelve retail mutual funds managed by SAAMCo, with $6.8 billion in assets, were reorganized into Touchstone funds. Additional consideration may be earned over a three-year period based on asset levels in certain reorganized funds. Six retail mutual funds managed by SAAMCo and not included in the transaction were liquidated. We will retain our fund management platform and capabilities dedicated to our variable annuity insurance products.
AIG | 2021 Form 10-K 75
Sale of Fortitude Holdings
On June 2, 2020, we completed the sale of a majority of the interests in Fortitude Group Holdings, LLC (Fortitude Holdings) to Carlyle FRL, L.P. (Carlyle FRL), an investment fund advised by an affiliate of The Carlyle Group Inc. (Carlyle), and T&D United Capital Co., Ltd. (T&D), a subsidiary of T&D Holdings, Inc., under the terms of a membership interest purchase agreement entered into on November 25, 2019 (the Purchase Agreement) by and among AIG, Fortitude Holdings, Carlyle FRL, Carlyle, T&D and T&D Holdings, Inc. (the Majority Interest Fortitude Sale). AIG established Fortitude Re, a wholly owned subsidiary of Fortitude Holdings, in 2018 in a series of reinsurance transactions related to AIG’s Run-Off operations. As of December 31, 2021, approximately $29.6 billion of reserves from AIG’s Life and Retirement Run-Off Lines and approximately $3.8 billion of reserves from AIG’s General Insurance Run-Off Lines, related to business written by multiple wholly-owned AIG subsidiaries, had been ceded to Fortitude Re under these reinsurance transactions. As of closing of the Majority Interest Fortitude Sale, these reinsurance transactions are no longer considered affiliated transactions and Fortitude Re is the reinsurer of the majority of AIG’s Run-Off operations. As these reinsurance transactions are structured as modified coinsurance and loss portfolio transfers with funds withheld, following the closing of the Majority Interest Fortitude Sale, AIG continues to reflect the invested assets, which consist mostly of available for sale securities, supporting Fortitude Re’s obligations, in AIG’s financial statements.
AIG sold a 19.9 percent ownership interest in Fortitude Holdings to TC Group Cayman Investments Holdings, L.P., an affiliate of Carlyle, in November 2018. As a result of completion of the Majority Interest Fortitude Sale, Carlyle FRL purchased from AIG a 51.6 percent ownership interest in Fortitude Holdings and T&D purchased from AIG a 25 percent ownership interest in Fortitude Holdings; AIG retained a 3.5 percent ownership interest in Fortitude Holdings and one seat on its Board of Managers. The $2.2 billion of proceeds received by AIG at closing included (i) the $1.8 billion under the Majority Interest Fortitude Sale, subject to a post-closing purchase price adjustment pursuant to which AIG would pay Fortitude Re for certain adverse development in property casualty related reserves, based on an agreed methodology, that may occur through December 31, 2023, up to a maximum payment of $500 million; and (ii) a $383 million purchase price adjustment from Carlyle FRL and T&D, corresponding to their respective portions of a proposed $500 million non-pro rata distribution from Fortitude Holdings that was not received by AIG prior to the closing. Effective in the second quarter of 2021, AIG, Fortitude Holdings, Carlyle FRL, T&D and Carlyle amended the Purchase Agreement to finalize the post-closing purchase price adjustment for adverse reserve development. As a result of this amendment, during 2021, AIG recorded a $21 million benefit through Policyholder benefits and losses incurred and eliminated further net exposure to adverse development on the reserves ceded to Fortitude Re.
For additional information on the sale of Fortitude Holdings see Note 7 to the Consolidated Financial Statements.
76 AIG | 2021 Form 10-K
Financial Performance Summary
For information regarding AIG’s results of operations for the year ended December 31, 2020 compared with the year ended December 31, 2019 see Part II, Item 7. MD&A – Executive Summary – Financial Performance Summary of our Annual Report on Form 10-K for the year ended December 31, 2020 (2020 Annual Report).
Net Income (Loss) Attributable To AIG Common Shareholders (in millions) | |
| 2021 and 2020 Comparison Net income attributable to AIG common shareholders increased $15.3 billion due to the following, on a pre-tax basis: the recognition of a $3.0 billion gain on the closing of the sale of the Affordable Housing portfolio in 2021 and a $102 million gain from the sale of certain assets of the Retail Mutual Funds business to Touchstone in 2021, compared to an $8.3 billion loss on the closing of the Majority Interest Fortitude Sale in 2020; net realized gain on Fortitude Re funds withheld embedded derivative increased ($2.0 billion) compared to a loss in 2020 and higher net realized gains on Fortitude Re funds withheld assets ($540 million); higher net realized gains excluding Fortitude Re funds withheld assets and embedded derivatives of $1.8 billion, driven by a $1.1 billion increase in gains on global real estate and other assets, a $646 million increase on derivative and hedge activity partially offset by losses on variable annuity embedded derivatives, net of hedging, as well as favorable movement in the allowance for credit losses on fixed maturity securities and loans ($557 million), partially offset by losses on foreign exchange ($349 million); higher underwriting income in General Insurance ($2.1 billion) from higher net premium marked by strong rate improvement, higher renewal retentions and strong new business growth, with continued attritional loss ratio improvement as well as lower catastrophe losses, net of reinstatement premiums ($1.1 billion) and improved prior year reserve development ($125 million); $981 million higher net investment income, or $63 million excluding Fortitude Re funds withheld assets, with higher returns in our investment portfolio primarily due to alternative investments, an increase which was driven by positive returns achieved in equity markets, partially offset by declines in fair value of equity securities; and prior period having included the results of Fortitude Re, a loss of $233 million, up through the Majority Interest Fortitude Sale on June 2, 2020. The $3.6 billion increase in income tax expense was primarily attributable to higher income from continuing operations and $1.7 billion attributable to the tax benefit on the deconsolidation of Fortitude Holdings in 2020. For additional information see Consolidated Results of Operations. |
AIG | 2021 Form 10-K 77
Adjusted Pre-Tax Income (Loss)* (in millions) | |
| 2021 and 2020 Comparison Adjusted pre-tax income increased $2.9 billion primarily due to: higher underwriting income in General Insurance ($2.1 billion) from higher net premium marked by strong rate improvement, higher renewal retentions and strong new business growth, with continued attritional loss ratio improvement as well as lower catastrophe losses, net of reinstatement premiums ($1.1 billion) and improved prior year development ($125 million); and higher net investment income ($619 million), driven by returns in alternative investments. |
* Non-GAAP measure – for reconciliation of non-GAAP to GAAP measures see Consolidated Results of Operations.
General Operating and Other Expenses (in millions) | |
| General operating and other expenses increased $394 million in 2021 compared to 2020 primarily due to increases in professional fees inclusive of transaction costs, performance-based employee costs and other acquisition expenses. General operating and other expenses for 2021 and 2020 included approximately $433 million and $435 million, respectively, of pre-tax restructuring and other costs which were primarily comprised of employee severance charges and other costs related to organizational simplification, operational efficiency, and business rationalization. |
78 AIG | 2021 Form 10-K
AIG’s Outlook – Industry and economic factors
Our business is affected by industry and economic factors such as interest rates, currency exchange rates, credit and equity market conditions, catastrophic claims events, regulation, tax policy, competition, and general economic, market and political conditions. We continued to operate under challenging market conditions in 2021, characterized by factors such as the impact of COVID-19 and the related governmental and societal responses, interest rate volatility, inflationary pressures, an uneven global economic recovery and global trade tensions. Responses by central banks and monetary authorities with respect to inflation, growth concerns and other macroeconomic factors have also affected global exchange rates and volatility.
Impact of COVID-19
We are continually assessing the impact on our business, operations and investments of COVID-19 and the resulting ongoing economic and societal disruption. These impacts initially included a global economic contraction, disruptions in financial markets, increased market volatility and declines in certain equity and other asset prices that had negative effects on our investments, our access to liquidity, our ability to generate new sales and the costs associated with claims. While global financial markets recovered in 2021, there remains a risk that the disruptions previously experienced could return and new ones emerge as COVID-19 persists or new variants continue to arise. In addition, in response to the pandemic, new governmental, legislative and regulatory actions have been taken and continue to be developed that have resulted and could continue to result in additional restrictions and requirements, or court decisions rendered, relating to or otherwise affecting our policies that may have a negative impact on our business, operations and capital.
General Insurance offers numerous products for which we are monitoring claims activity and assessing adverse impact on future new and renewal business in relation to the COVID-19 pandemic. We are continually reassessing our exposures in light of unfolding developments in the U.S. and globally and evaluating coverage by our reinsurance arrangements.
In our Life and Retirement business, the most significant impacts relating to COVID-19 have been the impact of interest rate and equity market levels on spread and fee income, deferred acquisition cost amortization and adverse mortality. We are actively monitoring the mortality rates and the potential direct and indirect impacts that COVID-19 may have across our portfolio of Life and Retirement businesses.
We have a diverse investment portfolio with material exposures to various forms of credit risk. The far-reaching economic impacts of COVID-19 have been largely offset, to date, by intervention taken by governments and monetary authorities and equity market rebound resulting in a minimal impact on the value of the portfolio. At this point in time, uncertainty surrounding the duration and severity of the COVID-19 pandemic makes the long-term financial impact difficult to quantify.
For additional information please see Part I, Item 1A. Risk Factors – Market Conditions – COVID-19 has adversely affected, and is expected to continue to adversely affect, our global business, results of operations, financial condition and liquidity and its ultimate impact will depend on future developments that are uncertain and cannot be predicted.
Impact of Changes in the Interest Rate Environment
Key U.S. benchmark rates have been volatile in 2021 as investors form opinions over elevated inflation measures. While key rates have recently increased, they are still historically low. The low interest rate environment negatively affects sales of interest rate sensitive products in our industry and negatively impacts the profitability of our existing business as we reinvest cash flows from investments, including increased calls and prepayments of fixed maturity securities and mortgage loans, at rates below the average yield of our existing portfolios. We actively manage our exposure to the interest rate environment through portfolio selection and asset-liability management, including spread management strategies for our investment-oriented products and economic hedging of interest rate risk from guarantee features in our variable and fixed index annuities. We may not be able to fully mitigate our interest rate risk by matching exposure of our assets relative to our liabilities. A low interest rate environment could also impair our ability to earn the returns assumed in the pricing and the reserving of our products at the time they were sold and issued.
Additionally, sustained low interest rates may result in higher pension expense due to the impact on discounting of projected benefit cash flows.
AIG | 2021 Form 10-K 79
Annuity Sales and Surrenders
The sustained low interest rate environment has a significant impact on the annuity industry. Low long-term interest rates put pressure on investment returns, which may negatively affect sales of interest rate sensitive products and reduce future profits on certain existing fixed rate products. However, our disciplined pricing has helped to mitigate some of the pressure on investment spreads. Rapidly rising interest rates could create the potential for increased sales, but may also drive higher surrenders. Fixed annuities have surrender charge periods, generally in the three-to-seven year range, and within our Group Retirement segment, certain of our fixed investment options are subject to other withdrawal restrictions, which may help mitigate increased early surrenders in a rising rate environment. In addition, older contracts that have higher minimum interest rates and continue to be attractive to contract holders have driven better than expected persistency in fixed annuities, although the reserves for such contracts have continued to decrease over time in amount and as a percentage of the total annuity portfolio. We closely monitor surrenders of fixed annuities as contracts with lower minimum interest rates come out of the surrender charge period. Changes in interest rates significantly impact the valuation of our liabilities for annuities with guaranteed living benefit features and the value of the related hedging portfolio.
Reinvestment and Spread Management
We actively monitor fixed income markets, including the level of interest rates, credit spreads and the shape of the yield curve. We also frequently review our interest rate assumptions and actively manage the crediting rates used for new and in-force business. Business strategies continue to evolve to maintain profitability of the overall business in light of the interest rate environment. A low interest rate environment puts margin pressure on pricing of new business and on existing products, due to the challenge of investing new money or recurring premiums and deposits, and reinvesting investment portfolio cash flows, in the low interest rate environment. In addition, there is investment risk associated with future premium receipts from certain in-force business. Specifically, the investment of these future premium receipts may be at a yield below that required to meet future policy liabilities.
The contractual provisions for renewal of crediting rates and guaranteed minimum crediting rates included in our products has reduced spreads in a sustained low interest rate environment and thus reduces future profitability.
For additional information on our investment and asset-liability management strategies see Investments.
For investment-oriented products, including universal life insurance, and variable, fixed and fixed index annuities, in our Individual Retirement, Group Retirement, Life Insurance and Institutional Markets businesses, our spread management strategies include disciplined pricing and product design for new business, modifying or limiting the sale of products that do not achieve targeted spreads, using asset-liability management to match assets to liabilities to the extent practicable, and actively managing crediting rates to help mitigate some of the pressure on investment spreads. Renewal crediting rate management is done under contractual provisions that were designed to allow crediting rates to be reset at pre-established intervals in accordance with state and federal laws and subject to minimum crediting rate guarantees. We expect to continue to adjust crediting rates on in-force business to mitigate the pressure on spreads from declining base yields, but our ability to lower crediting rates may be limited by the competitive environment, contractual minimum crediting rates, and provisions that allow rates to be reset only at pre-established intervals. If and as interest rates rise, we may need to raise crediting rates on in-force business for competitive and other reasons, potentially offsetting a portion of the additional investment income resulting from investing in a higher interest rate environment.
Of the aggregate fixed account values of our Individual Retirement and Group Retirement annuity products, 68 percent were crediting at the contractual minimum guaranteed interest rate at December 31, 2021. The percentage of fixed account values of our annuity products that are currently crediting at rates above one percent were 58 percent and 59 percent at December 31, 2021 and December 31, 2020, respectively. These businesses continue to focus on pricing discipline and strategies to manage the minimum guaranteed interest crediting rates offered on new sales in the context of regulatory requirements and competitive positioning. In the universal life products in our Life Insurance business, 67 percent of the account values were crediting at the contractual minimum guaranteed interest rate at December 31, 2021.
80 AIG | 2021 Form 10-K
The following table presents fixed annuity and universal life account values of our Individual Retirement, Group Retirement and Life Insurance operating segments by contractual minimum guaranteed interest rate and current crediting rates, excluding balances ceded to Fortitude Re:
| Current Crediting Rates | ||||||||
December 31, 2021 |
|
| 1-50 Basis | More than 50 |
|
|
| ||
Contractual Minimum Guaranteed | At Contractual | Points Above | Basis Points |
|
|
| |||
Interest Rate | Minimum | Minimum | Above Minimum |
|
|
| |||
(in millions) | Guarantee | Guarantee | Guarantee |
| Total |
| |||
Individual Retirement* |
|
|
|
|
|
|
|
|
|
<=1% | $ | 10,212 | $ | 1,911 | $ | 17,936 | $ | 30,059 |
|
> 1% - 2% |
| 4,540 |
| 28 |
| 1,681 |
| 6,249 |
|
> 2% - 3% |
| 10,353 |
| - |
| 18 |
| 10,371 |
|
> 3% - 4% |
| 8,151 |
| 41 |
| 6 |
| 8,198 |
|
> 4% - 5% |
| 477 |
| - |
| 5 |
| 482 |
|
> 5% - 5.5% |
| 34 |
| - |
| 4 |
| 38 |
|
Total Individual Retirement | $ | 33,767 | $ | 1,980 | $ | 19,650 | $ | 55,397 |
|
Group Retirement* |
|
|
|
|
|
|
|
|
|
<=1% | $ | 2,134 | $ | 3,254 | $ | 4,682 | $ | 10,070 |
|
> 1% - 2% |
| 6,027 |
| 644 |
| 99 |
| 6,770 |
|
> 2% - 3% |
| 14,699 |
| - |
| - |
| 14,699 |
|
> 3% - 4% |
| 708 |
| - |
| - |
| 708 |
|
> 4% - 5% |
| 6,962 |
| - |
| - |
| 6,962 |
|
> 5% - 5.5% |
| 159 |
| - |
| - |
| 159 |
|
Total Group Retirement | $ | 30,689 | $ | 3,898 | $ | 4,781 | $ | 39,368 |
|
Universal life insurance |
|
|
|
|
|
|
|
|
|
<=1% | $ | - | $ | - | $ | - | $ | - |
|
> 1% - 2% |
| 103 |
| 25 |
| 359 |
| 487 |
|
> 2% - 3% |
| 258 |
| 533 |
| 1,208 |
| 1,999 |
|
> 3% - 4% |
| 1,417 |
| 178 |
| 213 |
| 1,808 |
|
> 4% - 5% |
| 3,085 |
| 2 |
| - |
| 3,087 |
|
> 5% - 5.5% |
| 236 |
| - |
| - |
| 236 |
|
Total universal life insurance | $ | 5,099 | $ | 738 | $ | 1,780 | $ | 7,617 |
|
Total | $ | 69,555 | $ | 6,616 | $ | 26,211 | $ | 102,382 |
|
Percentage of total |
| 68 | % | 6 | % | 26 | % | 100 | % |
* Individual Retirement and Group Retirement amounts shown include fixed options within variable annuity products.
AIG | 2021 Form 10-K 81
General Insurance
The impact of low interest rates on our General Insurance segment reduces the benefit of investment income in our pricing. This leads to stronger requirements for underwriting profitability in all of our portfolios, particularly those for long-tail casualty business.
Although investing at lower interest rates puts pressure on our ability to adjust pricing to achieve profitability objectives, market conditions have been conducive to achieving our pricing targets. The pressure on pricing does not necessarily ease as interest rates rise, as the changes in interest rates are a lagging response to economic conditions of unemployment and inflation. We monitor these trends closely, particularly loss cost trend uncertainty, to ensure that not only our pricing, but also our loss reserving, assumptions are proactive to, and considerate of, current and future economic conditions.
For our General Insurance segment loss reserves, sustained low interest rates may unfavorably affect the statutory net loss reserve discount for workers’ compensation and its associated amortization.
Impact of Currency Volatility
Currency volatility remains acute. This volatility affected income for those businesses with substantial international operations. In particular, growth trends in net premiums written reported in U.S. dollars can differ significantly from those measured in original currencies. The net effect on underwriting results, however, is significantly mitigated, as both revenues and expenses are similarly affected.
These currencies may continue to fluctuate, in either direction, especially as a result of central bank responses to inflation, concerns regarding future economic growth and other macroeconomic factors, and such fluctuations will affect net premiums written growth trends reported in U.S. dollars, as well as financial statement line item comparability.
General Insurance businesses are transacted in most major foreign currencies. The following table presents the average of the quarterly weighted average exchange rates of the Major Currencies, which have the most significant impact on our businesses:
Years Ended December 31, |
|
|
|
| Percentage Change | ||||
Rate for 1 USD |
| 2021 | 2020 | 2019 |
| 2021 vs. 2020 |
| 2020 vs. 2019 |
|
Currency: |
|
|
|
|
|
|
|
|
|
GBP |
| 0.73 | 0.78 | 0.79 |
| (6) | % | (1) | % |
EUR |
| 0.84 | 0.88 | 0.90 |
| (5) | % | (2) | % |
JPY |
| 108.92 | 107.23 | 109.31 |
| 2 | % | (2) | % |
Unless otherwise noted, references to the effects of foreign exchange in the General Insurance discussion of results of operations are with respect to movements in the Major Currencies included in the preceding table.
82 AIG | 2021 Form 10-K
Consolidated Results of Operations
The following section provides a comparative discussion of our consolidated results of operations on a reported basis for the three-year period ended December 31, 2021. Factors that relate primarily to a specific business are discussed in more detail within the business segment operations section.
For information regarding the Critical Accounting Estimates that affect our results of operations see Critical Accounting Estimates. For information regarding AIG’s results of operations for the year ended December 31, 2019 and the year ended December 31, 2020 compared with the year ended December 31, 2019 see Part II, Item 7. MD&A – Consolidated Results of Operations of our 2020 Annual Report.
The following table presents our consolidated results of operations and other key financial metrics:
Years Ended December 31, |
|
|
|
| Percentage Change | ||||||
(in millions) |
| 2021 |
| 2020 |
| 2019 |
| 2021 vs. 2020 |
| 2020 vs. 2019 |
|
Revenues: |
|
|
|
|
|
|
|
|
|
|
|
Premiums | $ | 31,259 | $ | 28,523 | $ | 30,561 |
| 10 | % | (7) | % |
Policy fees |
| 3,051 |
| 2,917 |
| 3,015 |
| 5 |
| (3) |
|
Net investment income: |
|
|
|
|
|
|
|
|
|
|
|
Net investment income - excluding Fortitude Re funds |
|
|
|
|
|
|
|
|
|
|
|
withheld assets |
| 12,641 |
| 12,578 |
| 14,619 |
| 1 |
| (14) |
|
Net investment income - Fortitude Re funds withheld |
|
|
|
|
|
|
|
|
|
|
|
assets |
| 1,971 |
| 1,053 |
| - |
| 87 |
| NM |
|
Total net investment income |
| 14,612 |
| 13,631 |
| 14,619 |
| 7 |
| (7) |
|
Net realized gains (losses): |
|
|
|
|
|
|
|
|
|
|
|
Net realized gains (losses) - excluding Fortitude Re |
|
|
|
|
|
|
|
|
|
|
|
funds withheld assets and embedded derivative |
| 1,751 |
| (56) |
| 632 |
| NM |
| NM |
|
Net realized gains on Fortitude Re funds |
|
|
|
|
|
|
|
|
|
|
|
withheld assets |
| 1,003 |
| 463 |
| - |
| 117 |
| NM |
|
Net realized losses on Fortitude Re funds |
|
|
|
|
|
|
|
|
|
|
|
withheld embedded derivative |
| (603) |
| (2,645) |
| - |
| 77 |
| NM |
|
Total net realized gains (losses) |
| 2,151 |
| (2,238) |
| 632 |
| NM |
| NM |
|
Other income |
| 984 |
| 903 |
| 919 |
| 9 |
| (2) |
|
Total revenues |
| 52,057 |
| 43,736 |
| 49,746 |
| 19 |
| (12) |
|
Benefits, losses and expenses: |
|
|
|
|
|
|
|
|
|
|
|
Policyholder benefits and losses incurred |
| 24,388 |
| 24,806 |
| 25,402 |
| (2) |
| (2) |
|
Interest credited to policyholder account balances |
| 3,557 |
| 3,622 |
| 3,832 |
| (2) |
| (5) |
|
Amortization of deferred policy acquisition costs |
| 4,573 |
| 4,211 |
| 5,164 |
| 9 |
| (18) |
|
General operating and other expenses |
| 8,790 |
| 8,396 |
| 8,537 |
| 5 |
| (2) |
|
Interest expense |
| 1,305 |
| 1,457 |
| 1,417 |
| (10) |
| 3 |
|
Loss on extinguishment of debt |
| 389 |
| 12 |
| 32 |
| NM |
| (63) |
|
Net (gain) loss on divestitures |
| (3,044) |
| 8,525 |
| 75 |
| NM |
| NM |
|
Total benefits, losses and expenses |
| 39,958 |
| 51,029 |
| 44,459 |
| (22) |
| 15 |
|
Income (loss) from continuing operations before |
|
|
|
|
|
|
|
|
|
|
|
income tax expense (benefit) |
| 12,099 |
| (7,293) |
| 5,287 |
| NM |
| NM |
|
Current |
| (45) |
| 217 |
| 545 |
| NM |
| (60) |
|
Deferred |
| 2,221 |
| (1,677) |
| 621 |
| NM |
| NM |
|
Income tax expense (benefit) |
| 2,176 |
| (1,460) |
| 1,166 |
| NM |
| NM |
|
Income (loss) from continuing operations |
| 9,923 |
| (5,833) |
| 4,121 |
| NM |
| NM |
|
Income from discontinued operations, net of income |
|
|
|
|
|
|
|
|
|
|
|
taxes |
| - |
| 4 |
| 48 |
| NM |
| (92) |
|
Net income (loss) |
| 9,923 |
| (5,829) |
| 4,169 |
| NM |
| NM |
|
Less: Net income attributable to |
|
|
|
|
|
|
|
|
|
|
|
noncontrolling interests |
| 535 |
| 115 |
| 821 |
| 365 |
| (86) |
|
Net income (loss) attributable to AIG |
| 9,388 |
| (5,944) |
| 3,348 |
| NM |
| NM |
|
Less: Dividends on preferred stock |
| 29 |
| 29 |
| 22 |
| - |
| 32 |
|
Net income (loss) attributable to AIG common |
|
|
|
|
|
|
|
|
|
|
|
shareholders | $ | 9,359 | $ | (5,973) | $ | 3,326 |
| NM | % | NM | % |
AIG | 2021 Form 10-K 83
|
|
|
|
|
|
|
|
|
|
|
|
|
|
Years Ended December 31, |
|
|
|
|
| 2021 |
|
| 2020 |
|
| 2019 |
|
Return on common equity |
|
|
|
|
| 14.5 | % |
| (9.4) | % |
| 5.3 | % |
Adjusted return on common equity |
|
|
|
|
| 8.6 | % |
| 4.4 | % |
| 8.3 | % |
|
|
|
|
|
|
|
|
|
|
|
|
|
|
|
|
|
|
|
|
|
| December 31, |
|
| December 31, |
| |
(in millions, except per common share data) |
|
|
|
|
|
|
|
| 2021 |
|
| 2020 |
|
Balance sheet data: |
|
|
|
|
|
|
|
|
|
|
|
|
|
Total assets |
|
|
|
|
|
|
| $ | 596,112 |
| $ | 586,481 |
|
Long-term debt |
|
|
|
|
|
| 23,741 |
|
| 28,103 |
| ||
Debt of consolidated investment entities |
|
|
|
|
|
| 6,422 |
|
| 9,431 |
| ||
Total AIG shareholders’ equity |
|
|
|
|
|
|
|
| 65,956 |
|
| 66,362 |
|
Book value per common share |
|
|
|
|
|
|
|
| 79.97 |
|
| 76.46 |
|
Adjusted book value per common share |
|
|
|
|
|
|
|
| 68.83 |
|
| 57.01 |
|
The following table presents a reconciliation of Book value per common share to Adjusted book value per common share, which is a non-GAAP measure. For additional information see Use of Non-GAAP Measures.
| At December 31, | |||||
(in millions, except per common share data) |
| 2021 |
| 2020 |
| 2019 |
Total AIG shareholders' equity | $ | 65,956 | $ | 66,362 | $ | 65,675 |
Preferred equity |
| 485 |
| 485 |
| 485 |
Total AIG common shareholders' equity |
| 65,471 |
| 65,877 |
| 65,190 |
Less: Accumulated other comprehensive income (loss) |
| 6,687 |
| 13,511 |
| 4,982 |
Add: Cumulative unrealized gains and losses related to |
|
|
|
|
|
|
Fortitude Re funds withheld assets |
| 2,791 |
| 4,657 |
| - |
Less: Deferred tax assets |
| 5,221 |
| 7,907 |
| 8,977 |
Adjusted common shareholders' equity | $ | 56,354 | $ | 49,116 | $ | 51,231 |
|
|
|
|
|
|
|
Total common shares outstanding |
| 818.7 |
| 861.6 |
| 870.0 |
Book value per common share | $ | 79.97 | $ | 76.46 | $ | 74.93 |
Adjusted book value per common share |
| 68.83 |
| 57.01 |
| 58.89 |
The following table presents a reconciliation of Return on common equity to Adjusted return on common equity, which is a non-GAAP measure. For additional information see Use of Non-GAAP Measures.
Years Ended December 31, |
|
|
|
|
|
|
|
| |
(dollars in millions) |
| 2021 |
|
| 2020 |
|
| 2019 |
|
Actual or annualized net income (loss) attributable to AIG |
|
|
|
|
|
|
|
|
|
common shareholders | $ | 9,359 |
| $ | (5,973) |
| $ | 3,326 |
|
Actual or annualized adjusted after-tax income |
|
|
|
|
|
|
|
|
|
attributable to AIG common shareholders |
| 4,430 |
|
| 2,201 |
|
| 4,078 |
|
|
|
|
|
|
|
|
|
|
|
Average AIG common shareholders' equity | $ | 64,704 |
| $ | 63,225 |
| $ | 62,205 |
|
Less: Average AOCI |
| 9,096 |
|
| 7,529 |
|
| 3,261 |
|
Add: Average cumulative unrealized gains and losses related to |
|
|
|
|
|
|
|
|
|
Fortitude Re funds withheld assets |
| 3,200 |
|
| 2,653 |
|
| - |
|
Less: Average DTA |
| 7,025 |
|
| 8,437 |
|
| 9,605 |
|
Average adjusted AIG common shareholders' equity | $ | 51,783 |
| $ | 49,912 |
| $ | 49,339 |
|
Return on common equity |
| 14.5 | % |
| (9.4) | % |
| 5.3 | % |
Adjusted return on common equity |
| 8.6 | % |
| 4.4 | % |
| 8.3 | % |
84 AIG | 2021 Form 10-K
The following table presents a reconciliation of revenues to adjusted revenues:
Years Ended December 31, |
|
|
|
|
|
|
|
|
(in millions) |
| 2021 |
|
| 2020 |
|
| 2019 |
Revenues | $ | 52,057 |
| $ | 43,736 |
| $ | 49,746 |
Changes in fair value of securities used to hedge guaranteed living benefits |
| (60) |
|
| (56) |
|
| (228) |
Changes in the fair value of equity securities |
| 237 |
|
| (200) |
|
| (158) |
Other income (expense) - net |
| 24 |
|
| (49) |
|
| (46) |
Net investment income on Fortitude Re funds withheld assets |
| (1,971) |
|
| (1,053) |
|
| - |
Net realized gains on Fortitude Re funds withheld assets |
| (1,003) |
|
| (463) |
|
| - |
Net realized losses on Fortitude Re funds withheld embedded derivative |
| 603 |
|
| 2,645 |
|
| - |
Net realized (gains) losses* |
| (1,585) |
|
| 148 |
|
| (395) |
Non-operating litigation reserves and settlements |
| - |
|
| (23) |
|
| (9) |
Adjusted Revenues | $ | 48,302 |
| $ | 44,685 |
| $ | 48,910 |
* Includes all net realized gains and losses except earned income (periodic settlements and changes in settlement accruals) on derivative instruments used for non-qualifying (economic) hedging or for asset replication and net realized gains and losses on Fortitude Re funds withheld assets.
The following table presents a reconciliation of pre-tax income (loss)/net income (loss) attributable to AIG to adjusted pre-tax income (loss)/adjusted after-tax income (loss) attributable to AIG:
Years Ended December 31, | 2021 |
| 2020 |
| 2019 | |||||||||||||||||||||
|
|
| Total Tax | Non- |
|
|
|
|
| Total Tax | Non- |
|
|
|
|
| Total Tax | Non- |
|
| ||||||
|
|
| (Benefit) | controlling |
| After |
|
|
| (Benefit) | controlling |
| After |
|
|
| (Benefit) | controlling |
| After | ||||||
(in millions, except per common share data) | Pre-tax | Charge | Interests(d) |
| Tax |
| Pre-tax | Charge | Interests(d) |
| Tax |
| Pre-tax | Charge | Interests(e) |
| Tax | |||||||||
Pre-tax income (loss)/net income (loss), including |
|
|
|
|
|
|
|
|
|
|
|
|
|
|
|
|
|
|
|
|
|
|
|
|
|
|
noncontrolling interests | $ | 12,099 | $ | 2,176 | $ | - | $ | 9,923 |
| $ | (7,293) | $ | (1,460) | $ | - | $ | (5,829) |
| $ | 5,287 | $ | 1,166 | $ | - | $ | 4,169 |
Noncontrolling interests |
|
|
|
|
| (535) |
| (535) |
|
|
|
|
|
| (115) |
| (115) |
|
|
|
|
|
| (821) |
| (821) |
Pre-tax income (loss)/net income (loss) |
|
|
|
|
|
|
|
|
|
|
|
|
|
|
|
|
|
|
|
|
|
|
|
|
|
|
attributable to AIG | $ | 12,099 | $ | 2,176 | $ | (535) | $ | 9,388 |
| $ | (7,293) | $ | (1,460) | $ | (115) | $ | (5,944) |
| $ | 5,287 | $ | 1,166 | $ | (821) | $ | 3,348 |
Dividends on preferred stock |
|
|
|
|
|
|
| 29 |
|
|
|
|
|
|
|
| 29 |
|
|
|
|
|
|
|
| 22 |
Net income (loss) attributable to AIG common |
|
|
|
|
|
|
|
|
|
|
|
|
|
|
|
|
|
|
|
|
|
|
|
|
|
|
shareholders |
|
|
|
|
|
| $ | 9,359 |
|
|
|
|
|
|
| $ | (5,973) |
|
|
|
|
|
|
| $ | 3,326 |
Changes in uncertain tax positions and other tax |
|
|
|
|
|
|
|
|
|
|
|
|
|
|
|
|
|
|
|
|
|
|
|
|
|
|
adjustments(a) |
|
|
| 998 |
| - |
| (998) |
|
|
|
| 132 |
| - |
| (132) |
|
|
|
| (30) |
| - |
| 30 |
Deferred income tax valuation allowance |
|
|
|
|
|
|
|
|
|
|
|
|
|
|
|
|
|
|
|
|
|
|
|
|
|
|
(releases) charges(b) |
|
|
| (718) |
| - |
| 718 |
|
|
|
| 65 |
| - |
| (65) |
|
|
|
| 43 |
| - |
| (43) |
Changes in fair value of securities used to hedge |
|
|
|
|
|
|
|
|
|
|
|
|
|
|
|
|
|
|
|
|
|
|
|
|
|
|
guaranteed living benefits |
| (61) |
| (13) |
| - |
| (48) |
|
| (41) |
| (9) |
| - |
| (32) |
|
| (194) |
| (40) |
| - |
| (154) |
Changes in benefit reserves and DAC, VOBA and |
|
|
|
|
|
|
|
|
|
|
|
|
|
|
|
|
|
|
|
|
|
|
|
|
|
|
DSI related to net realized gains (losses) |
| 52 |
| 11 |
| - |
| 41 |
|
| (12) |
| (3) |
| - |
| (9) |
|
| (56) |
| (12) |
| - |
| (44) |
Changes in the fair value of equity securities |
| 237 |
| 49 |
| - |
| 188 |
|
| (200) |
| (42) |
| - |
| (158) |
|
| (158) |
| (33) |
| - |
| (125) |
Loss on extinguishment of debt |
| 389 |
| 82 |
| - |
| 307 |
|
| 12 |
| 2 |
| - |
| 10 |
|
| 32 |
| 7 |
| - |
| 25 |
Net investment income on Fortitude Re funds withheld |
|
|
|
|
|
|
|
|
|
|
|
|
|
|
|
|
|
|
|
|
|
|
|
|
|
|
assets |
| (1,971) |
| (414) |
| - |
| (1,557) |
|
| (1,053) |
| (221) |
| - |
| (832) |
|
| - |
| - |
| - |
| - |
Net realized gains on Fortitude Re funds |
|
|
|
|
|
|
|
|
|
|
|
|
|
|
|
|
|
|
|
|
|
|
|
|
|
|
withheld assets |
| (1,003) |
| (211) |
| - |
| (792) |
|
| (463) |
| (98) |
| - |
| (365) |
|
| - |
| - |
| - |
| - |
Net realized losses on Fortitude Re funds withheld |
|
|
|
|
|
|
|
|
|
|
|
|
|
|
|
|
|
|
|
|
|
|
|
|
|
|
embedded derivative |
| 603 |
| 126 |
| - |
| 477 |
|
| 2,645 |
| 555 |
| - |
| 2,090 |
|
| - |
| - |
| - |
| - |
Net realized (gains) losses(c) |
| (1,623) |
| (341) |
| - |
| (1,282) |
|
| 97 |
| 22 |
| - |
| 75 |
|
| (456) |
| (99) |
| - |
| (357) |
Income from discontinued operations |
|
|
|
|
|
|
| - |
|
|
|
|
|
|
|
| (4) |
|
|
|
|
|
|
|
| (48) |
Net (gain) loss on divestitures |
| (3,044) |
| (650) |
| - |
| (2,394) |
|
| 8,525 |
| 1,610 |
| - |
| 6,915 |
|
| 75 |
| 9 |
| - |
| 66 |
Non-operating litigation reserves and settlements |
| 3 |
| 1 |
| - |
| 2 |
|
| (21) |
| (4) |
| - |
| (17) |
|
| (2) |
| - |
| - |
| (2) |
Favorable prior year development and |
|
|
|
|
|
|
|
|
|
|
|
|
|
|
|
|
|
|
|
|
|
|
|
|
|
|
related amortization changes ceded under |
|
|
|
|
|
|
|
|
|
|
|
|
|
|
|
|
|
|
|
|
|
|
|
|
|
|
retroactive reinsurance agreements |
| (186) |
| (39) |
| - |
| (147) |
|
| (221) |
| (46) |
| - |
| (175) |
|
| (267) |
| (56) |
| - |
| (211) |
Net loss reserve discount (benefit) charge |
| (193) |
| (40) |
| - |
| (153) |
|
| 516 |
| 109 |
| - |
| 407 |
|
| 955 |
| 201 |
| - |
| 754 |
Pension expense related to lump sum |
|
|
|
|
|
|
|
|
|
|
|
|
|
|
|
|
|
|
|
|
|
|
|
|
|
|
payments to former employees |
| 34 |
| 7 |
| - |
| 27 |
|
| - |
| - |
| - |
| - |
|
| - |
| - |
| - |
| - |
Integration and transaction costs associated with |
|
|
|
|
|
|
|
|
|
|
|
|
|
|
|
|
|
|
|
|
|
|
|
|
|
|
acquiring or divesting businesses |
| 83 |
| 18 |
| - |
| 65 |
|
| 12 |
| 3 |
| - |
| 9 |
|
| 24 |
| 5 |
| - |
| 19 |
Restructuring and other costs |
| 433 |
| 91 |
| - |
| 342 |
|
| 435 |
| 91 |
| - |
| 344 |
|
| 218 |
| 46 |
| - |
| 172 |
Non-recurring costs related to regulatory or |
|
|
|
|
|
|
|
|
|
|
|
|
|
|
|
|
|
|
|
|
|
|
|
|
|
|
accounting changes |
| 68 |
| 15 |
| - |
| 53 |
|
| 65 |
| 14 |
| - |
| 51 |
|
| 12 |
| 2 |
| - |
| 10 |
Noncontrolling interests(d) |
|
|
|
|
| 222 |
| 222 |
|
|
|
|
|
| 62 |
| 62 |
|
|
|
|
|
| 660 |
| 660 |
Adjusted pre-tax income/Adjusted after-tax |
|
|
|
|
|
|
|
|
|
|
|
|
|
|
|
|
|
|
|
|
|
|
|
|
|
|
income attributable to AIG common |
|
|
|
|
|
|
|
|
|
|
|
|
|
|
|
|
|
|
|
|
|
|
|
|
|
|
shareholders | $ | 5,920 | $ | 1,148 | $ | (313) | $ | 4,430 |
| $ | 3,003 | $ | 720 | $ | (53) | $ | 2,201 |
| $ | 5,470 | $ | 1,209 | $ | (161) | $ | 4,078 |
|
|
|
|
|
|
|
|
|
|
|
|
|
|
|
|
|
|
|
|
|
|
|
|
|
|
|
Weighted average diluted shares outstanding(e) |
|
|
|
|
|
|
| 864.9 |
|
|
|
|
|
|
|
| 869.3 |
|
|
|
|
|
|
|
| 889.5 |
Income (loss) per common share attributable to |
|
|
|
|
|
|
|
|
|
|
|
|
|
|
|
|
|
|
|
|
|
|
|
|
|
|
AIG common shareholders (diluted)(e) |
|
|
|
|
|
| $ | 10.82 |
|
|
|
|
|
|
| $ | (6.88) |
|
|
|
|
|
|
| $ | 3.74 |
Adjusted after-tax income per common |
|
|
|
|
|
|
|
|
|
|
|
|
|
|
|
|
|
|
|
|
|
|
|
|
|
|
share attributable to AIG common |
|
|
|
|
|
|
|
|
|
|
|
|
|
|
|
|
|
|
|
|
|
|
|
|
|
|
shareholders (diluted)(e) |
|
|
|
|
|
| $ | 5.12 |
|
|
|
|
|
|
| $ | 2.52 |
|
|
|
|
|
|
| $ | 4.58 |
(a) The years ended December 31, 2021 and December 31, 2020 include the completion of audit activity by the Internal Revenue Service (IRS). The year ended December 31, 2020 also includes the write-down of net operating loss deferred tax assets in certain foreign jurisdictions, which is offset by valuation allowance release.
AIG | 2021 Form 10-K 85
(b) The years ended December 31, 2021 and 2020 include valuation allowance established against a portion of certain tax attribute carryforwards of AIG's U.S. federal consolidated income tax group, as well as valuation allowance changes in certain foreign jurisdictions.
(c) Includes all net realized gains and losses except earned income (periodic settlements and changes in settlement accruals) on derivative instruments used for non-qualifying (economic) hedging or for asset replication and net realized gains and losses on Fortitude Re funds withheld assets.
(d) For the year ended December 31, 2021, noncontrolling interests include realized non-operating gains on consolidated investment entities. Prior to June 2, 2020, noncontrolling interests was primarily due to the 19.9 percent investment in Fortitude Holdings by an affiliate of Carlyle, which occurred in the fourth quarter of 2018. Carlyle was allocated 19.9 percent of Fortitude Holdings’ standalone financial results through the June 2, 2020 closing date of the Majority Interest Fortitude Sale. Fortitude Holdings’ results were mostly eliminated in AIG’s consolidated income from continuing operations given that its results arose from intercompany transactions. Noncontrolling interests was calculated based on the standalone financial results of Fortitude Holdings. The most significant component of Fortitude Holdings’ standalone results was the change in fair value of the embedded derivatives which changes with movements in interest rates and credit spreads, and which was recorded in net realized gains and losses of Fortitude Holdings. In accordance with AIG's adjusted after-tax income definition, realized gains and losses are excluded from noncontrolling interests. Subsequent to the Majority Interest Fortitude Sale, AIG owns 3.5 percent of Fortitude Holdings and no longer consolidates Fortitude Holdings in its financial statements as of such date. The noncontrolling interest in Fortitude Holdings is carried at cost within AIG’s Other invested assets, which was $100 million as of December 31, 2021.
Fortitude Holdings’ summarized financial information (standalone results), prior to the Majority Interest Fortitude Sale on June 2, 2020 is presented below:
Years Ended December 31, |
|
| 2020 |
| 2019 | |||||||||
|
|
|
| Fortitude | AIG Noncontrolling |
| Fortitude | AIG Noncontrolling | ||||||
(in millions) |
|
|
|
| Holdings |
| Interest |
| Holdings |
| Interest | |||
Revenues |
|
|
|
|
| $ | 653 | $ | 130 |
| $ | 2,359 | $ | 470 |
Expenses |
|
|
|
|
|
| 702 |
| 140 |
|
| 1,890 |
| 376 |
Adjusted pre-tax income (loss) |
|
|
|
|
|
| (49) |
| (10) |
|
| 469 |
| 94 |
Taxes (benefit) expense |
|
|
|
|
|
| (10) |
| (2) |
|
| 98 |
| 20 |
Adjusted after-tax income (loss) |
|
|
|
|
|
| (39) |
| (8) |
|
| 371 |
| 74 |
|
|
|
|
|
|
|
|
|
|
|
|
|
|
|
Net realized gains and other charges |
|
|
|
|
|
| 383 |
| 77 |
|
| 4,216 |
| 839 |
Taxes on net realized gains and other charges |
|
|
|
|
|
| 81 |
| 16 |
|
| 886 |
| 177 |
Net realized gains and other charges - after-tax |
|
|
|
|
|
| 302 |
| 61 |
|
| 3,330 |
| 662 |
Net income |
|
|
|
|
| $ | 263 | $ | 53 |
| $ | 3,701 | $ | 736 |
(e) For the year ended December 31, 2020, because we reported a net loss attributable to AIG common shareholders, all common stock equivalents are anti-dilutive and are therefore excluded from the calculation of diluted shares and diluted per share amounts. However, because we reported adjusted after-tax income attributable to AIG common shareholders, the calculation of adjusted after-tax income per diluted share attributable to AIG common shareholders includes 5,401,597 dilutive shares for the year ended December 31, 2020.
pre-tax income (LOSS) Comparison for 2021 and 2020
Pre-tax income of $12.1 billion in 2021 compared to pre-tax loss of $7.3 billion in 2020.
For the main drivers impacting AIG’s results of operations, see Executive Summary – Financial Performance Summary – Net Income (Loss) Attributable to AIG Common Shareholders.
U.S. Tax law changes
The IRS has continued to issue new guidance in relation to the Tax Act enacted in 2017. Guidance has been issued covering provisions for Global Intangible Low-Taxed Income (GILTI) under which taxes are imposed on the excess of a deemed return on tangible assets of certain foreign subsidiaries, foreign tax credits by which the U.S. mitigates double taxation of foreign operations, and other elements of tax law. Changes to this guidance, and other provisions of tax law, are expected in future periods. Such guidance may result in changes to the interpretations and assumptions we made and actions we may take, which may impact amounts recorded with respect to international provisions of the Tax Act, possibly materially. Consistent with accounting guidance, we have made an accounting policy election to treat GILTI taxes as a period tax charge in the period the tax is incurred.
On March 27, 2020, the U.S. enacted the Coronavirus Aid, Relief, and Economic Security (CARES) Act to mitigate the economic impacts of the COVID-19 pandemic. The tax provisions of the CARES Act have not had and are currently not expected to have a material impact on AIG’s U.S. federal tax liabilities.
On November 15, 2021, the U.S. enacted the Infrastructure Investment and Jobs Act to improve infrastructure in the U.S. The tax provisions of the Infrastructure Investment and Jobs Act have not had and are currently not expected to have a material impact on AIG’s U.S. federal tax liabilities.
Repatriation Assumptions
For 2021, we consider our foreign earnings with respect to certain operations in Canada, South Africa, Japan, Latin America, Bermuda as well as the European, Asia Pacific and Middle East regions to be indefinitely reinvested. These earnings relate to ongoing operations and have been reinvested in active business operations. Deferred taxes, if necessary, have been provided on earnings of non-U.S. affiliates whose earnings are not indefinitely reinvested.
86 AIG | 2021 Form 10-K
INCOME TAX EXPENSE ANALYSIS
For the year ended December 31, 2021, the effective tax rate on income from continuing operations was 18.0 percent. The effective tax rate on income from continuing operations differs from the statutory tax rate of 21 percent primarily due to:
tax benefits of:
– $935 million associated with the release of reserves for uncertain tax positions, penalties and interest related to the recent completion of audit activity by the IRS, as well as release of reserves for uncertain tax positions and interest related to a New York State tax settlement based on the completion of recent audit activity,
– $109 million of reclassifications from accumulated other comprehensive income to income from continuing operations related to the disposal of available for sale securities,
– $97 million related to income attributable to non-controlling interests, and
– $55 million associated with tax exempt income;
partially offset by tax charges of:
– $700 million associated with the establishment of U.S. federal valuation allowance related to certain tax attribute carryforwards,
– $134 million associated with the effect of foreign operations, and
– $37 million of state and local income taxes.
The effect of foreign operations is primarily related to income and losses in our foreign operations taxed at statutory tax rates different than 21 percent and foreign income subject to U.S. taxation.
For the year ended December 31, 2020, the effective tax rate on loss from continuing operations was 20.0 percent. The effective tax rate on loss from continuing operations differs from the statutory tax rate of 21 percent primarily due to:
tax charges of:
– $186 million related to tax effects of the Majority Interest Fortitude Sale,
– $150 million associated with the establishment of U.S. federal valuation allowance related to certain tax attribute carryforwards,
– $165 million net charge associated with changes in uncertain tax positions primarily driven by the accrual of IRS interest,
– $76 million associated with the effect of foreign operations, and
– $35 million of excess tax charges related to share-based compensation payments recorded through the income statement;
partially offset by tax benefits of:
– $379 million associated with the remeasurement of tax liabilities, penalties and interest primarily related to the IRS audit settlement for tax years 1991-2006,
– $101 million of reclassifications from accumulated other comprehensive income to income from continuing operations related to the disposal of available for sale securities, and
– $58 million associated with tax exempt income.
The effect of foreign operations is primarily related to income and losses in our foreign operations taxed at statutory tax rates different than 21 percent and foreign income subject to U.S. taxation.
AIG | 2021 Form 10-K 87
Business Segment Operations
Our business operations consist of General Insurance, Life and Retirement and Other Operations.
General Insurance consists of two operating segments: North America and International. Life and Retirement consists of four operating segments: Individual Retirement, Group Retirement, Life Insurance and Institutional Markets. Other Operations is primarily comprised of corporate, our institutional asset management business and consolidation and eliminations.
On October 26, 2020, AIG announced its intention to separate its Life and Retirement business from AIG. For further discussion on the separation of Life and Retirement see Note 1 to the Consolidated Financial Statements.
The following table summarizes Adjusted pre-tax income (loss) from our business segment operations. See also Note 3 to the Consolidated Financial Statements.
Years Ended December 31, |
|
|
|
| |||
(in millions) |
|
| 2021 |
| 2020 |
| 2019 |
General Insurance |
|
|
|
|
|
|
|
North America - Underwriting loss |
| $ | (47) | $ | (1,301) | $ | (365) |
International - Underwriting income |
|
| 1,102 |
| 277 |
| 454 |
Net investment income |
|
| 3,304 |
| 2,925 |
| 3,444 |
General Insurance |
|
| 4,359 |
| 1,901 | $ | 3,533 |
Life and Retirement |
|
|
|
|
|
|
|
Individual Retirement |
|
| 1,939 |
| 1,938 |
| 1,977 |
Group Retirement |
|
| 1,284 |
| 1,013 |
| 937 |
Life Insurance |
|
| 106 |
| 142 |
| 331 |
Institutional Markets |
|
| 582 |
| 438 |
| 308 |
Life and Retirement |
|
| 3,911 |
| 3,531 |
| 3,553 |
Other Operations |
|
|
|
|
|
|
|
Other Operations before consolidation and eliminations |
|
| (1,418) |
| (1,963) |
| (1,312) |
Consolidation and eliminations |
|
| (932) |
| (466) |
| (304) |
Other Operations |
|
| (2,350) |
| (2,429) |
| (1,616) |
Adjusted pre-tax income |
| $ | 5,920 | $ | 3,003 | $ | 5,470 |
88 AIG | 2021 Form 10-K
General Insurance |
General Insurance is managed by our geographic markets of North America and International. Our global presence is reflected in our multinational capabilities to provide our Commercial Lines and Personal Insurance products within these geographic markets.
PRODUCTS AND DISTRIBUTION | ||
|
| |
Liability: Products include general liability, environmental, commercial automobile liability, workers’ compensation, excess casualty and crisis management insurance products. Casualty also includes risk-sharing and other customized structured programs for large corporate and multinational customers. Financial Lines: Products include professional liability insurance for a range of businesses and risks, including directors and officers, mergers and acquisitions, fidelity, employment practices, fiduciary liability, cyber risk, kidnap and ransom, and errors and omissions insurance. Property: Products include commercial and industrial property as well as package insurance products and services that cover exposures to man-made and natural disasters, including business interruption. Global Specialty: Products include Aero, political risk, trade credit, portfolio solutions, energy-related property insurance products and marine. Crop Risk Services: Products include hailstorm and multi-peril insurance. Personal Lines: Products include personal auto and property in selected markets and insurance for high net-worth individuals offered through AIG’s Private Client Group (PCG) in the U.S. that covers auto, homeowners, umbrella, yacht, fine art and collections. In addition, we offer extended warranty insurance and services covering electronics, appliances, and HVAC. Accident & Health: Products include voluntary and sponsor-paid personal accident and supplemental health products for individuals, employees, associations and other organizations, as well as a broad range of travel insurance products and services for leisure and business travelers. | ||


General Insurance products in North America and International markets are distributed through various channels, including captive and independent agents, brokers, affinity partners, airlines and travel agents, and retailers. Our global platform enables writing multi-national and cross-border risks in both Commercial Lines and Personal Insurance.
BUSINESS STRATEGY
Profitable Growth: Deploy capital efficiently to act opportunistically and optimize diversity within the portfolio to grow in profitable lines, geographies and customer segments, while taking a disciplined approach in managing exposures to those where terms and conditions meet our risk/return appetite. Look to inorganic growth opportunities in profitable markets and segments to expand our capabilities and footprint.
Reinsurance Optimization: Strategically partner with reinsurers to effectively manage exposure to losses arising from frequency of large catastrophic events and severity from individual risk losses. We strive to optimize our reinsurance program to manage volatility and protect the balance sheet from tail events and unpredictable net losses in support of our profitable growth objectives.
Underwriting Excellence: Empower and increase accountability of the underwriter and continue to integrate underwriting, claims and actuarial to enable better decision making. Focus on enhancing risk selection, driving consistent underwriting best practices and building robust monitoring standards to improve underwriting results.
AIG | 2021 Form 10-K 89
COMPETITION and challenges
Operating in a highly competitive industry, General Insurance competes against several hundred companies, specialty insurance organizations and other underwriting organizations in the U.S. In international markets, we compete against foreign insurance operations of large global insurance groups and local companies in specific market areas and product types. Insurance companies compete through a combination of risk acceptance criteria, product pricing, service and terms and conditions. General Insurance seeks to distinguish itself in the insurance industry primarily based on its well-established brand, global franchise, multinational capabilities, financial and capital strength, innovative products, claims handling expertise, expertise in providing specialized coverages and customer service.
We serve our business and individual customers on a global basis – from the largest multinational corporations to local businesses and individuals. Our clients benefit from our substantial underwriting expertise.
Our challenges include:
long-tail Commercial Lines exposures that create added challenges to pricing and risk management;
over-capacity in certain lines of business that creates downward market pressure on pricing;
tort environment volatility in certain jurisdictions and lines of business; and
volatility in claims arising from natural and man-made catastrophes, including public health events, such as the COVID-19 pandemic.
OUTLOOK – INDUSTRY AND ECONOMIC FACTORS
Below is a discussion of the industry and economic factors impacting our operating segments:
The worldwide health and economic impact of COVID-19 continues to evolve, influenced by the scope, severity and duration of the pandemic as well as the actions of governments, judiciaries, legislative bodies, regulators and other third parties in response, all of which are subject to continuing uncertainty. While production in certain lines of business continues to remain near or below pre-COVID-19 levels, the global economic recovery, although uneven, is having a positive impact on consumer and business demand across our Commercial Lines and Personal Insurance businesses. The overall results of General Insurance for 2021 reflect continued strong performance from our Commercial Lines portfolio and positive momentum within Personal Insurance. Across our North America and International Commercial Lines of business we have seen increased demand for our insurance products with improvement in rates as well as terms and conditions. We continue to monitor inflationary impacts resulting from government stimulus, sharp increases in demand, labor force and supply chain disruptions, among other factors, on rate adequacy and loss cost trends. The ultimate impact of COVID-19 on our business will likely be influenced by the evolution of the virus and its potential to further impact the global economy.
General Insurance – North America
The North America business remains in a firm market with common drivers being higher industry-wide claims severity trends driven by social and economic inflation, higher natural catastrophe losses over recent years driven by increasing loss frequency and severity (in part connected to climate change), the uncertain impact of COVID-19 and the low interest rate environment. While market discipline continues to support price increases across most lines (outside of Workers’ Compensation), we are seeing capacity move back into the market in certain segments given the improved pricing levels. We have focused on retaining our best accounts which has led to improving retention across the portfolio. These retention rates are often coupled with an exposure limit management strategy to reduce volatility within the portfolio. We continue to proactively identify segment growth areas as market conditions warrant through effective portfolio management, while non-renewing unprofitable business.
Personal Insurance growth prospects are supported by the need for full life cycle products and coverage, increases in personal wealth accumulation, and awareness of insurance protection and risk management. We compete in the high net worth market, accident and health insurance, travel insurance, and warranty services and will continue to expand our innovative products and services to distribution partners and clients.
During the first quarter of 2021, AIG amended a distribution agreement with one of its largest travel insurance distributors. Following the effectiveness of the amendments, the revised agreement no longer represents a risk transfer transaction and as such is accounted for under deposit accounting.
90 AIG | 2021 Form 10-K
General Insurance – International
We believe our global presence provides Commercial Lines and Personal Insurance a competitive advantage, as the demand for multinational cross-border coverage and services increases due to the growing number of international customers, while giving us the ability to respond quickly to local market conditions and build client relationships.
We are continuing to pursue growth in our most profitable lines of business and diversify our portfolio across all regions by expanding key business lines (i.e. Financial Lines and Accident & Health) while remaining a market leader in key developed and developing markets. Overall, Commercial Lines continue to show positive rate increases, particularly in our Global Specialty, Financial Lines and Property portfolio and across international markets where market events or withdrawal of capability and capacity have favorably impacted pricing. We are maintaining our underwriting discipline, reducing gross and net limits, increasing use of reinsurance to reduce volatility, as well as continuing our risk selection strategy to improve profitability.
Personal Insurance focuses on individual customers, as well as group and corporate clients. Although market competition within Personal Insurance has increased, we continue to benefit from the underwriting quality, portfolio diversity, and generally low volatility of the short-tailed risk in these business lines, although some product classes are exposed to catastrophe losses.
General insurance RESULTS
Years Ended December 31, |
|
|
|
|
|
|
| Change | |||
(in millions) |
| 2021 |
| 2020 |
| 2019 |
| 2021 vs. 2020 |
| 2020 vs. 2019 |
|
Underwriting results: |
|
|
|
|
|
|
|
|
|
|
|
Net premiums written | $ | 25,890 | $ | 22,959 | $ | 25,092 |
| 13 | % | (9) | % |
(Increase) decrease in unearned premiums |
| (833) |
| 703 |
| 1,346 |
| NM |
| (48) |
|
Net premiums earned |
| 25,057 |
| 23,662 |
| 26,438 |
| 6 |
| (11) |
|
Losses and loss adjustment expenses incurred(a) |
| 16,097 |
| 16,803 |
| 17,246 |
| (4) |
| (3) |
|
Acquisition expenses: |
|
|
|
|
|
|
|
|
|
|
|
Amortization of deferred policy acquisition costs |
| 3,530 |
| 3,538 |
| 4,482 |
| - |
| (21) |
|
Other acquisition expenses |
| 1,373 |
| 1,283 |
| 1,292 |
| 7 |
| (1) |
|
Total acquisition expenses |
| 4,903 |
| 4,821 |
| 5,774 |
| 2 |
| (17) |
|
General operating expenses |
| 3,002 |
| 3,062 |
| 3,329 |
| (2) |
| (8) |
|
Underwriting income (loss) |
| 1,055 |
| (1,024) |
| 89 |
| NM |
| NM |
|
Net investment income |
| 3,304 |
| 2,925 |
| 3,444 |
| 13 |
| (15) |
|
Adjusted pre-tax income | $ | 4,359 | $ | 1,901 | $ | 3,533 |
| 129 | % | (46) | % |
Loss ratio(a) |
| 64.2 |
| 71.0 |
| 65.2 |
| (6.8) |
| 5.8 |
|
Acquisition ratio |
| 19.6 |
| 20.4 |
| 21.8 |
| (0.8) |
| (1.4) |
|
General operating expense ratio |
| 12.0 |
| 12.9 |
| 12.6 |
| (0.9) |
| 0.3 |
|
Expense ratio |
| 31.6 |
| 33.3 |
| 34.4 |
| (1.7) |
| (1.1) |
|
Combined ratio(a) |
| 95.8 |
| 104.3 |
| 99.6 |
| (8.5) |
| 4.7 |
|
Adjustments for accident year loss ratio, as adjusted |
|
|
|
|
|
|
|
|
|
|
|
and accident year combined ratio, as adjusted: |
|
|
|
|
|
|
|
|
|
|
|
Catastrophe losses and reinstatement premiums |
| (5.4) |
| (10.3) |
| (4.8) |
| 4.9 |
| (5.5) |
|
Prior year development, net of reinsurance and prior |
|
|
|
|
|
|
|
|
|
|
|
year premiums |
| 0.6 |
| 0.1 |
| 1.1 |
| 0.5 |
| (1.0) |
|
Adjustment for ceded premiums under reinsurance |
|
|
|
|
|
|
|
|
|
|
|
contracts and other |
| - |
| - |
| 0.1 |
| NM |
| NM |
|
Accident year loss ratio, as adjusted |
| 59.4 |
| 60.8 |
| 61.6 |
| (1.4) |
| (0.8) |
|
Accident year combined ratio, as adjusted |
| 91.0 |
| 94.1 |
| 96.0 |
| (3.1) |
| (1.9) |
|
(a) Consistent with our definition of APTI, excludes net loss reserve discount and the portion of favorable or unfavorable prior year reserve development for which we have ceded the risk under retroactive reinsurance agreements and related changes in amortization of the deferred gain.
AIG | 2021 Form 10-K 91
The following table presents General Insurance net premiums written by operating segment, showing change on both reported and constant dollar basis:
Years Ended December 31, |
|
|
|
|
|
| Percentage Change in |
| Percentage Change in | |||||||
|
|
|
|
|
|
|
| U.S. dollars |
| Original Currency | ||||||
(in millions) |
| 2021 |
| 2020 |
| 2019 |
| 2021 vs. 2020 |
| 2020 vs. 2019 |
|
| 2021 vs. 2020 |
| 2020 vs. 2019 |
|
North America | $ | 11,733 | $ | 9,784 | $ | 11,490 |
| 20 | % | (15) | % |
| 20 | % | (15) | % |
International |
| 14,157 |
| 13,175 |
| 13,602 |
| 7 |
| (3) |
|
| 5 |
| (3) |
|
Total net premiums written | $ | 25,890 | $ | 22,959 | $ | 25,092 |
| 13 | % | (9) | % |
| 11 | % | (9) | % |
The following tables present General Insurance accident year catastrophes(a) by geography(b) and number of events:
| # of |
|
| North |
|
|
|
|
(in millions) | Events |
|
| America |
| International |
| Total |
Year Ended December 31, 2021 |
|
|
|
|
|
|
|
|
Flooding, rainstorms and other | 7 |
| $ | 136 | $ | 136 | $ | 272 |
Windstorms and hailstorms | 10 |
|
| 541 |
| 72 |
| 613 |
Winter storms | 3 |
|
| 283 |
| 64 |
| 347 |
Wildfires | 4 |
|
| 67 |
| - |
| 67 |
Earthquakes | 1 |
|
| - |
| 19 |
| 19 |
Civil unrest | 1 |
|
| 20 |
| 19 |
| 39 |
Reinstatement premiums |
|
|
| 7 |
| 13 |
| 20 |
Total catastrophe-related charges | 26 |
| $ | 1,054 | $ | 323 | $ | 1,377 |
Year Ended December 31, 2020 |
|
|
|
|
|
|
|
|
Flooding, rainstorms and other | 4 |
| $ | 27 | $ | 64 | $ | 91 |
Windstorms and hailstorms | 14 |
|
| 759 |
| 195 |
| 954 |
Wildfires | 5 |
|
| 145 |
| 2 |
| 147 |
Earthquakes | 2 |
|
| 35 |
| 12 |
| 47 |
COVID-19 | N/A | (c) |
| 703 |
| 390 |
| 1,093 |
Civil unrest | 1 |
|
| 68 |
| 28 |
| 96 |
Reinstatement premiums |
|
|
| (11) |
| 25 |
| 14 |
Total catastrophe-related charges | 26 |
| $ | 1,726 | $ | 716 | $ | 2,442 |
Year Ended December 31, 2019 |
|
|
|
|
|
|
|
|
Flooding, rainstorms and other | 3 |
| $ | 20 | $ | 13 | $ | 33 |
Windstorms and hailstorms | 22 |
|
| 653 |
| 383 |
| 1,036 |
Winter storms | 4 |
|
| 96 |
| 1 |
| 97 |
Wildfires | 3 |
|
| 58 |
| 10 |
| 68 |
Civil unrest | 2 |
|
| - |
| 23 |
| 23 |
Reinstatement premiums |
|
|
| (14) |
| 35 |
| 21 |
Total catastrophe-related charges | 34 |
| $ | 813 | $ | 465 | $ | 1,278 |
(a) Natural catastrophe losses are generally weather or seismic events, in each case, having a net impact on AIG in excess of $10 million and man-made catastrophe losses, such as terrorism and civil unrest that exceed the $10 million threshold.
(b) Geography: North America primarily includes insurance businesses in the United States, Canada and Bermuda, and our global reinsurance business, AIG Re. International includes regional insurance businesses in Japan, the United Kingdom, Europe, Middle East and Africa (EMEA region), Asia Pacific, Latin America and Caribbean, and China. International also includes the results of Talbot Holdings, Ltd. as well as AIG’s global specialty business.
(c) As COVID-19 continues to evolve, impacting many lines of business, the number of events is yet to be determined.
92 AIG | 2021 Form 10-K
North America Results
Years Ended December 31, |
|
|
|
|
|
|
| Change | |||
(in millions) |
| 2021 |
| 2020 |
| 2019 |
| 2021 vs. 2020 |
| 2020 vs. 2019 |
|
Underwriting results: |
|
|
|
|
|
|
|
|
|
|
|
Net premiums written | $ | 11,733 | $ | 9,784 | $ | 11,490 |
| 20 | % | (15) | % |
(Increase) decrease in unearned premiums |
| (744) |
| 518 |
| 646 |
| NM |
| (20) |
|
Net premiums earned |
| 10,989 |
| 10,302 |
| 12,136 |
| 7 |
| (15) |
|
Losses and loss adjustment expenses incurred(a) |
| 8,134 |
| 8,720 |
| 8,867 |
| (7) |
| (2) |
|
Acquisition expenses: |
|
|
|
|
|
|
|
|
|
|
|
Amortization of deferred policy acquisition costs |
| 1,333 |
| 1,365 |
| 1,923 |
| (2) |
| (29) |
|
Other acquisition expenses |
| 440 |
| 359 |
| 478 |
| 23 |
| (25) |
|
Total acquisition expenses |
| 1,773 |
| 1,724 |
| 2,401 |
| 3 |
| (28) |
|
General operating expenses |
| 1,129 |
| 1,159 |
| 1,233 |
| (3) |
| (6) |
|
Underwriting loss | $ | (47) | $ | (1,301) | $ | (365) |
| 96 | % | (256) | % |
Loss ratio(a) |
| 74.0 |
| 84.6 |
| 73.1 |
| (10.6) |
| 11.5 |
|
Acquisition ratio |
| 16.1 |
| 16.7 |
| 19.8 |
| (0.6) |
| (3.1) |
|
General operating expense ratio |
| 10.3 |
| 11.3 |
| 10.2 |
| (1.0) |
| 1.1 |
|
Expense ratio |
| 26.4 |
| 28.0 |
| 30.0 |
| (1.6) |
| (2.0) |
|
Combined ratio(a) |
| 100.4 |
| 112.6 |
| 103.1 |
| (12.2) |
| 9.5 |
|
Adjustments for accident year loss ratio, as adjusted |
|
|
|
|
|
|
|
|
|
|
|
and accident year combined ratio, as adjusted: |
|
|
|
|
|
|
|
|
|
|
|
Catastrophe losses and reinstatement premiums |
| (9.5) |
| (16.7) |
| (6.8) |
| 7.2 |
| (9.9) |
|
Prior year development, net of reinsurance and prior |
|
|
|
|
|
|
|
|
|
|
|
year premiums |
| 1.2 |
| 1.2 |
| 1.0 |
| - |
| 0.2 |
|
Adjustment for ceded premiums under reinsurance |
|
|
|
|
|
|
|
|
|
|
|
contracts and other |
| - |
| (0.1) |
| 0.2 |
| NM |
| (0.3) |
|
Accident year loss ratio, as adjusted |
| 65.7 |
| 69.0 |
| 67.5 |
| (3.3) |
| 1.5 |
|
Accident year combined ratio, as adjusted |
| 92.1 |
| 97.0 |
| 97.5 |
| (4.9) |
| (0.5) |
|
(a) Consistent with our definition of APTI, excludes net loss reserve discount and the portion of favorable or unfavorable prior year reserve development for which we have ceded the risk under retroactive reinsurance agreements and related changes in amortization of the deferred gain.
Business and Financial Highlights
The North America General Insurance business continues to make progress in strengthening our underwriting, actively managing our portfolio to improve business mix and articulating our revised risk appetite to the marketplace. We are at the forefront of the industry across multiple lines in terms of driving rate momentum while simultaneously increasing the level of business retained in targeted lines. As we see disruption in the marketplace, we are well placed to capitalize on opportunities.
During the second quarter of 2020, AIG entered into a series of quota share reinsurance agreements, including with Lloyd’s Syndicate 2019, a Lloyd’s syndicate managed by Talbot Underwriting Ltd., and with PCG 2019 Corporate Member Ltd., both of which are wholly-owned subsidiaries of AIG, to cede PCG business written by our General Insurance operations to third parties. Overall, these ceded reinsurance transactions, accounted for under ASC 944 Financial Services – Insurance, further AIG’s continued optimization of its General Insurance portfolio, create additional products for clients and diversify AIG’s capital base. We consolidate our interest in Lloyd’s Syndicate 2019 and account for the reinsurance transactions in a manner consistent with other third-party reinsurance arrangements.
Underwriting losses decreased in 2021 compared to the prior year by $1.3 billion primarily due to significantly lower catastrophe losses, improvement in the accident year loss ratio, as adjusted, higher net favorable prior year reserve development and a lower expense ratio.
Net premiums written increased in 2021 compared to the prior year by $1.9 billion primarily due to growth in Commercial Lines driven by strong rate improvement, higher renewal retentions, strong new business production and lower ceded premiums driven by 2020 quota share reinsurance agreements. While net premiums written increased across most Commercial Lines, the increase was particularly strong within our AIG Re, Casualty, Financial Lines and Property businesses. In Personal Lines, our Travel business benefitted from increased consumer spending, while our Warranty business saw growth in new and existing programs.
AIG | 2021 Form 10-K 93
For information regarding Reinsurance Activities see Enterprise Risk Management.
North America Net Premiums Written (in millions) | |
| 2021 and 2020 Comparison Net premiums written increased by $1.9 billion primarily due to: • growth in Commercial Lines ($1.6 billion), particularly within our AIG Re, Casualty, Financial Lines, and Property businesses, driven by strong rate improvement, higher renewal retentions and strong new business production; • increased PCG net premiums written resulting from changes in our reinsurance program ($223 million); and • growth in Personal Lines in our Travel business driven by increased consumer spending, as well as growth in new and existing programs within our Warranty business. |
North America Underwriting Income (Loss) (in millions) | |
| 2021 and 2020 Comparison Underwriting loss decreased by $1.3 billion primarily due to: • significantly lower catastrophe losses ($672 million), notably due to the impact of COVID-19 in 2020; • higher premium with improvement in the accident year loss ratio, as adjusted (3.3 points) primarily driven by changes in business mix along with strong rate improvement, focused risk selection and improved terms and conditions; • lower expense ratio of 1.6 points reflecting a lower acquisition ratio (0.6 points) primarily driven by changes in business mix including the impact of COVID-19 most notably in Travel, changes in 2021 Commercial Lines reinsurance program and a lower general operating expense ratio (1.0 points) resulting from continued general expense discipline as we grow the portfolio; and • higher net favorable prior year reserve development ($37 million), primarily driven by favorable development in PCG, partially offset by unfavorable development in Financial Lines and Property.
|
94 AIG | 2021 Form 10-K
North America Combined Ratios | |
| 2021 and 2020 Comparison The decrease in the calendar year combined ratio of 12.2 points reflected a decrease in both the loss ratio (10.6 points) and the expense ratio (1.6 points). The decrease in the loss ratio of 10.6 points reflected: • significantly lower catastrophe losses (7.2 points), notably due to the impact of COVID-19 in 2020; and • higher premium with improvement in the accident year loss ratio, as adjusted (3.3 points) primarily driven by changes in business mix along with strong rate improvement, focused risk selection and improved terms and conditions. The decrease in the expense ratio of 1.6 points reflected a lower acquisition ratio (0.6 points) primarily driven by changes in business mix including the impact of COVID-19 most notably in Travel, changes in 2021 Commercial Lines reinsurance program and a lower general operating expense ratio (1.0 points) resulting from continued general expense discipline as we grow the portfolio.
|

International Results
Years Ended December 31, |
|
|
|
|
|
|
| Change | |||
(in millions) |
| 2021 |
| 2020 |
| 2019 |
| 2021 vs. 2020 |
| 2020 vs. 2019 |
|
Underwriting results: |
|
|
|
|
|
|
|
|
|
|
|
Net premiums written | $ | 14,157 | $ | 13,175 | $ | 13,602 |
| 7 | % | (3) | % |
(Increase) decrease in unearned premiums |
| (89) |
| 185 |
| 700 |
| NM |
| (74) |
|
Net premiums earned |
| 14,068 |
| 13,360 |
| 14,302 |
| 5 |
| (7) |
|
Losses and loss adjustment expenses incurred |
| 7,963 |
| 8,083 |
| 8,379 |
| (1) |
| (4) |
|
Acquisition expenses: |
|
|
|
|
|
|
|
|
|
|
|
Amortization of deferred policy acquisition costs |
| 2,197 |
| 2,173 |
| 2,559 |
| 1 |
| (15) |
|
Other acquisition expenses |
| 933 |
| 924 |
| 814 |
| 1 |
| 14 |
|
Total acquisition expenses |
| 3,130 |
| 3,097 |
| 3,373 |
| 1 |
| (8) |
|
General operating expenses |
| 1,873 |
| 1,903 |
| 2,096 |
| (2) |
| (9) |
|
Underwriting income | $ | 1,102 | $ | 277 | $ | 454 |
| 298 | % | (39) | % |
Loss ratio |
| 56.6 |
| 60.5 |
| 58.6 |
| (3.9) |
| 1.9 |
|
Acquisition ratio |
| 22.2 |
| 23.2 |
| 23.6 |
| (1.0) |
| (0.4) |
|
General operating expense ratio |
| 13.3 |
| 14.2 |
| 14.7 |
| (0.9) |
| (0.5) |
|
Expense ratio |
| 35.5 |
| 37.4 |
| 38.3 |
| (1.9) |
| (0.9) |
|
Combined ratio |
| 92.1 |
| 97.9 |
| 96.9 |
| (5.8) |
| 1.0 |
|
Adjustments for accident year loss ratio, as adjusted |
|
|
|
|
|
|
|
|
|
|
|
and accident year combined ratio, as adjusted: |
|
|
|
|
|
|
|
|
|
|
|
Catastrophe losses and reinstatement premiums |
| (2.3) |
| (5.3) |
| (3.2) |
| 3.0 |
| (2.1) |
|
Prior year development, net of reinsurance and prior |
|
|
|
|
|
|
|
|
|
|
|
year premiums |
| 0.1 |
| (0.7) |
| 1.1 |
| 0.8 |
| (1.8) |
|
Adjustment for ceded premiums under reinsurance |
|
|
|
|
|
|
|
|
|
|
|
contracts |
| - |
| - |
| 0.1 |
| NM |
| NM |
|
Accident year loss ratio, as adjusted |
| 54.4 |
| 54.5 |
| 56.6 |
| (0.1) |
| (2.1) |
|
Accident year combined ratio, as adjusted |
| 89.9 |
| 91.9 |
| 94.9 |
| (2.0) |
| (3.0) |
|
AIG | 2021 Form 10-K 95
Business and Financial Highlights
The International General Insurance business is focused on underwriting profits, driving operational efficiency and growing profitably in businesses and geographies that support our growth strategy.
Underwriting income increased in 2021 compared to the prior year by $825 million primarily due to significantly lower catastrophe losses, net favorable prior year reserve development compared to net adverse prior year reserve development in 2020 and a lower expense ratio.
Net premiums written, excluding the impact of foreign exchange, increased in 2021 compared to the prior year by $646 million primarily due to growth across most Commercial Lines, in particular Financial Lines, Global Specialty and Property driven by strong rate improvement, higher renewal retentions and strong new business production, partially offset by lower production across most lines within Personal Insurance due to the impact of COVID-19, as well as underwriting actions taken to strengthen our portfolio and maintain pricing discipline.
For a discussion of Reinsurance Activities see Enterprise Risk Management.
International Net Premiums Written (in millions) | |
| 2021 and 2020 Comparison Net premiums written, excluding the impact of foreign exchange, increased by $646 million due to: strong growth across Commercial Lines ($898 million), notably in Financial Lines, Global Specialty and Property driven by strong rate improvement, higher renewal retentions and strong new business production. These increases were partially offset by lower production in Personal Insurance ($252 million) due to the impact of COVID-19, as well as underwriting actions taken to strengthen our portfolio and maintain pricing discipline. |
International Underwriting Income (Loss) (in millions) | |
| 2021 and 2020 Comparison Underwriting income increased by $825 million primarily due to: significantly lower catastrophe losses ($393 million), notably due to the impact of COVID-19 in 2020; lower expense ratio 1.9 points reflected a lower acquisition ratio (1.0 points) primarily driven by lower acquisition expenses, changes in 2021 Commercial Lines reinsurance program and changes in business mix, as well as a lower general operating expense ratio (0.9 points), which reflects continued general expense discipline as we grow the portfolio; and net favorable prior year reserve development in 2021 as compared to adverse in 2020 (0.8 points or $88 million), primarily, due to favorable development across Personal Lines partially offset by lower favorable development in Property and Global Specialty. |

96 AIG | 2021 Form 10-K
International Combined Ratios | |
| 2021 and 2020 Comparison The decrease in the calendar year combined ratio of 5.8 points reflected a decrease in both the loss ratio (3.9 points) and the expense ratio (1.9 points). The decrease in the loss ratio by 3.9 points reflected: • significantly lower catastrophe losses (3.0 points), notably due to the impact of COVID-19 in 2020; and • net favorable prior year reserve development in 2021 compared to net adverse prior year reserve development in 2020 (0.8 points), primarily, due to favorable development across Personal Lines partially offset by lower favorable development in Property and Global Specialty. The decrease in the expense ratio by 1.9 points reflected: • lower acquisition ratio (1.0 points) primarily driven by lower acquisition expenses, changes in 2021 Commercial Lines reinsurance program and changes in business mix; and • lower general operating expense ratio (0.9 points) resulting from continued general expense discipline as we grow the portfolio. |
AIG | 2021 Form 10-K 97
Life and Retirement |
Life and Retirement consists of four operating segments: Individual Retirement, Group Retirement, Life Insurance and Institutional Markets. We offer a broad portfolio of products in the U.S. through a multichannel distribution network and life and health products in the UK and Ireland.
PRODUCTS AND DISTRIBUTION | |
| Variable Annuities: Products include variable annuities that offer a combination of growth potential, death benefit features and income protection features. Variable annuities are distributed primarily through banks, wirehouses, and regional and independent broker-dealers. Index Annuities: Products include fixed index annuities that provide growth potential based in part on the performance of a market index as well as optional living guaranteed features that provide lifetime income protection. Fixed index annuities are distributed primarily through banks, broker-dealers, independent marketing organizations and independent insurance agents. Fixed Annuities: Products include single premium fixed annuities, immediate annuities and deferred income annuities. Certain fixed deferred annuity products offer optional income protection features. The fixed annuities product line maintains an industry-leading position in the U.S. bank distribution channel by designing products collaboratively with banks and offering an efficient and flexible administration platform. Retail Mutual Funds: Includes our mutual fund offerings and related administration and servicing operations. Retail Mutual Funds are distributed primarily through broker-dealers. On July 16, 2021, the Company sold certain assets of the AIG Retail Mutual Funds business. For further details on the Sale of Certain Assets of the Retail Mutual Funds Business, see Executive Summary – Overview. |
| Group Retirement: Products and services consist of record-keeping, plan administrative and compliance services, financial planning and advisory solutions offered to employer defined contribution plans and their participants, along with proprietary and non-proprietary annuities and advisory and brokerage products offered outside of plans. AIG Retirement Services offers its products and services through The Variable Annuity Life Insurance Company and its subsidiaries, VALIC Financial Advisors, Inc. and VALIC Retirement Services Company. AIG Retirement Services career financial advisors serve individual clients, including in-plan enrollment support and education, and comprehensive financial planning services. |
| Life Insurance: In the U.S., products primarily include term life and universal life insurance distributed through independent marketing organizations, independent insurance agents, financial advisors and direct marketing. International operations primarily include the distribution of life and health products in the UK and Ireland. |
| Institutional Markets: Products primarily include stable value wrap products, structured settlement and pension risk transfer annuities (direct and assumed reinsurance), corporate- and bank-owned life insurance, high net worth products and guaranteed investment contracts (GICs). Institutional Markets products are primarily distributed through specialized marketing and consulting firms and structured settlement brokers. |


98 AIG | 2021 Form 10-K
FHLB Funding Agreements are issued through our Individual Retirement, Group Retirement and Institutional Markets operating segments. Funding agreements are issued by our U.S. Life and Retirement companies to FHLBs in their respective districts at fixed or floating rates over specified periods, which can be prepaid at our discretion. Proceeds are generally invested in fixed income securities and other suitable investments to generate spread income. These investment contracts do not have mortality or morbidity risk and are similar to GICs.
BUSINESS STRATEGY
Deliver client-centric solutions through our unique franchise by bringing together a broad portfolio of life insurance, retirement and institutional products offered through an extensive, multichannel distribution network. Life and Retirement focuses on ease of doing business, offering valuable solutions, and expanding and deepening its distribution relationships across multiple channels.
Position market leading businesses to serve growing needs by continually enhancing product solutions, service delivery and digital capabilities while using data and analytics in an innovative manner to improve customer experience.
|
|
|
|
|
|
| Individual Retirement will continue to capitalize on the opportunity to meet consumer demand for guaranteed income by maintaining innovative variable and index annuity products, while also managing risk from guarantee features through risk-mitigating product design and well-developed economic hedging capabilities. Our fixed annuity products provide diversity in our annuity product suite by offering stable returns for retirement savings. |
|
| Group Retirement continues to enhance its technology platform to improve the customer experience for plan sponsors and individual participants. AIG Retirement Services’ self-service tools paired with its career financial advisors provide a compelling service platform. Group Retirement’s strategy also involves providing financial planning services for its clients and meeting their need for income in retirement. In this advisory role, Group Retirement’s clients may invest in assets in which AIG or a third-party is custodian. |
|
|
|
|
|
|
|
|
|
|
|
|
|
| Life Insurance in the U.S. will continue to position itself for growth and changing market dynamics while continuing to execute strategies to enhance returns. Our focus is on materializing success from a multi-year effort of building state-of-the-art platforms and underwriting innovations, which are expected to bring process improvements and cost efficiencies. In the UK, AIG Life Insurance will continue to focus on growing the business organically and through potential acquisition opportunities. |
|
| Institutional Markets continues to grow its assets under management across multiple product lines, including stable value wrap, GICs and pension risk transfer annuities. Our growth strategy is opportunistic and allows us to pursue select transactions that meet our risk-adjusted return requirements. |
|
|
|
|
|
|
|
Enhance Operational Effectiveness by simplifying processes and operating environments to increase competitiveness, improve service and product capabilities and facilitate delivery of our target customer experience. We continue to invest in technology to improve operating efficiency and ease of doing business for our distribution partners and customers. We believe that simplifying our operating models will enhance productivity and support further profitable growth.
Manage our Balance Sheet through a rigorous approach to our products and portfolio. We match our product design and high-quality investments with our asset and liability exposures to support our cash and liquidity needs under various operating scenarios.
Deliver Value Creation and Manage Capital by striving to deliver solid earnings and returns on capital through disciplined pricing, sustainable underwriting improvements, expense efficiency, and diversification of risk, while optimizing capital allocation and efficiency within insurance entities to enhance return on common equity.
AIG | 2021 Form 10-K 99
COMPETITION and challenges
Life and Retirement operates in the highly competitive insurance and financial services industry in the U.S. and select international markets, competing against various financial services companies, including banks and other life insurance and mutual fund companies. Competition is primarily based on product pricing and design, distribution, financial strength, customer service and ease of doing business.
Our business remains competitive due to its long-standing market leading positions, innovative products, distribution relationships across multiple channels, customer-focused service and strong financial ratings.
Our primary challenges include:
a low interest rate environment and recent inflationary pressures, which makes it difficult to profitably price new products and puts margin pressure on existing business due to lower reinvestment yields;
increased competition in our primary markets, including aggressive pricing of annuities by competitors, increased competition and consolidation of employer groups in the group retirement planning market, and competitors with different profitability targets in the pension risk transfer space as well as other product lines;
increasingly complex new and proposed regulatory requirements, which have affected industry growth and costs; and
upgrading our technology and underwriting processes while managing general operating expenses.
OUTLOOK – INDUSTRY AND ECONOMIC FACTORS
Below is a discussion of the industry and economic factors impacting our specific operating segments:
The worldwide health and economic impact of COVID-19 continues to evolve, influenced by the scope, severity and duration of the pandemic, including resurgences in the virus, as well as the actions of governments, judiciaries, legislative bodies, regulators and other third parties in response, as well as the distribution and effectiveness of vaccinations, all of which are subject to continuing uncertainty. COVID-19 impacted the results for 2021 primarily through increased mortality as compared to 2020.
On October 26, 2020, AIG announced its intention to separate its Life and Retirement business from AIG. On November 2, 2021, AIG and Blackstone completed the acquisition by Blackstone of a 9.9 percent equity stake in SAFG, which is the holding company for AIG’s Life and Retirement business, for $2.2 billion in an all cash transaction, subject to adjustment if the final pro forma adjusted book value is greater or lesser than the target pro forma adjusted book value. This resulted in a $629 million decrease to AIG’s shareholders’ equity. As part of the separation, most of AIG’s investment operations were transferred to SAFG or its subsidiaries as of December 31, 2021, and AIG entered into a long-term asset management relationship with Blackstone to manage an initial $50 billion of Life and Retirement’s existing investment portfolio beginning in the fourth quarter of 2021, with that amount increasing by increments of $8.5 billion per year for five years beginning in the fourth quarter of 2022, for an aggregate of $92.5 billion. On November 1, 2021, SAFG declared a dividend payable to AIG Parent in the amount of $8.3 billion. In connection with such dividend, SAFG issued a promissory note to AIG Parent in the amount of $8.3 billion, which will be required to be paid to AIG Parent prior to the IPO of SAFG. As of February 16, 2022, no amounts have been paid under the promissory note. While we currently believe the IPO is the next step in the separation of the Life and Retirement business from AIG, no assurance can be given regarding the form that future separation transactions may take or the specific terms or timing thereof, or that a separation will in fact occur. Any separation transaction will be subject to the satisfaction of various conditions and approvals, including approval by the AIG Board of Directors, receipt of insurance and other required regulatory approvals, and satisfaction of any applicable requirements of the SEC.
For additional information on the sale of SAFG to Blackstone see Note 16 to the Consolidated Financial Statements.
On December 15, 2021, AIG and BREIT, a long-term, perpetual capital vehicle affiliated with Blackstone, completed the acquisition by BREIT of AIG’s interests in a U.S. affordable housing portfolio for $4.9 billion, in an all cash transaction, resulting in a pre-tax gain of $3.0 billion. The historical results of the U.S. affordable housing portfolio were reported in our Life and Retirement operating segments.
100 AIG | 2021 Form 10-K
On February 8, 2021, AIG announced the execution of a definitive agreement with Touchstone Investments (Touchstone), an indirect wholly-owned subsidiary of Western & Southern Financial Group, to sell certain assets of Life and Retirement's Retail Mutual Funds business. This sale consisted of the reorganization of twelve of the retail mutual funds managed by SunAmerica Asset Management, LLC (SAAMCo), a Life and Retirement entity, into certain Touchstone funds and was subject to certain conditions, including approval of the fund reorganizations by the retail mutual fund boards of directors/trustees and fund shareholders. The transaction closed on July 16, 2021, at which time we received initial proceeds and the twelve retail mutual funds managed by SAAMCo, with $6.8 billion in assets, were reorganized into Touchstone funds. Additional consideration may be earned over a three-year period based on asset levels in certain reorganized funds. Six retail mutual funds managed by SAAMCo and not included in the transaction were liquidated. We will retain our fund management platform and capabilities dedicated to our variable annuity insurance products.
For additional information regarding the separation of Life and Retirement please see Note 1 to the Consolidated Financial Statements and Part I, Item 1A. Risk Factors – Business and Operations – “No assurances can be given that the separation of our Life and Retirement business will occur or as to the specific terms or timing thereof. In addition, the separation could cause the emergence or exacerbate the effects of other risks to which AIG is exposed”.
Individual Retirement
Increasing life expectancy and reduced expectations for traditional retirement income from defined benefit programs and fixed income securities are leading Americans to seek additional financial security as they approach retirement. The strong demand for individual index and fixed deferred annuities with guaranteed income features has attracted increased competition in this product space. In response to the low interest rate environment, which has added pressure to profit margins, we have developed guaranteed income benefits for variable, fixed index, and fixed deferred annuities with margins that are less sensitive to the level of interest rates.
Changes in the capital markets (interest rate environment, equity markets, volatility) can have a significant impact on sales, surrender rates, investment returns, guaranteed income features, and net investment spreads in the annuity industry.
Group Retirement
Group Retirement competes in the defined contribution market under the AIG Retirement Services brand. AIG Retirement Services is a leading retirement plan provider in the U.S. for K-12 schools and school districts, higher education, healthcare, government and other not-for-profit institutions. The defined contribution market is a highly efficient and competitive market that requires support for both plan sponsors and individual participants. To meet this challenge, AIG Retirement Services is investing in a client-focused technology platform to support improved compliance and self-service functionality. AIG Retirement Services’ model pairs self-service tools with its career financial advisors who provide individual plan participants with enrollment support and comprehensive financial planning services.
Changes in the interest rate and equity market environment can have a significant impact on investment returns, fee income, advisory and other income, guaranteed income features, and net investment spreads, and a moderate impact on sales and surrender rates.
Life Insurance
Consumers have a significant need for life insurance, whether it is used for income replacement for their surviving family, estate planning or wealth transfer. Additionally, consumers use life insurance to provide living benefits in case of chronic, critical or terminal illnesses, and to supplement retirement income.
In response to consumer needs and a low interest rate environment, our Life Insurance product portfolio will continue to promote products with less long-duration interest rate risk and mitigate exposure to products that have long-duration interest rate risk through sales levels and hedging strategies.
As life insurance ownership remains at historical lows in the U.S. and the UK, efforts to expand the reach and increase the affordability of life insurance are critical. The industry is investing in consumer-centric efforts to reduce traditional barriers to securing life protection by simplifying the sales and service experience. Digitally enabled processes and tools provide a fast, friendly and simple path to life insurance protection.
AIG | 2021 Form 10-K 101
Institutional Markets
Institutional Markets serves a variety of needs for corporate clients. Demand is driven by a number of factors including the macroeconomic and regulatory environment. We expect to see continued growth in the pension risk transfer market (direct and assumed reinsurance) as corporate plan sponsors look to transfer asset or liability, longevity, administrative and operational risks associated with their defined benefit plans.
Changes in the interest rate environment can have a significant impact on investment returns and net investment spreads, as well as the tax efficiency associated with institutional life insurance products, impacting organic growth opportunities.
For additional information on the impact of market interest rate movement on our Life and Retirement business see Executive Summary – AIG’s Outlook – Industry and Economic Factors – Impact of Changes in the Interest Rate Environment.
life and retirement RESULTS
Years Ended December 31, |
|
| Percentage Change | ||||||||
(in millions) |
| 2021 |
| 2020 |
| 2019 |
| 2021 vs. 2020 |
| 2020 vs. 2019 |
|
Adjusted revenues: |
|
|
|
|
|
|
|
|
|
|
|
Premiums | $ | 6,029 | $ | 4,624 | $ | 3,789 |
| 30 | % | 22 | % |
Policy fees |
| 3,051 |
| 2,874 |
| 2,923 |
| 6 |
| (2) |
|
Net investment income |
| 9,521 |
| 8,881 |
| 8,733 |
| 7 |
| 2 |
|
Advisory fee and other income |
| 993 |
| 896 |
| 911 |
| 11 |
| (2) |
|
Total adjusted revenues |
| 19,594 |
| 17,275 |
| 16,356 |
| 13 |
| 6 |
|
Benefits, losses and expenses: |
|
|
|
|
|
|
|
|
|
|
|
Policyholder benefits and losses incurred |
| 8,379 |
| 6,884 |
| 5,824 |
| 22 |
| 18 |
|
Interest credited to policyholder account balances |
| 3,565 |
| 3,551 |
| 3,603 |
| - |
| (1) |
|
Amortization of deferred policy acquisition costs |
| 973 |
| 632 |
| 672 |
| 54 |
| (6) |
|
Non deferrable insurance commissions |
| 672 |
| 590 |
| 567 |
| 14 |
| 4 |
|
Advisory fee expenses |
| 322 |
| 316 |
| 322 |
| 2 |
| (2) |
|
General operating expenses |
| 1,642 |
| 1,616 |
| 1,653 |
| 2 |
| (2) |
|
Interest expense |
| 130 |
| 155 |
| 162 |
| (16) |
| (4) |
|
Total benefits, losses and expenses |
| 15,683 |
| 13,744 |
| 12,803 |
| 14 |
| 7 |
|
Adjusted pre-tax income | $ | 3,911 | $ | 3,531 | $ | 3,553 |
| 11 | % | (1) | % |
For additional information including the impact of actuarial assumptions on our Life and Retirement results, see Insurance Reserves – Life and Annuity Future Policy Benefits, Policyholder Contract Deposits and DAC – Update of Actuarial Assumptions by Business Segment.
Our insurance companies generate significant revenues from investment activities. As a result, the operating segments in Life and Retirement are significantly impacted by variances in net investment income on the asset portfolios that support insurance liabilities and surplus.
For additional information on our investment strategy, asset-liability management process and invested asset composition see Investments.
102 AIG | 2021 Form 10-K
Individual Retirement Results
Years Ended December 31, |
|
|
|
|
|
|
| Change | |||
(in millions) |
| 2021 |
| 2020 |
| 2019 |
| 2021 vs 2020 |
| 2020 vs 2019 |
|
Adjusted revenues: |
|
|
|
|
|
|
|
|
|
|
|
Premiums | $ | 191 | $ | 151 | $ | 104 |
| 26 | % | 45 | % |
Policy fees |
| 962 |
| 861 |
| 811 |
| 12 |
| 6 |
|
Net investment income |
| 4,338 |
| 4,131 |
| 4,122 |
| 5 |
| - |
|
Advisory fee and other income |
| 592 |
| 571 |
| 606 |
| 4 |
| (6) |
|
Total adjusted revenues |
| 6,083 |
| 5,714 |
| 5,643 |
| 6 |
| 1 |
|
Benefits and expenses: |
|
|
|
|
|
|
|
|
|
|
|
Policyholder benefits and losses incurred |
| 536 |
| 397 |
| 409 |
| 35 |
| (3) |
|
Interest credited to policyholder account balances |
| 1,787 |
| 1,751 |
| 1,726 |
| 2 |
| 1 |
|
Amortization of deferred policy acquisition costs |
| 736 |
| 590 |
| 449 |
| 25 |
| 31 |
|
Non deferrable insurance commissions |
| 397 |
| 334 |
| 318 |
| 19 |
| 5 |
|
Advisory fee expenses |
| 189 |
| 205 |
| 219 |
| (8) |
| (6) |
|
General operating expenses |
| 438 |
| 427 |
| 468 |
| 3 |
| (9) |
|
Interest expense |
| 61 |
| 72 |
| 77 |
| (15) |
| (6) |
|
Total benefits, losses and expenses |
| 4,144 |
| 3,776 |
| 3,666 |
| 10 |
| 3 |
|
Adjusted pre-tax income | $ | 1,939 | $ | 1,938 | $ | 1,977 |
| - | % | (2) | % |
Fixed annuities base net investment spread: |
|
|
|
|
|
|
|
|
|
|
|
Base yield* |
| 3.94 | % | 4.16 | % | 4.54 | % | (22) | bps | (38) | bps |
Cost of funds |
| 2.58 |
| 2.63 |
| 2.68 |
| (5) |
| (5) |
|
Fixed annuities base net investment spread |
| 1.36 | % | 1.53 | % | 1.86 | % | (17) | bps | (33) | bps |
Variable and index annuities base net investment spread: |
|
|
|
|
|
|
|
|
|
|
|
Base yield* |
| 3.83 | % | 3.94 | % | 4.41 | % | (11) | bps | (47) | bps |
Cost of funds |
| 1.32 |
| 1.31 |
| 1.36 |
| 1 |
| (5) |
|
Variable and index annuities base net investment spread |
| 2.51 | % | 2.63 | % | 3.05 | % | (12) | bps | (42) | bps |
* Includes returns from base portfolio including accretion and income (loss) from certain other invested assets.
Business and Financial Highlights
In 2021, disruptions due to the COVID-19 pandemic were less impactful than in 2020. Premiums and deposits increased $3.5 billion in 2021 compared to the prior year. Net flows improved $4.1 billion in 2021 compared to the prior year.
Adjusted pre-tax income increased $1 million in 2021 compared to the prior year primarily due to higher net investment income ($207 million) and higher policy and advisory fee income, net of advisory fee expenses ($138 million). Partially offsetting these increases was a net unfavorable impact from the review and update of actuarial assumptions ($195 million), higher DAC amortization and policyholder benefits net of premiums excluding the actuarial assumptions update ($82 million) compared to prior year and an increase in non-deferrable insurance commissions ($63 million).
AIG | 2021 Form 10-K 103
Individual Retirement Adjusted Pre-Tax Income (Loss) (in millions) | |
| 2021 and 2020 Comparison Adjusted pre-tax income increased $1 million primarily due to: increase in net investment income ($207 million) driven by higher private equity income ($256 million), higher commercial mortgage loan prepayment income ($29 million), and higher call and tender income ($24 million) partially offset by lower base portfolio income ($92 million) resulting from decreased reinvestment rates on the base portfolio; and higher policy and advisory fee income, net of advisory fee expenses ($138 million), primarily due to an increase in variable annuity separate account assets driven by robust equity market performance. Partially offsetting these increases were: a net unfavorable impact from the review and update of actuarial assumptions ($195 million); increase in DAC amortization and policyholder benefits net of premiums, excluding the actuarial assumption updates ($82 million), primarily due to higher growth in Index Annuities, coupled with the impact of lower portfolio yields on policyholder benefits; and higher non-deferrable insurance commissions ($63 million) primarily due to growth in variable annuity separate account assets. |
104 AIG | 2021 Form 10-K
Individual Retirement GAAP Premiums, Premiums and Deposits, Surrenders and Net Flows
For Individual Retirement, premiums primarily represent amounts received on life-contingent payout annuities. Premiums increased $40 million in 2021 compared to 2020.
Premiums and deposits are a non-GAAP financial measure that includes, in addition to direct and assumed premiums, deposits received on investment-type annuity contracts, FHLB funding agreements and mutual funds under administration.
Net flows for annuity products in Individual Retirement represent premiums and deposits less death, surrender and other withdrawal benefits. Net flows for mutual funds represent deposits less withdrawals.
The following table presents a reconciliation of Individual Retirement GAAP premiums to premiums and deposits:
Years Ended December 31, |
|
|
| |||
(in millions) |
| 2021 |
| 2020 |
| 2019 |
Premiums | $ | 191 | $ | 151 | $ | 104 |
Deposits |
| 13,732 |
| 10,228 |
| 14,804 |
Other |
| (7) |
| (9) |
| (9) |
Premiums and deposits | $ | 13,916 | $ | 10,370 | $ | 14,899 |
The following table presents surrenders as a percentage of average reserves:
Years Ended December 31, | 2021 |
| 2020 |
| 2019 |
|
Surrenders as a percentage of average reserves |
|
|
|
|
|
|
Fixed annuities | 7.2 | % | 5.9 | % | 7.2 | % |
Variable and index annuities | 6.5 |
| 5.6 |
| 6.4 |
|
Variable annuities | 7.3 |
| 6.2 |
| 7.2 |
|
Index annuities | 4.6 |
| 4.0 |
| 3.8 |
|
The following table presents reserves for fixed annuities and variable and index annuities by surrender charge category:
At December 31, | 2021 |
| 2020* | ||||||
|
|
|
| Variable |
|
|
|
| Variable |
|
| Fixed |
| and Index |
|
| Fixed |
| and Index |
(in millions) |
| Annuities |
| Annuities |
|
| Annuities |
| Annuities |
No surrender charge | $ | 26,419 | $ | 36,039 |
| $ | 27,110 | $ | 30,954 |
Greater than 0% - 2% |
| 2,091 |
| 12,607 |
|
| 2,298 |
| 11,647 |
Greater than 2% - 4% |
| 2,424 |
| 14,079 |
|
| 2,758 |
| 15,361 |
Greater than 4% |
| 16,443 |
| 35,708 |
|
| 16,163 |
| 32,261 |
Non-surrenderable |
| 2,373 |
| - |
|
| 2,214 |
| - |
Total reserves | $ | 49,750 | $ | 98,433 |
| $ | 50,543 | $ | 90,223 |
* Certain reclassifications have been made to the prior year amounts for consistency with the current year presentation.
Individual Retirement annuities are typically subject to a four- to seven-year surrender charge period, depending on the product. For fixed annuities, the proportion of reserves subject to surrender charge at December 31, 2021 increased compared to December 31, 2020. The increase in reserves with no surrender charge for variable and index annuities as of December 31, 2021 compared to December 31, 2020 was principally due to normal aging of business.
AIG | 2021 Form 10-K 105
A discussion of the significant variances in premiums and deposits and net flows for each product line follows:
Individual Retirement Premiums and Deposits (P&D) and Net Flows (in millions) | |
* Retail Mutual Fund net flows reflects customer activity and in 2021, it excludes $7.0 billion of funds (i) transferred as part of the Touchstone sale or (ii) liquidated. | 2021 and 2020 Comparison Fixed Annuities Net flows remained negative but improved ($108 million) over the prior year, primarily due to higher premiums and deposits ($476 million) driven in part by the prior year impact from distribution channel disruptions related to COVID-19, and lower death benefits ($222 million), partially offset by higher surrenders and withdrawals ($590 million) due to higher interest rates. Variable Annuities Variable annuity net flows improved ($690 million) primarily due to higher premium and deposits ($2.0 billion) driven in part due to prior year impact from distribution channel disruptions related to COVID-19, partially offset by higher surrenders and withdrawals ($1.1 billion) due to increase in number of policies coming out of surrender charge, and increase in lapses of policies with guaranteed minimum withdrawal benefits that are out of the money, and higher death benefits ($207 million). Index Annuities Net flows increased ($1.1 billion) primarily due to higher premiums and deposits ($1.5 billion) driven in part by fewer disruptions related to COVID-19, partially offset by higher surrenders and withdrawals ($366 million) due to increased competition and aging of the block, and death benefits ($78 million). Retail Mutual Funds Net flows remained negative but improved ($2.3 billion) due to lower surrenders and withdrawals ($2.7 billion) due to the Touchstone sale, partially offset by lower premiums and deposits ($477 million) due to investors’ continued preference for passive, low-fee investment vehicles, and the distribution channel disruptions related to COVID-19. Retail Mutual Funds net flows reflects customer activity and in 2021 exclude $7.0 billion of funds (i) transferred as part of the Touchstone sale or (ii) liquidated. For additional information regarding the sale of certain assets of the AIG Life and Retirement Retail Mutual Funds business, see Note 1 to the Consolidated Financial Statements. |
106 AIG | 2021 Form 10-K
Group Retirement Results
Years Ended December 31, |
|
|
|
| Change |
| |||||
(in millions) |
| 2021 |
| 2020 |
| 2019 |
| 2021 vs 2020 |
| 2020 vs 2019 |
|
Adjusted revenues: |
|
|
|
|
|
|
|
|
|
|
|
Premiums | $ | 22 | $ | 19 | $ | 16 |
| 16 | % | 19 | % |
Policy fees |
| 522 |
| 443 |
| 429 |
| 18 |
| 3 |
|
Net investment income |
| 2,410 |
| 2,236 |
| 2,240 |
| 8 |
| - |
|
Advisory fee and other income |
| 337 |
| 272 |
| 262 |
| 24 |
| 4 |
|
Total adjusted revenues |
| 3,291 |
| 2,970 |
| 2,947 |
| 11 |
| 26 |
|
Benefits and expenses: |
|
|
|
|
|
|
|
|
|
|
|
Policyholder benefits and losses incurred |
| 74 |
| 72 |
| 65 |
| 3 |
| 11 |
|
Interest credited to policyholder account balances |
| 1,150 |
| 1,123 |
| 1,147 |
| 2 |
| (2) |
|
Amortization of deferred policy acquisition costs |
| 61 |
| 7 |
| 81 |
| NM |
| (91) |
|
Non deferrable insurance commissions |
| 111 |
| 117 |
| 114 |
| (5) |
| 3 |
|
Advisory fee expenses |
| 133 |
| 111 |
| 103 |
| 20 |
| 8 |
|
General operating expenses |
| 443 |
| 485 |
| 456 |
| (9) |
| 6 |
|
Interest expense |
| 35 |
| 42 |
| 44 |
| (17) |
| (5) |
|
Total benefits, losses and expenses |
| 2,007 |
| 1,957 |
| 2,010 |
| 3 |
| (70) |
|
Adjusted pre-tax income | $ | 1,284 | $ | 1,013 | $ | 937 |
| 27 | % | 8 | % |
Base net investment spread: |
|
|
|
|
|
|
|
|
|
|
|
Base yield* |
| 4.11 | % | 4.26 | % | 4.53 | % | (15) | bps | (27) | bps |
Cost of funds |
| 2.61 |
| 2.65 |
| 2.72 |
| (4) |
| (7) |
|
Base net investment spread |
| 1.50 | % | 1.61 | % | 1.81 | % | (11) | bps | (20) | bps |
* Includes returns from base portfolio including accretion and income (loss) from certain other invested assets.
Business and Financial Highlights
Group Retirement is focused on implementing initiatives to grow its business. However, external factors, including increased competition and the consolidation of healthcare providers and other employers in target markets, continue to impact Group Retirement’s customer retention. Premiums and deposits increased $270 million in 2021 compared to the prior year. Net flows remained negative and deteriorated $1.3 billion in 2021 compared to the prior year.
Adjusted pre-tax income increased $271 million in 2021 compared to the prior year primarily from higher net investment income ($174 million), higher policy and advisory fee income, net of advisory fee expenses ($122 million) and lower general operating expenses ($42 million). Partially offsetting these increases was a net unfavorable impact from the review and update of actuarial assumptions ($70 million).
AIG | 2021 Form 10-K 107
Group Retirement Adjusted Pre-Tax Income (Loss) (in millions) | |
| 2021 and 2020 Comparison Adjusted pre-tax income increased $271 million primarily due to: higher net investment income ($174 million) primarily driven by higher private equity returns ($158 million) and higher call and tender income ($32 million) partially offset by lower base portfolio income net of interest credited ($31 million) primarily driven by decreased reinvestment yields; higher policy and advisory fee income, net of advisory fee expenses, ($122 million) due to an increase in separate account, mutual fund, and advisory average assets; and lower general operating expenses ($42 million) primarily due to decreased regulatory expenses. Partially offsetting these increases was: a net unfavorable impact from the review and update of actuarial assumptions ($70 million). |
Group Retirement GAAP Premiums, Premiums and Deposits, Surrenders and Net Flows
For Group Retirement, premiums primarily represent amounts received on life-contingent payout annuities. Premiums in 2021, which primarily represents immediate annuities, increased $3 million compared to 2020.
Premiums and deposits are a non-GAAP financial measure that includes, in addition to direct and assumed premiums, deposits received on investment-type annuity contracts, FHLB funding agreements and mutual funds under administration.
Net flows for annuity products included in Group Retirement represent premiums and deposits less death, surrender and other withdrawal benefits. Net flows for mutual funds represent deposits less withdrawals. Client deposits into advisory and brokerage accounts less total client withdrawals from advisory and brokerage accounts, are not included in net flows, but do contribute to growth in assets under administration and advisory fee income.
The following table presents a reconciliation of Group Retirement GAAP premiums to premiums and deposits:
Years Ended December 31, |
|
|
| |||
(in millions) |
| 2021 |
| 2020 |
| 2019 |
Premiums | $ | 22 | $ | 19 | $ | 16 |
Deposits |
| 7,744 |
| 7,477 |
| 8,330 |
Premiums and deposits | $ | 7,766 | $ | 7,496 | $ | 8,346 |
The following table presents Group Retirement surrenders as a percentage of average reserves and mutual funds under administration:
Years Ended December 31, | 2021 |
| 2020 |
| 2019 |
|
Surrenders as a percentage of average reserves and mutual funds | 8.8 | % | 8.6 | % | 10.7 | % |
108 AIG | 2021 Form 10-K
The following table presents reserves for Group Retirement annuities by surrender charge category:
At December 31, |
|
|
|
|
|
|
(in millions) |
| 2021 | (a) |
| 2020 | (a) |
No surrender charge(b) | $ | 81,132 |
| $ | 77,507 |
|
Greater than 0% - 2% |
| 716 |
|
| 565 |
|
Greater than 2% - 4% |
| 857 |
|
| 829 |
|
Greater than 4% |
| 6,197 |
|
| 6,119 |
|
Non-surrenderable |
| 810 |
|
| 616 |
|
Total reserves | $ | 89,712 |
| $ | 85,636 |
|
(a) Excludes mutual fund assets under administration of $28.8 billion and $25.0 billion at December 31, 2021 and 2020, respectively.
(b) Group Retirement amounts in this category include general account reserves of approximately $4.7 billion at both December 31, 2021 and 2020, which are subject to 20 percent annual withdrawal limitations at the participant level and general account reserves of $5.7 billion and $5.2 billion at December 31, 2021 and 2020, respectively, which are subject to 20 percent annual withdrawal limitations at the plan level.
Group Retirement annuity deposits are typically subject to a five- to seven-year surrender charge period, depending on the product. At December 31, 2021, Group Retirement annuity reserves with no surrender charge increased compared to December 31, 2020 primarily due to growth in assets under management.
A discussion of the significant variances in premiums and deposits and net flows follows:
Group Retirement Premiums and Deposits and Net Flows (in millions) | |
| 2021 and 2020 Comparison Net flows remained negative and deteriorated ($1.3 billion) due to higher surrenders, withdrawals and death benefits ($1.6 billion) partially offset by higher deposits ($0.3 billion). In general, net outflows are concentrated in fixed annuity products with higher contractual guaranteed minimum crediting rates. Large plan acquisitions and surrenders also contributed to the period over period volatility. In 2021, large plan activity contributed net negative flows of $0.1 billion compared to $0.4 billion of net negative flows in the same period in the prior year. |
AIG | 2021 Form 10-K 109
Life Insurance Results
Years Ended December 31, |
|
|
|
|
| Percentage Change |
| ||||
(in millions) |
| 2021 |
| 2020 |
| 2019 |
| 2021 vs 2020 |
| 2020 vs 2019 |
|
Adjusted revenues: |
|
|
|
|
|
|
|
|
|
|
|
Premiums | $ | 2,051 | $ | 1,915 | $ | 1,805 |
| 7 | % | 6 | % |
Policy fees |
| 1,380 |
| 1,384 |
| 1,495 |
| - |
| (7) |
|
Net investment income |
| 1,619 |
| 1,526 |
| 1,483 |
| 6 |
| 3 |
|
Other income |
| 62 |
| 52 |
| 42 |
| 19 |
| 24 |
|
Total adjusted revenues |
| 5,112 |
| 4,877 |
| 4,825 |
| 5 |
| 1 |
|
Benefits and expenses: |
|
|
|
|
|
|
|
|
|
|
|
Policyholder benefits and losses incurred |
| 3,636 |
| 3,569 |
| 3,189 |
| 2 |
| 12 |
|
Interest credited to policyholder account balances |
| 354 |
| 373 |
| 374 |
| (5) |
| - |
|
Amortization of deferred policy acquisition costs |
| 170 |
| 30 |
| 137 |
| 467 |
| (78) |
|
Non deferrable insurance commissions |
| 137 |
| 108 |
| 104 |
| 27 |
| 4 |
|
General operating expenses |
| 684 |
| 625 |
| 660 |
| 9 |
| (5) |
|
Interest expense |
| 25 |
| 30 |
| 30 |
| (17) |
| - |
|
Total benefits, losses and expenses |
| 5,006 |
| 4,735 |
| 4,494 |
| 6 |
| 5 |
|
Adjusted pre-tax income | $ | 106 | $ | 142 | $ | 331 |
| (25) | % | (57) | % |
Business and Financial Highlights
Life Insurance is focused on selling profitable new products through strategic channels to enhance future returns. Adjusted pre-tax income decreased $36 million in 2021 compared to the prior year primarily due to a decrease in premiums and policy fees, net of policyholder benefits, excluding actuarial assumptions update ($301 million) primarily due to higher mortality, partially offset by higher net favorable impact from the review and update of actuarial assumptions ($207 million) and higher net investment income ($93 million).
Life Insurance Adjusted Pre-Tax Income (Loss) (in millions) | |
| 2021 and 2020 Comparison Adjusted pre-tax income decreased $36 million primarily due to: unfavorable premiums and policy fees, net of policyholder benefits, excluding actuarial assumptions update ($301 million) due to higher mortality. Partially offsetting this decrease were: higher net favorable impact from the review and update of actuarial assumptions ($207 million); and higher net investment income ($93 million), primarily driven by higher private equity returns ($104 million) due to stronger equity market performance, higher gains on calls ($30 million) partially offset by lower base portfolio income ($39 million) driven by reduced fixed asset income. |

110 AIG | 2021 Form 10-K
Life Insurance GAAP Premiums and Premiums and Deposits
Premiums for Life Insurance represent amounts received on traditional life insurance policies, primarily term life and international life and health. Premiums, excluding the effect of foreign exchange, increased $96 million in 2021 compared to 2020. Premiums and deposits for Life Insurance is a non-GAAP financial measure that includes direct and assumed premiums as well as deposits received on universal life insurance.
The following table presents a reconciliation of Life Insurance GAAP premiums to premiums and deposits:
Years Ended December 31, |
|
|
| |||
(in millions) |
| 2021 |
| 2020 |
| 2019 |
Premiums | $ | 2,051 | $ | 1,915 | $ | 1,805 |
Deposits |
| 1,635 |
| 1,648 |
| 1,667 |
Other* |
| 964 |
| 850 |
| 810 |
Premiums and deposits | $ | 4,650 | $ | 4,413 | $ | 4,282 |
* Other principally consists of adding back ceded premiums to reflect the gross premiums and deposits.
A discussion of the significant variances in premiums and deposits follows:
Life Insurance Premiums and Deposits (in millions) | |
| Premiums and deposits, excluding the effect of foreign exchange, increased $178 million in 2021 compared to 2020 primarily due to growth in international life premiums. |
AIG | 2021 Form 10-K 111
Institutional markets Results
Years Ended December 31, |
|
|
|
| Percentage Change | ||||||
(in millions) |
| 2021 |
| 2020 |
| 2019 |
| 2021 vs 2020 |
| 2020 vs 2019 |
|
Adjusted revenues: |
|
|
|
|
|
|
|
|
|
|
|
Premiums | $ | 3,765 | $ | 2,539 | $ | 1,864 |
| 48 | % | 36 | % |
Policy fees |
| 187 |
| 186 |
| 188 |
| 1 |
| (1) |
|
Net investment income |
| 1,154 |
| 988 |
| 888 |
| 17 |
| 11 |
|
Other income |
| 2 |
| 1 |
| 1 |
| 100 |
| - |
|
Total adjusted revenues |
| 5,108 |
| 3,714 |
| 2,941 |
| 38 |
| 26 |
|
Benefits and expenses: |
|
|
|
|
|
|
|
|
|
|
|
Policyholder benefits and losses incurred |
| 4,133 |
| 2,846 |
| 2,161 |
| 45 |
| 32 |
|
Interest credited to policyholder account balances |
| 274 |
| 304 |
| 356 |
| (10) |
| (15) |
|
Amortization of deferred policy acquisition costs |
| 6 |
| 5 |
| 5 |
| 20 |
| - |
|
Non deferrable insurance commissions |
| 27 |
| 31 |
| 31 |
| (13) |
| - |
|
General operating expenses |
| 77 |
| 79 |
| 69 |
| (3) |
| 14 |
|
Interest expense |
| 9 |
| 11 |
| 11 |
| (18) |
| - |
|
Total benefits, losses and expenses |
| 4,526 |
| 3,276 |
| 2,633 |
| 38 |
| 24 |
|
Adjusted pre-tax income | $ | 582 | $ | 438 | $ | 308 |
| 33 | % | 42 | % |
Business and Financial Highlights
Institutional Markets is focused on opportunities to grow its portfolio while maintaining pricing discipline. Product distribution continues to be strong. Growth in assets under management in recent years has partially driven higher net investment income and adjusted pre-tax income. Adjusted pre-tax income increased $144 million in 2021 compared to the prior year.
Institutional Markets Adjusted Pre-Tax Income (Loss) (in millions) | |
| 2021 and 2020 Comparison Adjusted pre-tax income increased $144 million primarily due to: Higher premiums on pension risk transfer business, partially offset by lower premiums on structured settlement business ($1.2 billion); higher net investment income ($166 million) primarily due to private equity returns ($126 million) and higher base portfolio income ($36 million) driven by growth in average invested assets; and lower interest credited to policyholder account balances ($30 million) due to interest rate impacts on the GIC business and the fair value changes of certain GICs and hedging instruments. Partially offsetting these increases was: an increase in policyholder benefits and losses incurred (including interest accretion) on pension risk transfer and structured settlement products driven by new business ($1.3 billion). |
112 AIG | 2021 Form 10-K
Institutional markets GAAP Premiums and Premiums and Deposits
Premiums for Institutional Markets primarily represent amounts received on pension risk transfer or structured settlement annuities with life contingencies. Premiums increased $1.2 billion in 2021 compared to the prior year primarily driven by the pension risk transfer business (direct and assumed reinsurance), partially offset by a decrease in structured settlement annuities with life contingencies.
Premiums and deposits for Institutional Markets is a non-GAAP financial measure that includes direct and assumed premiums as well as deposits received on investment-type annuity contracts. Deposits primarily include GICs, FHLB funding agreements and structured settlement annuities with no life contingencies.
The following table presents a reconciliation of Institutional Markets GAAP premiums to premiums and deposits:
Years Ended December 31, |
|
| ||||
(in millions) |
| 2021 |
| 2020 |
| 2019 |
Premiums | $ | 3,765 | $ | 2,539 | $ | 1,864 |
Deposits |
| 1,158 |
| 2,281 |
| 931 |
Other* |
| 25 |
| 26 |
| 27 |
Premiums and deposits | $ | 4,948 | $ | 4,846 | $ | 2,822 |
* Other principally consists of adding back ceded premiums to reflect the gross premiums and deposits.
A discussion of the significant variances in premiums and deposits follows:
Institutional Markets Premiums and Deposits (in millions) | |
| Premiums and deposits increased ($102 million) in 2021 primarily due to higher premiums on pension risk transfer ($1.3 billion), partially offset by lower deposits on GICs ($1.1 billion) and structured settlement annuities ($115 million).
|

AIG | 2021 Form 10-K 113
Other Operations |
Other Operations primarily consists of income from assets held by AIG Parent and other corporate subsidiaries, deferred tax assets related to tax attributes, corporate expenses and intercompany eliminations, our institutional asset management business and results of our consolidated investment entities, General Insurance portfolios in run-off as well as the historical results of our legacy insurance lines ceded to Fortitude Re.
Other Operations Results
Years Ended December 31, |
|
|
|
| Percentage Change | ||||||
(in millions) |
| 2021 |
| 2020 |
| 2019 |
| 2021 vs. 2020 |
| 2020 vs. 2019 |
|
Adjusted revenues: |
|
|
|
|
|
|
|
|
|
|
|
Premiums | $ | 186 | $ | 233 | $ | 334 |
| (20) | % | (30) | % |
Policy fees |
| - |
| 43 |
| 92 |
| NM |
| (53) |
|
Net investment income: |
|
|
|
|
|
|
|
|
|
|
|
Interest and dividends |
| 169 |
| 905 |
| 2,015 |
| (81) |
| (55) |
|
Alternative investments |
| 919 |
| 82 |
| 252 |
| NM |
| (67) |
|
Other investment income |
| 65 |
| 147 |
| 407 |
| (56) |
| (64) |
|
Investment expenses |
| (41) |
| (47) |
| (76) |
| 13 |
| 38 |
|
Total net investment income |
| 1,112 |
| 1,087 |
| 2,598 |
| 2 |
| (58) |
|
Other income |
| 40 |
| 22 |
| 36 |
| 82 |
| (39) |
|
Total adjusted revenues |
| 1,338 |
| 1,385 |
| 3,060 |
| (3) |
| (55) |
|
Benefits, losses and expenses: |
|
|
|
|
|
|
|
|
|
|
|
Policyholder benefits and losses incurred |
| 250 |
| 816 |
| 1,650 |
| (69) |
| (51) |
|
Interest credited to policyholder account balances |
| 1 |
| 89 |
| 208 |
| (99) |
| (57) |
|
Acquisition expenses: |
|
|
|
|
|
|
|
|
|
|
|
Amortization of deferred policy acquisition costs |
| 37 |
| 50 |
| 64 |
| (26) |
| (22) |
|
Other acquisition expenses |
| (1) |
| 1 |
| 9 |
| NM |
| (89) |
|
Total acquisition expenses |
| 36 |
| 51 |
| 73 |
| (29) |
| (30) |
|
General operating expenses: |
|
|
|
|
|
|
|
|
|
|
|
Corporate and Other |
| 1,137 |
| 1,004 |
| 1,099 |
| 13 |
| (9) |
|
Asset Management |
| 72 |
| 42 |
| 42 |
| 71 |
| - |
|
Amortization of intangible assets |
| 40 |
| 40 |
| 40 |
| - |
| - |
|
Total General operating expenses |
| 1,249 |
| 1,086 |
| 1,181 |
| 15 |
| (8) |
|
Interest expense: |
|
|
|
|
|
|
|
|
|
|
|
Corporate and Other |
| 1,032 |
| 1,148 |
| 1,089 |
| (10) |
| 5 |
|
Asset Management* |
| 188 |
| 158 |
| 171 |
| 19 |
| (8) |
|
Total interest expense |
| 1,220 |
| 1,306 |
| 1,260 |
| (7) |
| 4 |
|
Total benefits, losses and expenses |
| 2,756 |
| 3,348 |
| 4,372 |
| (18) |
| (23) |
|
Adjusted pre-tax income (loss) before consolidation and |
|
|
|
|
|
|
|
|
|
|
|
eliminations |
| (1,418) |
| (1,963) |
| (1,312) |
| 28 |
| (50) |
|
Consolidation and eliminations |
| (932) |
| (466) |
| (304) |
| (100) |
| (53) |
|
Adjusted pre-tax loss | $ | (2,350) | $ | (2,429) | $ | (1,616) |
| 3 | % | (50) | % |
|
|
|
|
|
|
|
|
|
|
|
|
Adjusted pre-tax income (loss) by activities: |
|
|
|
|
|
|
|
|
|
|
|
Corporate and Other | $ | (2,329) | $ | (2,041) | $ | (1,378) |
| (14) | % | (48) | % |
Asset Management |
| 911 |
| 78 |
| 66 |
| NM |
| 18 |
|
Consolidation and eliminations |
| (932) |
| (466) |
| (304) |
| (100) |
| (53) |
|
Adjusted pre-tax loss | $ | (2,350) | $ | (2,429) | $ | (1,616) |
| 3 | % | (50) | % |
* Interest – Asset Management primarily represents interest expense on consolidated investment entities of $182 million, $148 million and $158 million in 2021, 2020 and 2019, respectively.
114 AIG | 2021 Form 10-K
2021 and 2020 Comparison
Adjusted pre-tax loss before consolidation and eliminations of $1.4 billion in 2021 compared to $2.0 billion in 2020, a decrease of $545 million, was primarily due to the sale of a majority of the interest in Fortitude Holdings on June 2, 2020, as prior period results included adjusted pre-tax loss of $233 million. Excluding the results of Fortitude Re, adjusted pre-tax loss decreased $312 million primarily due to:
higher net investment income associated with consolidated investment entities of $835 million, which was partially offset by a decline in net mark to market gains on CDO securities of $280 million; and
lower corporate interest expense primarily driven by interest savings resulting from redemptions of $3.0 billion of debt in 2021 ($71 million) and expiration of $1.3 billion of debt in 2020 ($58 million), partially offset by interest expense resulting from $4.1 billion of new debt issuances in 2020 ($50 million).
The decrease in adjusted pre-tax loss was partially offset by:
higher underwriting loss attributable to net prior year development in 2021 of $87 million and higher catastrophe activity of $44 million within Other Operations Run-off, primarily attributable to Blackboard; and
higher corporate general operating expenses of $143 million, including increases in performance-based employee compensation.
Adjusted pre-tax loss on consolidation and eliminations of $932 million in 2021 compared to $466 million in 2020, an increase of $466 million, was primarily due to the elimination of the insurance companies’ net investment income from their investment in the consolidated investment entities of $462 million.
AIG | 2021 Form 10-K 115
Investments
Overview
Our investment strategies are tailored to the specific business needs of each operating unit by targeting an asset allocation mix that supports estimated cash flows of our outstanding liabilities and provides diversification from an asset class, sector, issuer, and geographic perspective. The primary objectives are generation of investment income, preservation of capital, liquidity management and growth of surplus. The majority of assets backing our insurance liabilities consist of fixed maturity securities.
The worldwide health and economic impact of COVID-19 continues to evolve, influenced by the scope, severity and duration of the pandemic as well as the actions of governments, judiciaries, legislative bodies, regulators and other third parties in response, including the distribution and effectiveness of vaccinations, all of which are subject to continuing uncertainty. Weak initial economic conditions resulting from COVID-19 led to price declines in our investment portfolio from spread widening. Governments and monetary authorities acted swiftly with intervention aimed at stimulating growth, which resulted in a sharp increase in asset prices back to values that existed pre-COVID. Further recognition of credit losses and increases in our allowances for credit losses could result if new business closures are imposed or economic conditions worsen in response to future resurgence of the virus.
INVESTMENT HIGHLIGHTS IN 2021 |
A rise in interest rates resulted in a net unrealized loss movement in our investment portfolio. Net unrealized gains in our available for sale portfolio decreased to approximately $18.1 billion as of December 31, 2021 from approximately $27.4 billion as of December 31, 2020. We continued to make investments in structured securities and other fixed maturity securities with favorable risk compared to return characteristics to improve yields and increase net investment income. We experienced an increase in net investment income in the year ended December 31, 2021 compared to the prior year due primarily to higher income on our Private Equity alternative investments that directionally followed the positive returns achieved in equity markets. Blended investment yields on new investments were lower than blended rates on investments that were sold, matured or called. |
Investment Strategies
Investment strategies are assessed at the segment level and involve considerations that include local and general market conditions, duration and cash flow management, risk appetite and volatility constraints, rating agency and regulatory capital considerations, and tax and legal investment limitations.
Some of our key investment strategies are as follows:
Our fundamental strategy across the portfolios is to seek investments with similar characteristics to the associated insurance liabilities to the extent practicable.
AIG embeds Environmental, Social and Governance (ESG) considerations in its fundamental investment analysis of the companies or projects we invest in to ensure that they have sustainable earnings over the full term of our investment, as material, relevant and available. AIG considers internal and external factors and evaluates changes in consumer behavior, industry trends related to ESG factors as well as the ability of the management of companies to respond appropriately to these changes in order to maintain their competitive advantage.
We seek to originate investments that offer enhanced yield through illiquidity premiums, such as private placements and commercial mortgage loans, which also add portfolio diversification. These assets typically afford credit protections through covenants, ability to customize structures that meet our insurance liability needs, and deeper due diligence given information access.
Given our global presence, we have access to assets that provide diversification from local markets. To the extent we purchase these investments, we generally hedge any currency risk using derivatives, which could provide opportunities to earn higher risk adjusted returns compared to assets in the functional currency.
116 AIG | 2021 Form 10-K
AIG Parent, included in Other Operations, actively manages its assets and liabilities, counterparties and duration. AIG Parent’s liquidity sources are held primarily in the form of cash, short-term investments and publicly traded, investment grade rated fixed maturity securities that can be readily monetized through sales or repurchase agreements. This strategy allows us to both diversify our sources of liquidity and reduce the cost of maintaining sufficient liquidity.
Within the U.S., the Life and Retirement and General Insurance investments are generally split between reserve backing and surplus portfolios.
– Insurance reserves are backed by mainly investment grade fixed maturity securities that meet our duration, risk-return, tax, liquidity, credit quality and diversification objectives. We assess asset classes based on their fundamental underlying risk factors, including credit (public and private), commercial real estate and residential real estate regardless of whether such investments are bonds, loans, or structured products.
– Surplus investments seek to enhance portfolio returns and are generally comprised of a mix of fixed maturity investment grade and below investment grade securities and various alternative asset classes, including private equity, real estate equity, and hedge funds. Over the past few years, hedge fund investments have been reduced with more emphasis given to private equity, real estate and below investment grade credit.
Outside of the U.S., fixed maturity securities held by insurance companies consist primarily of investment-grade securities generally denominated in the currencies of the countries in which we operate.
Asset Liability Management
The investment strategy within the General Insurance companies focuses on growth of surplus, maintenance of sufficient liquidity for unanticipated insurance claims, and preservation of capital. General Insurance invests primarily in fixed maturity securities issued by corporations, municipalities and other governmental agencies; structured securities collateralized by, among other assets, residential and commercial real estate; and commercial mortgage loans. Fixed maturity securities of the General Insurance companies’ North America operations have an average duration of 3.9 years. Fixed maturity securities of the General Insurance companies’ International operations have an average duration of 4.3 years.
While invested assets backing reserves of the General Insurance companies are primarily invested in conventional liquid fixed maturity securities, we have continued to allocate to asset classes that offer higher yields through structural and illiquidity premiums, particularly in our North America operations. In addition, we continue to invest in both fixed rate and floating rate asset-backed investments to manage our exposure to potential changes in interest rates and inflation. We seek to diversify the portfolio across asset classes, sectors and issuers to mitigate idiosyncratic portfolio risks.
In addition, a portion of the surplus of General Insurance is invested in a diversified portfolio of alternative investments that seek to balance liquidity, volatility and growth of surplus. There is a higher allocation to equity-oriented investments in General Insurance surplus relative to other AIG portfolios given the underlying inflation risks inherent in that business. Although these alternative investments are subject to periodic earnings fluctuations, they have historically achieved yields in excess of the fixed maturity portfolio yields and have provided added diversification to the broader portfolio.
The investment strategy of the Life and Retirement companies is to provide net investment income to back liabilities that result in stable distributable earnings and enhance portfolio value, subject to asset liability management, capital, liquidity and regulatory constraints.
The Life and Retirement companies use asset-liability management as a primary tool to monitor and manage risk in their businesses. The Life and Retirement companies maintain a diversified, high-to-medium quality portfolio of fixed maturity securities issued by corporations, municipalities and other governmental agencies; structured securities collateralized by, among other assets, residential and commercial real estate; and commercial mortgage loans that, to the extent practicable, match the duration characteristics of the liabilities. We seek to diversify the portfolio across asset classes, sectors, and issuers to mitigate idiosyncratic portfolio risks. The investment portfolio of each product line is tailored to the specific characteristics of its insurance liabilities, and as a result, duration varies between distinct portfolios. The interest rate environment has a direct impact on the asset-liability management profile of the businesses, and an extended low interest rate environment may result in a lengthening of liability durations from initial estimates, primarily due to lower lapses, which may require us to further extend the duration of the investment portfolio. A further lengthening of the portfolio will be assessed in the context of available market opportunities as longer duration markets may not provide similar diversification benefits as shorter duration markets.
Fixed maturity securities of the Life and Retirement companies’ domestic operations have an average duration of 9.0 years.
In addition, the Life and Retirement companies seek to enhance surplus portfolio returns through investments in a diversified portfolio of alternative investments. Although these alternative investments are subject to periodic earnings fluctuations, they have historically achieved returns in excess of the fixed maturity portfolio returns.
AIG | 2021 Form 10-K 117
NAIC Designations of Fixed Maturity Securities
The Securities Valuation Office (SVO) of the NAIC evaluates the investments of U.S. insurers for statutory reporting purposes and assigns fixed maturity securities to one of six categories called ‘NAIC Designations.’ In general, NAIC Designations of ‘1’ highest quality, or ‘2’ high quality, include fixed maturity securities considered investment grade, while NAIC Designations of ‘3’ through ‘6’ generally include fixed maturity securities referred to as below investment grade. NAIC Designations for non-agency residential mortgage backed securities (RMBS) and commercial mortgage backed securities (CMBS) are calculated using third party modeling results provided through the NAIC. These methodologies result in an improved NAIC Designation for such securities compared to the rating typically assigned by the three major rating agencies. The following tables summarize the ratings distribution of AIG subsidiaries’ fixed maturity security portfolio by NAIC Designation, and the distribution by composite AIG credit rating, which is generally based on ratings of the three major rating agencies. For fixed maturity securities where no NAIC Designation is assigned or able to be calculated using third-party data, the NAIC Designation category used in the first table below reflects an internal rating.
The NAIC Designations presented below do not reflect the added granularity to the designation categories adopted by the NAIC in 2020, which further subdivide each category of fixed maturity securities by appending letter modifiers to the numerical designations.
For a full description of the composite AIG credit ratings see – Credit Ratings below.
The following table presents the fixed maturity security portfolio categorized by NAIC Designation, at fair value:
December 31, 2021 |
|
|
|
|
|
|
|
|
|
|
|
|
|
|
|
|
|
|
|
(in millions) |
|
|
|
|
|
|
|
|
|
|
|
|
|
|
|
|
|
|
|
|
|
|
|
|
|
|
|
|
|
|
|
|
|
|
| Total |
|
| |
|
|
|
|
|
| Total |
|
|
|
|
|
|
|
|
|
| Below |
|
|
|
|
|
|
|
| Investment |
|
|
|
|
|
|
|
|
|
| Investment |
|
|
NAIC Designation |
| 1 |
| 2 |
| Grade |
|
| 3 |
| 4 |
| 5 |
| 6 |
| Grade |
| Total |
Other fixed maturity securities | $ | 109,728 | $ | 88,546 | $ | 198,274 |
| $ | 8,936 | $ | 9,198 | $ | 1,152 | $ | 71 | $ | 19,357 | $ | 217,631 |
Mortgage-backed, asset-backed and collateralized |
| 58,558 |
| 5,583 |
| 64,141 |
|
| 210 |
| 130 |
| 26 |
| 1,340 |
| 1,706 |
| 65,847 |
Total* | $ | 168,286 | $ | 94,129 | $ | 262,415 |
| $ | 9,146 | $ | 9,328 | $ | 1,178 | $ | 1,411 | $ | 21,063 | $ | 283,478 |
* Excludes an insignificant amount of fixed maturity securities for which no NAIC Designation is available.
The following table presents the fixed maturity security portfolio categorized by composite AIG credit rating, at fair value:
December 31, 2021 |
|
|
|
|
|
|
|
|
|
|
|
|
|
|
|
|
|
(in millions) |
|
|
|
|
|
|
|
|
|
|
|
|
|
|
|
|
|
|
|
|
|
|
|
|
|
|
|
|
|
|
| Total |
|
| |
|
|
|
|
|
| Total |
|
|
|
|
|
|
|
| Below |
|
|
|
|
|
|
|
| Investment |
|
|
|
|
|
| CCC and |
| Investment |
|
|
Composite AIG Credit Rating |
| AAA/AA/A |
| BBB |
| Grade |
|
| BB |
| B |
| Lower |
| Grade |
| Total |
Other fixed maturity securities | $ | 114,232 | $ | 83,652 | $ | 197,884 |
| $ | 9,077 | $ | 7,734 | $ | 2,936 | $ | 19,747 | $ | 217,631 |
Mortgage-backed, asset-backed and collateralized |
| 50,430 |
| 6,217 |
| 56,647 |
|
| 495 |
| 478 |
| 8,227 |
| 9,200 |
| 65,847 |
Total* | $ | 164,662 | $ | 89,869 | $ | 254,531 |
| $ | 9,572 | $ | 8,212 | $ | 11,163 | $ | 28,947 | $ | 283,478 |
* Excludes an insignificant amount of fixed maturity securities for which no NAIC Designation is available.
Credit Ratings
At December 31, 2021, approximately 89 percent of our fixed maturity securities were held by our domestic entities. Approximately 89 percent of these securities were rated investment grade by one or more of the principal rating agencies. Our investment decision process relies primarily on internally generated fundamental analysis and internal risk ratings. Third-party rating services’ ratings and opinions provide one source of independent perspective for consideration in the internal analysis.
Moody’s Investors Service Inc. (Moody’s), Standard & Poor’s Financial Services LLC, a subsidiary of S&P Global Inc. (S&P), or similar foreign rating services rate a significant portion of our foreign entities’ fixed maturity securities portfolio. Rating services are not available for some foreign-issued securities. Our Credit Risk Management department closely reviews the credit quality of the foreign portfolio’s non-rated fixed maturity securities. At December 31, 2021, approximately 94 percent of such investments were either rated investment grade or, on the basis of our internal analysis, were equivalent from a credit standpoint to securities rated investment grade. Approximately 27 percent of the foreign entities’ fixed maturity securities portfolio is comprised of sovereign fixed maturity securities supporting policy liabilities in the country of issuance.
118 AIG | 2021 Form 10-K
Composite AIG Credit Ratings
With respect to our fixed maturity securities, the credit ratings in the table below and in subsequent tables reflect: (i) a composite of the ratings of the three major rating agencies, or when agency ratings are not available, the NAIC designation assigned by the NAIC SVO (98 percent of total fixed maturity securities), or (ii) our internal ratings when these investments have not been rated by any of the major rating agencies or the NAIC. The “Non-rated” category in those tables consists of fixed maturity securities that have not been rated by any of the major rating agencies, the NAIC or us.
For information regarding credit risks associated with Investments see Enterprise Risk Management.
The following table presents the composite AIG credit ratings of our fixed maturity securities calculated on the basis of their fair value:
| Available for Sale |
| Other |
| Total |
| ||||||||||||
| December 31, |
| December 31, |
| December 31, |
| December 31, |
| December 31, |
| December 31, |
| ||||||
(in millions) |
| 2021 |
|
| 2020 |
|
| 2021 |
|
| 2020 |
|
| 2021 |
|
| 2020 |
|
Rating: |
|
|
|
|
|
|
|
|
|
|
|
|
|
|
|
|
|
|
Other fixed maturity |
|
|
|
|
|
|
|
|
|
|
|
|
|
|
|
|
|
|
securities |
|
|
|
|
|
|
|
|
|
|
|
|
|
|
|
|
|
|
AAA | $ | 15,578 |
| $ | 11,758 |
| $ | 1,756 |
| $ | 1,803 |
| $ | 17,334 |
| $ | 13,561 |
|
AA |
| 39,110 |
|
| 36,146 |
|
| 282 |
|
| 42 |
|
| 39,392 |
|
| 36,188 |
|
A |
| 57,346 |
|
| 57,255 |
|
| 160 |
|
| 12 |
|
| 57,506 |
|
| 57,267 |
|
BBB |
| 83,192 |
|
| 80,878 |
|
| 461 |
|
| - |
|
| 83,653 |
|
| 80,878 |
|
Below investment grade |
| 17,795 |
|
| 18,087 |
|
| 314 |
|
| - |
|
| 18,109 |
|
| 18,087 |
|
Non-rated |
| 1,638 |
|
| 769 |
|
| - |
|
| - |
|
| 1,638 |
|
| 769 |
|
Total | $ | 214,659 |
| $ | 204,893 |
| $ | 2,973 |
| $ | 1,857 |
| $ | 217,632 |
| $ | 206,750 |
|
Mortgage-backed, asset- |
|
|
|
|
|
|
|
|
|
|
|
|
|
|
|
|
|
|
backed and collateralized |
|
|
|
|
|
|
|
|
|
|
|
|
|
|
|
|
|
|
AAA | $ | 27,144 |
| $ | 31,133 |
| $ | 232 |
| $ | 347 |
| $ | 27,376 |
| $ | 31,480 |
|
AA |
| 15,688 |
|
| 15,287 |
|
| 485 |
|
| 195 |
|
| 16,173 |
|
| 15,482 |
|
A |
| 6,685 |
|
| 6,711 |
|
| 197 |
|
| 145 |
|
| 6,882 |
|
| 6,856 |
|
BBB |
| 5,492 |
|
| 4,137 |
|
| 725 |
|
| 343 |
|
| 6,217 |
|
| 4,480 |
|
Below investment grade |
| 7,508 |
|
| 9,281 |
|
| 1,462 |
|
| 2,165 |
|
| 8,970 |
|
| 11,446 |
|
Non-rated |
| 26 |
|
| 54 |
|
| 204 |
|
| 239 |
|
| 230 |
|
| 293 |
|
Total | $ | 62,543 |
| $ | 66,603 |
| $ | 3,305 |
| $ | 3,434 |
| $ | 65,848 |
| $ | 70,037 |
|
Total |
|
|
|
|
|
|
|
|
|
|
|
|
|
|
|
|
|
|
AAA | $ | 42,722 |
| $ | 42,891 |
| $ | 1,988 |
| $ | 2,150 |
| $ | 44,710 |
| $ | 45,041 |
|
AA |
| 54,798 |
|
| 51,433 |
|
| 767 |
|
| 237 |
|
| 55,565 |
|
| 51,670 |
|
A |
| 64,031 |
|
| 63,966 |
|
| 357 |
|
| 157 |
|
| 64,388 |
|
| 64,123 |
|
BBB |
| 88,684 |
|
| 85,015 |
|
| 1,186 |
|
| 343 |
|
| 89,870 |
|
| 85,358 |
|
Below investment grade |
| 25,303 |
|
| 27,368 |
|
| 1,776 |
|
| 2,165 |
|
| 27,079 |
|
| 29,533 |
|
Non-rated |
| 1,664 |
|
| 823 |
|
| 204 |
|
| 239 |
|
| 1,868 |
|
| 1,062 |
|
Total | $ | 277,202 |
| $ | 271,496 |
| $ | 6,278 |
| $ | 5,291 |
| $ | 283,480 |
| $ | 276,787 |
|
AIG | 2021 Form 10-K 119
Available-for-Sale Investments
The following table presents the fair value of our available-for-sale securities:
|
|
|
|
|
|
|
| Fair Value at |
| Fair Value at |
|
|
|
|
|
|
|
| December 31, |
| December 31, |
(in millions) |
|
|
|
|
|
|
| 2021 |
| 2020 |
Bonds available for sale: |
|
|
|
|
|
|
|
|
|
|
U.S. government and government sponsored entities |
|
|
|
|
|
| $ | 8,194 | $ | 4,126 |
Obligations of states, municipalities and political subdivisions |
|
|
|
|
|
|
| 14,527 |
| 16,124 |
Non-U.S. governments |
|
|
|
|
|
|
| 16,330 |
| 15,345 |
Corporate debt |
|
|
|
|
|
|
| 175,608 |
| 169,298 |
Mortgage-backed, asset-backed and collateralized: |
|
|
|
|
|
|
|
|
|
|
RMBS |
|
|
|
|
|
|
| 27,287 |
| 31,465 |
CMBS |
|
|
|
|
|
|
| 15,809 |
| 16,133 |
CDO/ABS |
|
|
|
|
|
|
| 19,447 |
| 19,005 |
Total mortgage-backed, asset-backed and collateralized |
|
|
|
|
|
|
| 62,543 |
| 66,603 |
Total bonds available for sale* |
|
|
|
|
|
| $ | 277,202 | $ | 271,496 |
* At December 31, 2021 and 2020, the fair value of bonds available for sale held by us that were below investment grade or not rated totaled $27 billion and $28.2 billion, respectively.
The following table presents the fair value of our aggregate credit exposures to non-U.S. governments for our fixed maturity securities:
| December 31, |
| December 31, | ||
(in millions) |
| 2021 |
|
| 2020 |
Canada | $ | 1,233 |
| $ | 986 |
Japan |
| 1,230 |
|
| 1,510 |
United Kingdom |
| 1,031 |
|
| 820 |
France |
| 731 |
|
| 790 |
Germany |
| 702 |
|
| 642 |
Indonesia |
| 634 |
|
| 554 |
Israel |
| 515 |
|
| 535 |
Chile |
| 511 |
|
| 398 |
United Arab Emirates |
| 484 |
|
| 519 |
Mexico |
| 481 |
|
| 358 |
Other |
| 8,854 |
|
| 8,233 |
Total | $ | 16,406 |
| $ | 15,345 |
120 AIG | 2021 Form 10-K
The following table presents the fair value of our aggregate European credit exposures by major sector for our fixed maturity securities:
| December 31, 2021 |
|
| |||||||||
|
|
|
|
|
| Non- |
|
|
|
| December 31, | |
|
|
|
| Financial |
| Financial |
| Structured |
|
|
| 2020 |
(in millions) |
| Sovereign |
| Institution |
| Corporates |
| Products |
| Total |
| Total |
Euro-Zone countries: |
|
|
|
|
|
|
|
|
|
|
|
|
France | $ | 731 | $ | 1,745 | $ | 1,394 | $ | - | $ | 3,870 | $ | 4,206 |
Germany |
| 702 |
| 268 |
| 2,640 |
| - |
| 3,610 |
| 3,691 |
Netherlands |
| 249 |
| 1,070 |
| 1,286 |
| 47 |
| 2,652 |
| 2,804 |
Ireland |
| 11 |
| 81 |
| 506 |
| 1,360 |
| 1,958 |
| 2,162 |
Belgium |
| 119 |
| 299 |
| 1,162 |
| 40 |
| 1,620 |
| 1,538 |
Spain |
| 24 |
| 365 |
| 499 |
| - |
| 888 |
| 989 |
Luxembourg |
| 80 |
| 416 |
| 384 |
| - |
| 880 |
| 712 |
Italy |
| 21 |
| 106 |
| 509 |
| - |
| 636 |
| 580 |
Denmark |
| 236 |
| 95 |
| 187 |
| - |
| 518 |
| 539 |
Finland |
| 71 |
| 36 |
| 43 |
| - |
| 150 |
| 123 |
Other Euro-Zone |
| 347 |
| 2 |
| 30 |
| - |
| 379 |
| 482 |
Total Euro-Zone | $ | 2,591 | $ | 4,483 | $ | 8,640 | $ | 1,447 | $ | 17,161 | $ | 17,826 |
Remainder of Europe: |
|
|
|
|
|
|
|
|
|
|
|
|
United Kingdom | $ | 1,031 | $ | 4,846 | $ | 9,419 | $ | 1,612 | $ | 16,908 | $ | 17,066 |
Switzerland |
| 18 |
| 982 |
| 884 |
| - |
| 1,884 |
| 1,778 |
Norway |
| 376 |
| 133 |
| 288 |
| - |
| 797 |
| 556 |
Sweden |
| 188 |
| 221 |
| 128 |
| - |
| 537 |
| 646 |
Russian Federation |
| 198 |
| 29 |
| 132 |
| - |
| 359 |
| 407 |
Other - Remainder of Europe |
| 90 |
| 269 |
| 127 |
| - |
| 486 |
| 227 |
Total - Remainder of Europe | $ | 1,901 | $ | 6,480 | $ | 10,978 | $ | 1,612 | $ | 20,971 | $ | 20,680 |
Total | $ | 4,492 | $ | 10,963 | $ | 19,618 | $ | 3,059 | $ | 38,132 | $ | 38,506 |
Investments in Municipal Bonds
At December 31, 2021, the U.S. municipal bond portfolio was composed primarily of essential service revenue bonds and high-quality tax-exempt bonds with 95 percent of the portfolio rated A or higher.
The following table presents the fair values of our available for sale U.S. municipal bond portfolio by state and municipal bond type:
| December 31, 2021 |
|
| |||||||
|
| State |
| Local |
|
|
| Total | December 31, | |
|
| General |
| General |
|
|
| Fair |
| 2020 |
(in millions) |
| Obligation |
| Obligation |
| Revenue |
| Value |
| Total Fair Value |
California | $ | 720 | $ | 413 | $ | 1,975 | $ | 3,108 | $ | 3,301 |
New York |
| 7 |
| 223 |
| 2,535 |
| 2,765 |
| 3,135 |
Texas |
| 51 |
| 519 |
| 846 |
| 1,416 |
| 1,553 |
Illinois |
| 88 |
| 69 |
| 852 |
| 1,009 |
| 1,106 |
Massachusetts |
| 313 |
| 23 |
| 330 |
| 666 |
| 800 |
Ohio |
| 9 |
| - |
| 479 |
| 488 |
| 542 |
Georgia |
| 102 |
| 76 |
| 296 |
| 474 |
| 494 |
Florida |
| 6 |
| - |
| 397 |
| 403 |
| 436 |
Pennsylvania |
| 17 |
| 2 |
| 378 |
| 397 |
| 399 |
Virginia |
| 10 |
| - |
| 370 |
| 380 |
| 456 |
Washington |
| 142 |
| 7 |
| 210 |
| 359 |
| 413 |
Washington, D.C. |
| 11 |
| - |
| 282 |
| 293 |
| 328 |
New Jersey |
| 12 |
| 1 |
| 269 |
| 282 |
| 269 |
All other states(a) |
| 315 |
| 175 |
| 1,997 |
| 2,487 |
| 2,892 |
Total(b)(c) | $ | 1,803 | $ | 1,508 | $ | 11,216 | $ | 14,527 | $ | 16,124 |
AIG | 2021 Form 10-K 121
(a) We did not have material credit exposure to the government of Puerto Rico.
(b) Excludes certain university and not-for-profit entities that issue their bonds in the corporate debt market. Includes industrial revenue bonds.
(c) Includes $532 million of pre-refunded municipal bonds.
Investments in Corporate Debt Securities
The following table presents the industry categories of our available for sale corporate debt securities:
|
| Fair Value at |
| Fair Value at |
Industry Category |
| December 31, |
| December 31, |
(in millions) |
| 2021 |
| 2020 |
Financial institutions: |
|
|
|
|
Money center/Global bank groups | $ | 10,053 | $ | 10,512 |
Regional banks – other |
| 434 |
| 627 |
Life insurance |
| 3,094 |
| 3,175 |
Securities firms and other finance companies |
| 350 |
| 312 |
Insurance non-life |
| 6,795 |
| 5,805 |
Regional banks – North America |
| 7,228 |
| 7,505 |
Other financial institutions |
| 18,255 |
| 15,581 |
Utilities |
| 24,180 |
| 23,470 |
Communications |
| 11,510 |
| 11,137 |
Consumer noncyclical |
| 24,411 |
| 24,826 |
Capital goods |
| 8,668 |
| 8,773 |
Energy |
| 13,506 |
| 13,293 |
Consumer cyclical |
| 13,279 |
| 13,213 |
Basic |
| 6,041 |
| 5,894 |
Other |
| 27,804 |
| 25,175 |
Total* | $ | 175,608 | $ | 169,298 |
* At December 31, 2021 and December 31, 2020, respectively, approximately 90 percent and 90 percent of these investments were rated investment grade.
Our investments in the energy category, as a percentage of total investments in available-for-sale fixed maturities, was 4.9 percent and 4.9 percent at December 31, 2021 and December 31, 2020, respectively. While the energy investments are primarily investment grade and are actively managed, the category continues to experience volatility that could adversely affect credit quality and fair value.
Investments in RMBS
The following table presents AIG’s RMBS available for sale securities:
|
|
|
|
|
|
|
|
|
|
| Fair Value at |
| Fair Value at |
|
|
|
|
|
|
|
|
|
|
| December 31, |
| December 31, |
(in millions) |
|
|
|
|
|
|
|
|
|
| 2021 |
| 2020 |
Agency RMBS |
|
|
|
|
|
|
|
|
| $ | 13,778 | $ | 15,816 |
Alt-A RMBS |
|
|
|
|
|
|
|
|
|
| 5,936 |
| 7,278 |
Subprime RMBS |
|
|
|
|
|
|
|
|
|
| 2,329 |
| 2,575 |
Prime non-agency |
|
|
|
|
|
|
|
|
|
| 3,058 |
| 3,847 |
Other housing related |
|
|
|
|
|
|
|
|
|
| 2,186 |
| 1,949 |
Total RMBS(a)(b) |
|
|
|
|
|
|
|
|
| $ | 27,287 | $ | 31,465 |
(a) Includes approximately $6.1 billion and $7.6 billion at December 31, 2021 and December 31, 2020, respectively, of certain RMBS that had experienced deterioration in credit quality since their origination. For additional discussion on Purchased Credit Impaired Securities see Note 5 to the Consolidated Financial Statements.
(b) The weighted average expected life was five years at December 31, 2021 and five years at December 31, 2020.
Our underwriting practices for investing in RMBS, other asset-backed securities (ABS) and CDOs take into consideration the quality of the originator, the manager, the servicer, security credit ratings, underlying characteristics of the mortgages, borrower characteristics, and the level of credit enhancement in the transaction.
122 AIG | 2021 Form 10-K
Investments in CMBS
The following table presents our CMBS available for sale securities:
|
|
|
|
|
|
|
|
|
|
|
|
|
| Fair Value at |
| Fair Value at |
|
|
|
|
|
|
|
|
|
|
|
| December 31, |
| December 31, | ||
(in millions) |
|
|
|
|
|
|
|
|
|
|
|
|
| 2021 |
| 2020 |
CMBS (traditional) |
|
|
|
|
|
|
|
|
|
|
|
| $ | 13,091 | $ | 12,917 |
Agency |
|
|
|
|
|
|
|
|
|
|
|
|
| 1,627 |
| 2,078 |
Other |
|
|
|
|
|
|
|
|
|
|
|
|
| 1,091 |
| 1,138 |
Total |
|
|
|
|
|
|
|
|
|
|
|
| $ | 15,809 | $ | 16,133 |
The fair value of CMBS holdings remained stable throughout 2021. The majority of our investments in CMBS are in tranches that contain substantial protection features through collateral subordination. The majority of CMBS holdings are traditional conduit transactions, broadly diversified across property types and geographical areas.
Investments in ABS/CDOs
The following table presents our ABS/CDO available for sale securities by collateral type:
|
|
|
|
|
|
|
|
|
| Fair value at |
| Fair value at |
|
|
|
|
|
|
|
|
|
| December 31, |
| December 31, |
(in millions) |
|
|
|
|
|
|
|
|
| 2021 |
| 2020 |
Collateral Type: |
|
|
|
|
|
|
|
|
|
|
|
|
ABS |
|
|
|
|
|
|
|
| $ | 10,532 | $ | 9,178 |
Bank loans (collateralized loan obligation) |
|
|
|
|
|
|
|
|
| 8,899 |
| 9,793 |
Other |
|
|
|
|
|
|
|
|
| 16 |
| 34 |
Total |
|
|
|
|
|
|
|
| $ | 19,447 | $ | 19,005 |
Unrealized Losses of Fixed Maturity Securities
The following table shows the aging of the unrealized losses of fixed maturity securities, the extent to which the fair value is less than amortized cost or cost, and the number of respective items in each category:
December 31, 2021 | Less Than or Equal |
|
| Greater Than 20% |
|
| Greater Than 50% |
|
|
| |||||||||||||
|
| to 20% of Cost(b) |
|
| to 50% of Cost(b) |
|
| of Cost(b) |
|
| Total | ||||||||||||
Aging(a) |
|
| Unrealized |
|
|
|
| Unrealized |
|
|
|
| Unrealized |
|
|
|
| Unrealized |
| ||||
(dollars in millions) |
| Cost(c) |
| Loss | Items(e) |
|
| Cost(c) |
| Loss | Items(e) |
|
| Cost(c) |
| Loss | Items(e) |
|
| Cost(c) |
| Loss(d) | Items(e) |
Investment grade |
|
|
|
|
|
|
|
|
|
|
|
|
|
|
|
|
|
|
|
|
|
|
|
bonds |
|
|
|
|
|
|
|
|
|
|
|
|
|
|
|
|
|
|
|
|
|
|
|
0-6 months | $ | 46,908 | $ | 756 | 8,247 |
| $ | 24 | $ | 7 | 5 |
| $ | - | $ | - | - |
| $ | 46,932 | $ | 763 | 8,252 |
7-11 months |
| 5,670 |
| 190 | 1,339 |
|
| 4 |
| 1 | 2 |
|
| - |
| - | - |
|
| 5,674 |
| 191 | 1,341 |
12 months or more |
| 10,547 |
| 526 | 1,693 |
|
| 18 |
| 6 | 5 |
|
| - |
| - | - |
|
| 10,565 |
| 532 | 1,698 |
Total | $ | 63,125 | $ | 1,472 | 11,279 |
| $ | 46 | $ | 14 | 12 |
| $ | - | $ | - | - |
| $ | 63,171 | $ | 1,486 | 11,291 |
Below investment |
|
|
|
|
|
|
|
|
|
|
|
|
|
|
|
|
|
|
|
|
|
|
|
grade bonds |
|
|
|
|
|
|
|
|
|
|
|
|
|
|
|
|
|
|
|
|
|
|
|
0-6 months | $ | 5,906 | $ | 116 | 2,396 |
| $ | 19 | $ | 7 | 13 |
| $ | 18 | $ | 17 | 12 |
| $ | 5,943 | $ | 140 | 2,421 |
7-11 months |
| 1,374 |
| 42 | 645 |
|
| 30 |
| 7 | 16 |
|
| 1 |
| 1 | 2 |
|
| 1,405 |
| 50 | 663 |
12 months or more |
| 2,463 |
| 103 | 711 |
|
| 354 |
| 89 | 49 |
|
| 51 |
| 35 | 20 |
|
| 2,868 |
| 227 | 780 |
Total | $ | 9,743 | $ | 261 | 3,752 |
| $ | 403 | $ | 103 | 78 |
| $ | 70 | $ | 53 | 34 |
| $ | 10,216 | $ | 417 | 3,864 |
Total bonds |
|
|
|
|
|
|
|
|
|
|
|
|
|
|
|
|
|
|
|
|
|
|
|
0-6 months | $ | 52,814 | $ | 872 | 10,643 |
| $ | 43 | $ | 14 | 18 |
| $ | 18 | $ | 17 | 12 |
| $ | 52,875 | $ | 903 | 10,673 |
7-11 months |
| 7,044 |
| 232 | 1,984 |
|
| 34 |
| 8 | 18 |
|
| 1 |
| 1 | 2 |
|
| 7,079 |
| 241 | 2,004 |
12 months or more |
| 13,010 |
| 629 | 2,404 |
|
| 372 |
| 95 | 54 |
|
| 51 |
| 35 | 20 |
|
| 13,433 |
| 759 | 2,478 |
Total(e) | $ | 72,868 | $ | 1,733 | 15,031 |
| $ | 449 | $ | 117 | 90 |
| $ | 70 | $ | 53 | 34 |
| $ | 73,387 | $ | 1,903 | 15,155 |
(a) Represents the number of consecutive months that fair value has been less than cost by any amount.
(b) Represents the percentage by which fair value is less than cost.
(c) For bonds, represents amortized cost net of allowance.
AIG | 2021 Form 10-K 123
(d) The effect on Net income of unrealized losses after taxes will be mitigated upon realization because certain realized losses will result in current decreases in the amortization of certain DAC.
(e) Item count is by CUSIP by subsidiary.
The allowance for credit losses was $6 million for investment grade bonds, and $93 million for below investment grade bonds as of December 31, 2021.
Commercial Mortgage Loans
At December 31, 2021, we had direct commercial mortgage loan exposure of $35.7 billion.
The following table presents the commercial mortgage loan exposure by location and class of loan based on amortized cost:
| Number |
|
|
|
|
|
|
|
|
|
|
|
|
|
|
| Percent |
|
| of |
| Class |
|
| of |
| |||||||||||
(dollars in millions) | Loans |
| Apartments |
| Offices |
| Retail | Industrial | Hotel |
| Others |
| Total | Total |
| |||
December 31, 2021 |
|
|
|
|
|
|
|
|
|
|
|
|
|
|
|
|
|
|
State: |
|
|
|
|
|
|
|
|
|
|
|
|
|
|
|
|
|
|
New York | 94 |
| $ | 2,217 | $ | 4,329 | $ | 450 | $ | 438 | $ | 103 | $ | - | $ | 7,537 | 21 | % |
California | 62 |
|
| 817 |
| 1,293 |
| 239 |
| 553 |
| 761 |
| 13 |
| 3,676 | 10 |
|
New Jersey | 48 |
|
| 2,092 |
| 30 |
| 462 |
| 225 |
| 11 |
| 33 |
| 2,853 | 8 |
|
Texas | 49 |
|
| 630 |
| 1,133 |
| 167 |
| 187 |
| 144 |
| - |
| 2,261 | 6 |
|
Florida | 60 |
|
| 469 |
| 152 |
| 368 |
| 214 |
| 281 |
| - |
| 1,484 | 4 |
|
Massachusetts | 13 |
|
| 534 |
| 290 |
| 537 |
| 24 |
| - |
| - |
| 1,385 | 4 |
|
Illinois | 24 |
|
| 554 |
| 626 |
| 9 |
| 50 |
| - |
| 21 |
| 1,260 | 5 |
|
Pennsylvania | 22 |
|
| 78 |
| 144 |
| 477 |
| 76 |
| 25 |
| - |
| 800 | 2 |
|
Washington D.C. | 11 |
|
| 455 |
| 184 |
| - |
| - |
| 18 |
| - |
| 657 | 2 |
|
Ohio | 25 |
|
| 167 |
| 10 |
| 175 |
| 289 |
| - |
| - |
| 641 | 2 |
|
Other states | 155 |
|
| 1,852 |
| 598 |
| 975 |
| 686 |
| 329 |
| - |
| 4,440 | 12 |
|
Foreign | 86 |
|
| 4,402 |
| 1,341 |
| 998 |
| 1,116 |
| 449 |
| 365 |
| 8,671 | 24 |
|
Total* | 649 |
| $ | 14,267 | $ | 10,130 | $ | 4,857 | $ | 3,858 | $ | 2,121 | $ | 432 | $ | 35,665 | 100 | % |
December 31, 2020 |
|
|
|
|
|
|
|
|
|
|
|
|
|
|
|
|
|
|
State: |
|
|
|
|
|
|
|
|
|
|
|
|
|
|
|
|
|
|
New York | 107 |
| $ | 2,624 | $ | 5,237 | $ | 465 | $ | 393 | $ | 102 | $ | - | $ | 8,821 | 24 | % |
California | 66 |
|
| 842 |
| 1,343 |
| 247 |
| 532 |
| 775 |
| 32 |
| 3,771 | 10 |
|
New Jersey | 47 |
|
| 1,756 |
| 31 |
| 420 |
| 92 |
| 12 |
| 33 |
| 2,344 | 6 |
|
Texas | 51 |
|
| 605 |
| 1,165 |
| 170 |
| 100 |
| 144 |
| - |
| 2,184 | 6 |
|
Florida | 69 |
|
| 421 |
| 153 |
| 497 |
| 216 |
| 217 |
| - |
| 1,504 | 4 |
|
Massachusetts | 12 |
|
| 536 |
| 227 |
| 551 |
| 25 |
| - |
| - |
| 1,339 | 4 |
|
Illinois | 20 |
|
| 504 |
| 574 |
| 10 |
| 18 |
| - |
| 22 |
| 1,128 | 3 |
|
Washington, D.C. | 13 |
|
| 465 |
| 213 |
| - |
| - |
| 19 |
| - |
| 697 | 2 |
|
Pennsylvania | 21 |
|
| 79 |
| 17 |
| 489 |
| 76 |
| 25 |
| - |
| 686 | 2 |
|
Ohio | 23 |
|
| 170 |
| 10 |
| 183 |
| 261 |
| - |
| - |
| 624 | 2 |
|
Other states | 187 |
|
| 1,992 |
| 722 |
| 1,192 |
| 731 |
| 399 |
| - |
| 5,036 | 14 |
|
Foreign | 84 |
|
| 3,975 |
| 1,020 |
| 1,025 |
| 1,322 |
| 575 |
| 373 |
| 8,290 | 23 |
|
Total* | 700 |
| $ | 13,969 | $ | 10,712 | $ | 5,249 | $ | 3,766 | $ | 2,268 | $ | 460 | $ | 36,424 | 100 | % |
* Does not reflect allowance for credit losses.
For additional discussion on commercial mortgage loans see Note 6 to the Consolidated Financial Statements.
124 AIG | 2021 Form 10-K
Net Realized Gains and Losses
The following table presents the components of Net realized gains (losses):
Years Ended December 31, | 2021 |
| 2020 |
| 2019 | |||||||||||
| Excluding | Fortitude Re |
|
|
| Excluding | Fortitude Re |
|
|
|
|
| ||||
| Fortitude Re | Funds |
|
|
| Fortitude Re |
| Funds |
|
|
|
|
| |||
| Funds | Withheld |
|
|
| Funds | Withheld |
|
|
|
|
| ||||
(in millions) | Withheld Assets | Assets |
| Total |
| Withheld Assets |
| Assets |
| Total |
|
| Total | |||
Sales of fixed maturity securities | $ | 211 | $ | 717 | $ | 928 |
| $ | 307 | $ | 707 | $ | 1,014 |
| $ | 320 |
Other-than-temporary impairments |
| - |
| - |
| - |
|
| - |
| - |
| - |
|
| (174) |
Intent to sell(a) |
| - |
| - |
| - |
|
| (3) |
| - |
| (3) |
|
| - |
Change in allowance for credit losses on |
|
|
|
|
|
|
|
|
|
|
|
|
|
|
|
|
fixed maturity securities |
| 19 |
| 7 |
| 26 |
|
| (270) |
| (10) |
| (280) |
|
| - |
Change in allowance for credit losses on |
|
|
|
|
|
|
|
|
|
|
|
|
|
|
|
|
loans |
| 163 |
| 9 |
| 172 |
|
| (105) |
| 2 |
| (103) |
|
| (46) |
Foreign exchange transactions |
| 16 |
| (5) |
| 11 |
|
| 365 |
| 13 |
| 378 |
|
| 227 |
Variable annuity embedded derivatives, |
|
|
|
|
|
|
|
|
|
|
|
|
|
|
|
|
net of related hedges |
| (39) |
| - |
| (39) |
|
| 166 |
| - |
| 166 |
|
| (294) |
All other derivatives and hedge accounting |
| 179 |
| 28 |
| 207 |
|
| (672) |
| (249) |
| (921) |
|
| (22) |
Other(b) |
| 1,202 |
| 247 |
| 1,449 |
|
| 156 |
| - |
| 156 |
|
| 621 |
Net realized gains – excluding |
|
|
|
|
|
|
|
|
|
|
|
|
|
|
|
|
Fortitude Re funds withheld |
|
|
|
|
|
|
|
|
|
|
|
|
|
|
|
|
embedded derivative |
| 1,751 |
| 1,003 |
| 2,754 |
|
| (56) |
| 463 |
| 407 |
|
| 632 |
Net realized gains (losses) on Fortitude Re |
|
|
|
|
|
|
|
|
|
|
|
|
|
|
|
|
funds withheld embedded derivative |
| - |
| (603) |
| (603) |
|
| - |
| (2,645) |
| (2,645) |
|
| - |
Net realized gains (losses) | $ | 1,751 | $ | 400 | $ | 2,151 |
| $ | (56) | $ | (2,182) | $ | (2,238) |
| $ | 632 |
(a) For 2019, Intent to sell was included in Other-than-temporary impairments.
(b) In 2021, primarily includes gains from sale of global real estate investments of $1.1 billion and gains from affordable housing partnerships of $208 million. In 2019, includes $200 million from the sale and concurrent leaseback of our corporate headquarters and $300 million as a result of sales in investment real estate properties.
Net realized gains excluding Fortitude Re funds withheld assets in 2021 compared to net realized losses in the prior year were primarily due to gains on the sale of global real estate investments and derivatives gains compared to losses in the prior year, which more than offset lower foreign exchange gains compared to the prior year.
Variable annuity embedded derivatives, net of related hedges, reflected losses in 2021 compared to gains in the prior year. Fair value gains or losses in the hedging portfolio are typically not fully offset by increases or decreases in liabilities due to the non-performance or “own credit” risk adjustment used in the valuation of the variable annuities with GMWB embedded derivative, which are not hedged as part of our economic hedging program, and other risk margins used for valuation that cause the embedded derivatives to be less sensitive to changes in market rates than the hedge portfolio.
Net realized gains (losses) on Fortitude Re funds withheld assets primarily reflect changes in the valuation of the modified coinsurance and funds withheld assets. Increases in the valuation of these assets result in losses to AIG as the appreciation on the assets must under those reinsurance arrangements be transferred to Fortitude Re. Decreases in valuation of the assets result in gains to AIG as the depreciation on the assets under those reinsurance arrangements must be transferred to Fortitude Re. For further details on the impact of the funds withheld arrangements with Fortitude Re see Note 7 to the Consolidated Financial Statements.
For additional discussion of market risk management related to these product features see Enterprise Risk Management – Insurance Risks – Life and Retirement Companies’ Key Risks – Variable Annuity, Index Annuity and Universal Life Risk Management and Hedging Programs. For more information on the economic hedging target and the impact to pre-tax income of this program see Insurance Reserves – Life and Annuity Future Policy Benefits, Policyholder Contract Deposits and DAC – Variable Annuity Guaranteed Benefits and Hedging Results in this MD&A.
For further discussion of our investment portfolio see Note 5 to the Consolidated Financial Statements.
AIG | 2021 Form 10-K 125
Change in Unrealized Gains and Losses on Investments
The change in net unrealized gains and losses on investments in 2021 was primarily attributable to movements in interest rates and spreads. For 2021, net unrealized losses related to fixed maturity securities were $9.3 billion due primarily to an increase in interest rates.
The change in net unrealized gains and losses on investments in 2020 was primarily attributable to increases in the fair value of fixed maturity securities. For 2020, net unrealized gains related to fixed maturity securities were $9.5 billion due primarily to lower rates partially offset by a widening of credit spreads.
For further discussion of our investment portfolio see Note 5 to the Consolidated Financial Statements.
Insurance Reserves
Liability for unpaid losses and loss adjustment expenses (Loss Reserves)
The following table presents the components of our gross and net loss reserves by segment and major lines of business(a):
At December 31, | 2021 |
| 2020 | ||||||||||
| Net liability for | Reinsurance | Gross liability |
| Net liability for | Reinsurance | Gross liability | ||||||
| unpaid losses | recoverable on | for unpaid |
| unpaid losses | recoverable on | for unpaid | ||||||
| and loss | unpaid losses and | losses and |
| and loss | unpaid losses and | losses and | ||||||
| adjustment | loss adjustment | loss adjustment |
| adjustment | loss adjustment | loss adjustment | ||||||
(in millions) | expenses | expenses | expenses |
| expenses | expenses | expenses | ||||||
General Insurance: |
|
|
|
|
|
|
|
|
|
|
|
|
|
U.S. Workers' Compensation (net of discount) | $ | 3,282 | $ | 5,216 | $ | 8,498 |
| $ | 3,905 | $ | 5,653 | $ | 9,558 |
U.S. Excess Casualty |
| 3,850 |
| 4,195 |
| 8,045 |
|
| 3,746 |
| 4,584 |
| 8,330 |
U.S. Other Casualty |
| 3,805 |
| 4,191 |
| 7,996 |
|
| 3,520 |
| 4,568 |
| 8,088 |
U.S. Financial Lines |
| 5,356 |
| 1,893 |
| 7,249 |
|
| 4,838 |
| 2,193 |
| 7,031 |
U.S. Property and Special Risks |
| 6,615 |
| 3,587 |
| 10,202 |
|
| 6,181 |
| 2,571 |
| 8,752 |
U.S. Personal Insurance |
| 1,001 |
| 2,198 |
| 3,199 |
|
| 1,116 |
| 1,626 |
| 2,742 |
UK/Europe Casualty and Financial Lines |
| 7,175 |
| 1,603 |
| 8,778 |
|
| 6,826 |
| 1,225 |
| 8,051 |
UK/Europe Property and Special Risks |
| 2,631 |
| 1,492 |
| 4,123 |
|
| 2,679 |
| 1,215 |
| 3,894 |
UK/Europe and Japan Personal Insurance |
| 1,962 |
| 608 |
| 2,570 |
|
| 2,219 |
| 505 |
| 2,724 |
Other product lines(b) |
| 5,815 |
| 5,468 |
| 11,283 |
|
| 6,202 |
| 5,410 |
| 11,612 |
Unallocated loss adjustment expenses(b) |
| 1,654 |
| 1,015 |
| 2,669 |
|
| 1,526 |
| 1,106 |
| 2,632 |
Total General Insurance |
| 43,146 |
| 31,466 |
| 74,612 |
|
| 42,758 |
| 30,656 |
| 73,414 |
Other Operations Run-Off: |
|
|
|
|
|
|
|
|
|
|
|
|
|
U.S. Run-Off Long Tail Insurance Lines |
|
|
|
|
|
|
|
|
|
|
|
|
|
(net of discount) |
| 164 |
| 3,434 |
| 3,598 |
|
| 205 |
| 3,500 |
| 3,705 |
Other run-off product lines |
| 264 |
| 61 |
| 325 |
|
| 210 |
| 60 |
| 270 |
Blackboard |
| 217 |
| 138 |
| 355 |
|
| 88 |
| 101 |
| 189 |
Unallocated loss adjustment expenses |
| 22 |
| 114 |
| 136 |
|
| 28 |
| 114 |
| 142 |
Total Other Operations Run-Off |
| 667 |
| 3,747 |
| 4,414 |
|
| 531 |
| 3,775 |
| 4,306 |
|
|
|
|
|
|
|
|
|
|
|
|
|
|
Total | $ | 43,813 | $ | 35,213 | $ | 79,026 |
| $ | 43,289 | $ | 34,431 | $ | 77,720 |
(a) Includes net loss reserve discount of $876 million and $725 million as of December 31, 2021 and 2020, respectively. For information regarding loss reserve discount see Note 12 to the Consolidated Financial Statements.
(b) Other product lines and Unallocated loss adjustment expenses includes Gross liability for unpaid losses and loss adjustment expense and Reinsurance recoverable on unpaid losses and loss adjustment expense for the Fortitude Re reinsurance of $3.5 billion and $3.8 billion as of December 31, 2021 and 2020, respectively.
126 AIG | 2021 Form 10-K
Prior Year Development
The following table summarizes incurred (favorable) unfavorable prior year development net of reinsurance by segment:
|
|
|
| |||
(in millions) |
| 2021 |
| 2020 |
| 2019 |
General Insurance: |
|
|
|
|
|
|
North America* | $ | (194) | $ | (157) | $ | (136) |
International |
| (7) |
| 81 |
| (158) |
Total General Insurance | $ | (201) | $ | (76) | $ | (294) |
Other Operations Run-Off |
| 86 |
| 2 |
| - |
Total prior year favorable development | $ | (115) | $ | (74) | $ | (294) |
* Includes the amortization attributed to the deferred gain at inception from the National Indemnity Company (NICO) adverse development reinsurance agreement of $193 million, $211 million and $232 million in the years ended December 31, 2021, 2020 and 2019, respectively. Consistent with our definition of APTI, the amount excludes the portion of (favorable)/unfavorable prior year reserve development for which we have ceded the risk under the NICO reinsurance agreements of $(249) million, $(228) million and $(278) million for the years ended December 31, 2021, 2020 and 2019, respectively. Also excludes the related changes in amortization of the deferred gain, which were $(3) million, $25 million and $(13) million over those same periods.
Net Loss Development – 2021
During 2021, we recognized favorable prior year loss reserve development of $115 million. The key components of this development were:
North America
Strong favorable development in Personal Insurance, primarily attributable to subrogation recovery related to the 2017 and 2018 California wildfires partially offset by the impact of dropping below the attachment point of our 2018 catastrophe aggregate treaty, which also adversely impacted our U.S. Property and Special Risk Commercial Lines.
Favorable development on U.S. Workers Compensation and short-tailed commercial lines within Other Product Lines, reflecting lower frequency and severity in recent calendar years.
Amortization benefit of $193 million related to the deferred gain on the adverse development cover.
Reserve strengthening within U.S. Financial Lines, reflecting higher severity of claims in Directors & Officers, principally from accident years 2018 and prior, and cyber risk from accident years 2019 and 2020.
International
Favorable development on short-tailed International Commercial Lines and Personal Insurance, reflecting lower frequency and severity of claims.
Reserve strengthening on International Financial Lines, reflecting higher severity of claims, the majority of which is from accident years 2018 and prior.
Other Operations
Unfavorable development primarily attributed to the Blackboard insurance portfolio due to increased severity on reported claims.
Our analyses and conclusions about prior year reserves also help inform our judgments about the current accident year loss and loss adjustment expense ratios we selected.
For additional information on prior year development by line of business see Note 12 to the Consolidated Financial Statements. For information regarding actuarial methods employed for major classes of business, see Critical Accounting Estimates.
AIG | 2021 Form 10-K 127
The following tables summarize incurred (favorable) unfavorable prior year development net of reinsurance, by segment and major lines of business, and by accident year groupings:
Years Ended December 31, 2021 |
|
|
|
|
|
|
(in millions) |
| Total |
| 2020 |
| 2019 & Prior |
General Insurance North America: |
|
|
|
|
|
|
U.S. Workers' Compensation | $ | (383) | $ | (25) | $ | (358) |
U.S. Excess Casualty |
| (5) |
| 6 |
| (11) |
U.S. Other Casualty |
| 7 |
| 56 |
| (49) |
U.S. Financial Lines |
| 521 |
| 49 |
| 472 |
U.S. Property and Special Risks |
| 189 |
| (28) |
| 217 |
U.S. Personal Insurance |
| (413) |
| (48) |
| (365) |
Other Product Lines |
| (110) |
| (35) |
| (75) |
Total General Insurance North America | $ | (194) | $ | (25) | $ | (169) |
General Insurance International: |
|
|
|
|
|
|
UK/Europe Casualty and Financial Lines | $ | 210 | $ | 50 | $ | 160 |
UK/Europe Property and Special Risks |
| (118) |
| (51) |
| (67) |
UK/Europe and Japan Personal Insurance |
| (173) |
| (148) |
| (25) |
Other product lines |
| 74 |
| (11) |
| 85 |
Total General Insurance International | $ | (7) | $ | (160) | $ | 153 |
Other Operations Run-Off |
| 86 |
| 42 |
| 44 |
Total Prior Year (Favorable) Unfavorable Development | $ | (115) | $ | (143) | $ | 28 |
Net Loss Development – 2020
During 2020, we recognized favorable prior year loss reserve development of $74 million. The development was primarily driven by:
North America
Favorable development on U.S. Workers’ Compensation business, both guaranteed cost business and large deductible, where we reacted to favorable loss trends in recent accident years;
Favorable development from amortization of the deferred gain on the adverse development reinsurance agreement with NICO for accident years 2015 and prior;
Favorable development across the combination of primary and excess casualty coverages;
Favorable development in Property, Specialty and other miscellaneous coverages;
Unfavorable development in U.S. Financial Lines, notably D&O, Employment Practices Liability (EPLI), Mergers and Acquisitions, Cyber and Non-Medical Professional Errors & Omissions business where we reacted to increasing frequency and severity in recent accident years;
Unfavorable development in Personal Lines where we reacted to adverse development in Homeowners and Umbrella.
International
Unfavorable development on Financial Lines driven by low frequency and high severity seen in D&O, especially in UK/Europe and Australia;
Favorable development on Property and Special Risks globally driven by UK/Europe;
Favorable development on Europe and Japan Personal Insurance driven by favorable frequency and severity trends.
We note that for certain categories of claims (e.g., construction defect claims and environmental claims) and for reinsurance recoverable, losses may sometimes be reclassified to an earlier or later accident year as more information about the date of occurrence becomes available to us.
128 AIG | 2021 Form 10-K
Significant Reinsurance Agreements
In the first quarter of 2017, we entered into an adverse development reinsurance agreement with NICO, under which we transferred to NICO 80 percent of the reserve risk on substantially all of our U.S. Commercial long-tail exposures for accident years 2015 and prior. Under this agreement, we ceded to NICO 80 percent of the losses on subject business paid on or after January 1, 2016 in excess of $25 billion of net paid losses, up to an aggregate limit of $25 billion. We account for this transaction as retroactive reinsurance. This transaction resulted in a gain, which under GAAP retroactive reinsurance accounting is deferred and amortized into income over the settlement period. NICO created a collateral trust account as security for their claim payment obligations to us, into which they deposited the consideration paid under the agreement, and Berkshire Hathaway Inc. has provided a parental guarantee to secure NICO’s obligations under the agreement.
For a description of AIG’s catastrophe reinsurance protection for 2021, see Enterprise Risk Management – Insurance Risks – General Insurance Companies’ Key Risks – Natural Catastrophe Risk.
The table below shows the calculation of the deferred gain on the adverse development reinsurance agreement as of December 31, 2021, 2020 and 2019, showing the effect of discounting of loss reserves and amortization of the deferred gain.
|
| December 31, |
| December 31, |
| December 31, |
(in millions) |
| 2021 |
| 2020 |
| 2019 |
Gross Covered Losses |
|
|
|
|
|
|
Covered reserves before discount | $ | 14,398 | $ | 16,534 | $ | 19,064 |
Inception to date losses paid |
| 27,023 |
| 25,198 |
| 22,954 |
Attachment point |
| (25,000) |
| (25,000) |
| (25,000) |
Covered losses above attachment point | $ | 16,421 | $ | 16,732 | $ | 17,018 |
|
|
|
|
|
|
|
Deferred Gain Development |
|
|
|
|
|
|
Covered losses above attachment ceded to NICO (80%) | $ | 13,137 | $ | 13,386 | $ | 13,614 |
Consideration paid including interest |
| (10,188) |
| (10,188) |
| (10,188) |
Pre-tax deferred gain before discount and amortization |
| 2,949 |
| 3,198 |
| 3,426 |
Discount on ceded losses(a) |
| (953) |
| (911) |
| (1,251) |
Pre-tax deferred gain before amortization |
| 1,996 |
| 2,287 |
| 2,175 |
Inception to date amortization of deferred gain at inception |
| (1,097) |
| (904) |
| (693) |
Inception to date amortization attributed to changes in deferred gain(b) |
| (30) |
| (86) |
| (101) |
Deferred gain liability reflected in AIG's balance sheet | $ | 869 | $ | 1,297 | $ | 1,381 |
(a) The accretion of discount and a reduction in effective interest rates is offset by changes in estimates of the amount and timing of future recoveries.
(b) Excluded from APTI.
The following table presents the rollforward of activity in the deferred gain from the adverse development reinsurance agreement:
Years Ended December 31, |
|
| ||||
(in millions) |
| 2021 |
| 2020 |
| 2019 |
Balance at beginning of year, net of discount | $ | 1,297 | $ | 1,381 | $ | 1,382 |
(Favorable) unfavorable prior year reserve development ceded to NICO(a) |
| (249) |
| (228) |
| (277) |
Amortization attributed to deferred gain at inception(b) |
| (193) |
| (211) |
| (232) |
Amortization attributed to changes in deferred gain(c) |
| 56 |
| 15 |
| 39 |
Changes in discount on ceded loss reserves |
| (42) |
| 340 |
| 469 |
Balance at end of year, net of discount | $ | 869 | $ | 1,297 | $ | 1,381 |
(a) Prior year reserve development ceded to NICO under the retroactive reinsurance agreement is deferred under GAAP.
(b) Represents amortization of the deferred gain recognized in APTI.
(c) Excluded from APTI.
The lines of business subject to this agreement have been the source of the majority of the unfavorable prior year development over the past several years, though the overall prior year development has been favorable over the past three years. The agreement has resulted in lower capital charges for reserve risks at our U.S. insurance subsidiaries. In addition, net investment income declined as a result of lower invested assets.
AIG | 2021 Form 10-K 129
Fortitude Re was established during the first quarter of 2018 in a series of reinsurance transactions related to our Run-Off operations. Those reinsurance transactions were designed to consolidate most of our Insurance Run-Off Lines into a single legal entity. As of December 31, 2021, approximately $29.6 billion of reserves from our Life and Retirement Run-Off Lines and approximately $3.8 billion of reserves from our General Insurance Run-Off Lines related to business written by multiple wholly-owned AIG subsidiaries, had been ceded to Fortitude Re under these reinsurance transactions.
Of the Fortitude Re reinsurance agreements, the largest is the Amended and Restated Combination Coinsurance and Modified Coinsurance Agreement by and between our subsidiary American General Life Insurance Company (AGL) and Fortitude Re. Under this treaty, approximately $22.6 billion of AGL reserves as of December 31, 2021 were ceded to Fortitude Re representing a mix of life and annuity risks. Fortitude Re provides 100 percent reinsurance of the ceded risks. AGL retains the risk of collection of any third party reinsurance covering the ceded business. At effectiveness of the treaty, an amount equal to the aggregate ceded reserves was deposited by AGL into a modified coinsurance account of AGL to secure the obligations of Fortitude Re. Fortitude Re receives or makes quarterly payments that represent the net gain or loss under the treaty for the relevant quarter, including any net investment gain or loss on the assets in the modified coinsurance account. An AIG affiliate will serve as portfolio manager of assets in the modified coinsurance account for a minimum of three years after the June 2, 2020 closing of the Majority Interest Fortitude Sale.
Following receipt of all regulatory approvals and the satisfaction of other conditions, effective as of January 1, 2022, AIG sold to an affiliate of Fortitude Re all of the outstanding capital stock of two servicing companies that administer the Life and Retirement and General Insurance ceded business, and the ceding insurers entered into administrative services agreements pursuant to which AIG transferred administration of certain Life and Retirement and General Insurance ceded business to such companies.
For a summary of significant reinsurers see Enterprise Risk Management – Insurance Risks – Reinsurance Activities – Reinsurance Recoverable.
LIFE AND ANNUITY FUTURE POLICY BENEFITS, POLICYHOLDER CONTRACT DEPOSITS and dac
The following section provides discussion of life and annuity future policy benefits, policyholder contract deposits and deferred policy acquisition costs.
Update of Actuarial Assumptions and Models
The life insurance companies review and update actuarial assumptions at least annually, generally in the third quarter. Assumption setting standards vary between investment-oriented products and traditional long-duration products.
Investment-Oriented Products
The life insurance companies review and update estimated gross profit assumptions used to amortize DAC and related items (which may include VOBA, DSI and unearned revenue reserves) and assessments used to accrue guaranteed benefit reserves for investment-oriented products at least annually. Estimated gross profit projections include assumptions for investment-related returns and spreads, product-related fees and expenses, mortality gains and losses, policyholder behavior and other factors. In estimating future gross profits, lapse assumptions require judgment and can have a material impact on DAC amortization. If the assumptions used for estimated gross profits change significantly, DAC and related reserves are recalculated using the new projections, and any resulting adjustment is included in income. Updating such projections may result in acceleration of amortization in some products and deceleration of amortization in other products.
The life insurance companies also review assumptions related to their respective GMWB living benefits that are accounted for as embedded derivatives and measured at fair value. The fair value of these embedded derivatives is based on actuarial assumptions, including policyholder behavior, as well as capital market assumptions.
Various assumptions were updated, including the following effective September 30, 2021:
• The reversion to the mean rates of return (gross of fees) were decreased to 1.04 percent from 3.12 percent for the variable annuity product line in Individual Retirement and increased to 4.04 percent from 2.87 percent for the variable annuity product line in Group Retirement primarily due to recent equity market movements. The separate account long-term asset growth rate assumption related to equity market performance remained unchanged at 7.0 percent. The Group Retirement reversion to the mean rate of return had become and had remained less than zero percent, the rate was unlocked and reset to 3.59 percent, which increased the DAC and sales inducement balances by a total of $78 million and decreased reserve balances by $6 million, increasing pre-tax income by a total of $84 million. The long-term growth assumption remained unchanged at 7.0 percent; and
130 AIG | 2021 Form 10-K
• Ultimate projected yields on most of our invested assets were lowered on life and annuity deposits. Life deposit projected yields decreased up to 42 basis points while annuity insurance deposits saw decreases of up to 52 basis points. Projected yields are graded from a weighted average net GAAP book yield of existing assets supporting the business based on the value of the assets to a weighted average yield based on the duration of the assets excluding assets that mature during the grading period. The grading period is three years for deferred annuity products and five years for life insurance products due to deferred annuities having a shorter duration than life products. Projected yields are held constant after the grading period.
For information regarding actuarial methods see Critical Accounting Estimates – Estimated Gross Profits to Value Deferred Acquisition Costs and Unearned Revenue for Investment-Oriented Products.
Traditional long-duration products
For traditional long-duration products discussed below, which include whole life insurance, term life insurance, accident and health insurance, PRT group annuities, and life-contingent single premium immediate annuities and structured settlements, a “lock-in” principle applies. The assumptions used to calculate the benefit liabilities and DAC are set when a policy is issued and do not change with changes in actual experience, unless a loss recognition event occurs. A loss recognition event occurs when current liabilities together with expected future premiums are not sufficient to provide for all future benefits, expenses, and DAC amortization, net of reinsurance. A loss recognition event is driven by observed changes in actual experience or estimates differing significantly from “locked-in” assumptions. Underlying assumptions, including interest rates, are reviewed periodically and updated as appropriate for loss recognition testing purposes.
The net increases (decreases) to pre-tax income and adjusted pre-tax income as a result of the update of actuarial assumptions for 2021, 2020 and 2019 are shown in the following tables.
The following table presents the decrease in pre-tax income resulting from the third quarter update of actuarial assumptions in the life insurance companies, by line item as reported in Results of Operations:
Years Ended December 31, |
|
|
|
|
|
|
(in millions) |
| 2021 |
| 2020 |
| 2019 |
Premiums | $ | (41) | $ | - | $ |
|
Policy fees |
| (74) |
| (106) |
| (32) |
Interest credited to policyholder account balances |
| (50) |
| (6) |
| 19 |
Amortization of deferred policy acquisition costs |
| (139) |
| 225 |
| 203 |
Non deferrable insurance commissions |
| - |
| 15 |
| - |
Policyholder benefits and losses incurred |
| 138 |
| (235) |
| (363) |
Decrease in adjusted pre-tax income |
| (166) |
| (107) |
| (173) |
Change in DAC related to net realized gains and losses |
| 57 |
| (44) |
| (17) |
Net realized gains (losses) |
| (100) |
| 142 |
| 180 |
Decrease in pre-tax income | $ | (209) | $ | (9) | $ | (10) |
Update of Actuarial Assumptions by Business Segment
The following table presents the increase (decrease) in adjusted pre-tax income resulting from the third quarter update of actuarial assumptions for the life insurance companies, by segment and product line:
Years Ended December 31, |
|
|
|
|
|
|
(in millions) |
| 2021 |
| 2020 |
| 2019 |
Life and Retirement: |
|
|
|
|
|
|
Individual Retirement |
|
|
|
|
|
|
Fixed annuities | $ | (274) | $ | (77) | $ | 82 |
Variable and indexed annuities |
| 4 |
| 2 |
| (145) |
Total Individual Retirement |
| (270) |
| (75) |
| (63) |
Group Retirement |
| (2) |
| 68 |
| (17) |
Life Insurance |
| 106 |
| (101) |
| (64) |
Institutional Markets |
| - |
| 1 |
| - |
Total Life and Retirement |
| (166) |
| (107) |
| (144) |
Other Operations Run-Off |
| - |
| - |
| (29) |
Total decrease in adjusted pre-tax income from update of assumptions | $ | (166) | $ | (107) | $ | (173) |
AIG | 2021 Form 10-K 131
In 2021, adjusted pre-tax income included a net unfavorable update of $166 million, primarily in fixed annuities driven by changes to earned rates causing spread compression partially offset by favorable updates to full surrender assumptions, and updates to the Life Insurance reserves for universal life with secondary guarantees and similar features (excluding base policy liabilities and embedded derivatives) model.
In 2020, adjusted pre-tax income included a net unfavorable adjustment of $107 million, primarily in fixed annuities driven by changes to earned rates causing spread compression partially offset by favorable updates to full surrender assumptions, and in Life Insurance primarily due to mortality modeling enhancements.
The impacts related to the update of actuarial assumptions in each period are discussed by business segment below.
Individual Retirement
The annual update of actuarial assumptions resulted in net unfavorable impact to adjusted pre-tax income of Individual Retirement of $270 million and $75 million in 2021 and 2020, respectively.
In 2021, in fixed annuities, the update of estimated gross profit assumptions resulted in a net unfavorable impact of $274 million which reflected lower projected investment earnings. In 2020, the update of estimated gross profit assumptions resulted in a net unfavorable impact of $77 million which reflected lower projected investment earnings, partially offset by lower assumed lapses.
In 2021, in variable and index annuities, the update of estimated gross profit assumptions resulted in a net favorable impact of $4 million, driven by lower assumed lapses. These updates were largely offset by lower projected investment earnings. In 2020, the update of estimated gross profit assumptions resulted in a net favorable adjustment of $2 million driven by guarantee withdrawal benefit utilization assumptions. These updates were partially offset by lower projected investment earnings.
Group Retirement
In 2021, in Group Retirement, the update of estimated gross profit assumptions resulted in a net unfavorable impact of $2 million, driven primarily in the variable annuities line by lower projected investment earnings, largely offset by resetting the reversion to the mean rates. In 2020, the update of estimated gross profit assumptions resulted in a favorable impact of $68 million, primarily in the variable annuities line from extending the DAC amortization projection period, partially offset by updates to expense and lapse assumptions. The DAC amortization projection period was extended to reflect business still in-force at the end of the previous projection period, resulting in an increase in modeled future profits and an increase in the current DAC balance.
Life Insurance
In 2021, in Life Insurance, the update of actuarial assumptions resulted in a net favorable impact of $106 million, primarily driven by updates to the modeling of certain policy fees for universal life with secondary guarantees and similar features (excluding base policy liabilities and embedded derivatives), which was partially offset by lower projected investment earnings and model updates involving reinsurance. In 2020, the annual update of actuarial assumptions resulted in a net unfavorable impact of $101 million, primarily driven by updates to universal life mortality assumptions. The mortality updates better align the assumptions with experience and reduce future profits which increases the reserves for affected products. The unfavorable updates were partially offset by refinements to reserve modeling.
132 AIG | 2021 Form 10-K
Variable Annuity Guaranteed Benefits and Hedging Results
Our Individual Retirement and Group Retirement businesses offer variable annuity products with GMWB riders that provide guaranteed living benefit features. The liabilities for GMWB are accounted for as embedded derivatives measured at fair value. The fair value of the embedded derivatives may fluctuate significantly based on market interest rates, equity prices, credit spreads, market volatility, policyholder behavior and other factors.
In addition to risk-mitigating features in our variable annuity product design, we have an economic hedging program designed to manage market risk from GMWB, including exposures to changes in interest rates, equity prices, credit spreads and volatility. The hedging program utilizes derivative instruments, including but not limited to equity options, futures contracts and interest rate swap and swaption contracts, as well as fixed maturity securities with a fair value election.
For additional information on market risk management related to these product features see Enterprise Risk Management – Insurance Risks – Life and Retirement Companies’ Key Risks – Variable Annuity, Index Annuity and Universal Life Risk Management and Hedging Programs.
Differences in Valuation of Embedded Derivatives and Economic Hedge Target
The variable annuity hedging program utilizes an economic hedge target, which represents an estimate of the underlying economic risks in our GMWB riders. The economic hedge target differs from the GAAP valuation of the GMWB embedded derivatives, creating volatility in our net income (loss) primarily due to the following:
The economic hedge target includes 100 percent of rider fees in present value calculations; the GAAP valuation reflects only those fees attributed to the embedded derivative such that the initial value at contract issue equals zero;
The economic hedge target uses best estimate actuarial assumptions and excludes explicit risk margins used for GAAP valuation, such as margins for policyholder behavior, mortality, and volatility; and
The economic hedge target excludes the non-performance or “own credit” risk adjustment used in the GAAP valuation, which reflects a market participant’s view of our claims-paying ability by incorporating a different spread (the NPA spread) to the curve used to discount projected benefit cash flows. Because the discount rate includes the NPA spread and other explicit risk margins, the GAAP valuation has different sensitivities to movements in interest rates and other market factors, and to changes from actuarial assumption updates, than the economic hedge target. For more information on our valuation methodology for embedded derivatives within policyholder contract deposits see Note 4 to the Consolidated Financial Statements.
The market value of the hedge portfolio compared to the economic hedge target at any point in time may be different and is not expected to be fully offsetting. In addition to the derivatives held in conjunction with the variable annuity hedging program, the Life and Retirement companies have cash and invested assets available to cover future claims payable under these guarantees. The primary sources of difference between the change in the fair value of the hedging portfolio and the economic hedge target include:
Basis risk due to the variance between expected and actual fund returns, which may be either positive or negative;
Realized volatility versus implied volatility;
Actual versus expected changes in the hedge target driven by assumptions not subject to hedging, particularly policyholder behavior; and
Risk exposures that we have elected not to explicitly or fully hedge.
The following table presents a reconciliation between the fair value of the GAAP embedded derivatives and the value of our economic hedge target:
|
|
|
|
|
|
| December 31, |
| December 31, |
(in millions) |
|
|
|
|
|
| 2021 |
| 2020 |
Reconciliation of embedded derivatives and economic hedge target: |
|
|
|
|
|
|
|
|
|
Embedded derivative liability |
|
|
|
|
| $ | 2,472 | $ | 3,572 |
Exclude non-performance risk adjustment |
|
|
|
|
|
| (2,508) |
| (2,958) |
Embedded derivative liability, excluding NPA |
|
|
|
|
|
| 4,980 |
| 6,530 |
Adjustments for risk margins and differences in valuation |
|
|
|
|
|
| (2,172) |
| (2,502) |
Economic hedge target liability |
|
|
|
|
| $ | 2,808 | $ | 4,028 |
AIG | 2021 Form 10-K 133
Impact on Pre-tax Income (Loss)
The impact on our pre-tax income (loss) of variable annuity guaranteed living benefits and related hedging results includes changes in the fair value of the GMWB embedded derivatives, and changes in the fair value of related derivative hedging instruments, both of which are recorded in Net realized gains (losses). Realized gains (losses), as well as net investment income from changes in the fair value of fixed maturity securities used in the hedging program, are excluded from adjusted pre-tax income of Individual Retirement and Group Retirement.
The change in the fair value of the embedded derivatives and the change in the value of the hedging portfolio are not expected to be fully offsetting, primarily due to the differences in valuation between the economic hedge target, the GAAP embedded derivatives and the fair value of the hedging portfolio, as discussed above. When corporate credit spreads widen, the change in the NPA spread generally reduces the fair value of the embedded derivative liabilities, resulting in a gain, and when corporate credit spreads narrow or tighten, the change in the NPA spread generally increases the fair value of the embedded derivative liabilities, resulting in a loss. In addition to changes driven by credit market-related movements in the NPA spread, the NPA balance also reflects changes in business activity and in the net amount at risk from the underlying guaranteed living benefits.
The following table presents the net increase (decrease) to consolidated pre-tax income (loss) from changes in the fair value of the GMWB embedded derivatives and related hedges, excluding related DAC amortization:
Years Ended December 31, |
|
|
| |||
(in millions) |
| 2021 |
| 2020 |
| 2019 |
Change in fair value of embedded derivatives, excluding update of actuarial |
|
|
|
|
|
|
assumptions and NPA | $ | 2,289 | $ | (1,145) | $ | (156) |
Change in fair value of variable annuity hedging portfolio: |
|
|
|
|
|
|
Fixed maturity securities* |
| 57 |
| 44 |
| 194 |
Interest rate derivative contracts |
| (600) |
| 1,342 |
| 1,029 |
Equity derivative contracts |
| (1,217) |
| (679) |
| (1,274) |
Change in fair value of variable annuity hedging portfolio |
| (1,760) |
| 707 |
| (51) |
Change in fair value of embedded derivatives excluding update of actuarial assumptions and |
|
|
|
|
|
|
NPA, net of hedging portfolio |
| 529 |
| (438) |
| (207) |
Change in fair value of embedded derivatives due to NPA spread |
| (68) |
| 50 |
| (314) |
Change in fair value of embedded derivatives due to change in NPA volume |
| (383) |
| 404 |
| 202 |
Change in fair value of embedded derivatives due to update of actuarial assumptions |
| (60) |
| 194 |
| 219 |
Total change due to updated of actuarial assumptions and NPA |
| (511) |
| 648 |
| 107 |
Net impact on pre-tax income (loss) | $ | 18 | $ | 210 | $ | (100) |
|
|
|
|
|
|
|
Impact to Consolidated Income Statement |
|
|
|
|
|
|
Net investment income, net of related interest credited to policyholder account balances | $ | 57 | $ | 44 | $ | 194 |
Net realized gains (losses) |
| (39) |
| 166 |
| (294) |
Net impact on pre-tax income (loss) | $ | 18 | $ | 210 | $ | (100) |
|
|
|
|
|
|
|
Net change in value of economic hedge target and related hedges |
|
|
|
|
|
|
Net impact on economic gains (losses) | $ | 109 | $ | 295 | $ | 261 |
* Beginning in July 2019, the fixed maturity securities portfolio used in the hedging program was rebalanced to reposition the portfolio from a duration, sector, and issuer perspective. As part of this rebalancing, fixed maturity securities where we elected the fair value option were sold. Later in the quarter, as new fixed maturity securities were purchased, they were classified as available for sale. The change in fair value of available-for-sale fixed maturity securities recognized as a component of other comprehensive income (loss) was a loss of $122 million in 2021 due to higher interest rates. The change in fair value of available-for-sale fixed maturity securities recognized as a component of other comprehensive income (loss) were gains of $217 million and $57 million for 2020 and 2019, respectively, due to lower interest rates and tightening credit spreads.
134 AIG | 2021 Form 10-K
The net impact on pre-tax income of $18 million from the GMWB embedded derivatives and related hedges in 2021 was driven by gains from higher equity markets, impact of higher interest rates on the change in the fair value of embedded derivatives excluding NPA, net of the hedging portfolio, offset by the tightening of NPA credit spreads, impact of higher interest rates that resulted in NPA volume losses from lower expected GMWB payments, and losses from the review and update of actuarial assumptions. In 2020, the net impact on pre-tax income of $210 million was driven by the widening of NPA credit spreads, impact of lower interest rates that resulted in NPA volume gains from higher expected GMWB payments, gains from higher equity markets, and gains from the review and update of actuarial assumptions, partially offset by the impact of lower interest rates on the change in the fair value of embedded derivatives excluding NPA, net of the hedging portfolio.
The change in the fair value of the GMWB embedded derivatives, excluding NPA and update of actuarial assumptions in 2021 reflected gains from increases in interest rates and equity markets. In 2020, the change in the fair value of the GMWB embedded derivatives, excluding NPA and update of actuarial assumptions, reflected losses from decreases in interest rates, partially offset by gains from higher equity markets.
Fair value gains or losses in the hedging portfolio are typically not fully offset by increases or decreases in liabilities on a GAAP basis, due to the NPA and other risk margins used for GAAP valuation that cause the embedded derivatives to be less sensitive to changes in market rates than the hedge portfolio. On an economic basis, the changes in the fair value of the hedge portfolio were partially offset by the changes in the economic hedge target, as discussed below. In 2021, we had a net mark to market gain of approximately $109 million from our hedging activities related to our economic hedge target primarily driven by higher equity markets, partially offset by losses from the review and update of actuarial assumptions. In 2020, we estimated a net mark to market gain of approximately $295 million from our hedging activities related to our economic hedge target primarily driven by gains from higher equity markets and gains from the review and update of actuarial assumptions offset by tightening credit spreads.
Change in Economic Hedge Target
The decrease in the economic hedge target liability in 2021 was primarily driven by higher interest rates and higher equity markets, partially offset by losses from the review and update of actuarial assumptions. The increase in the economic hedge target liability in 2020 was primarily due to lower interest rates and tighter credit spreads, offset by benefits from the review and update of assumptions and higher equity markets.
Change in Fair Value of the Hedging Portfolio
The changes in the fair value of the economic hedge target and, to a lesser extent, the embedded derivative valuation under GAAP, were offset in part by the following changes in the fair value of the variable annuity hedging portfolio:
Changes in the fair value of interest rate derivative contracts, which included swaps, swaptions and futures, resulted in losses driven by higher interest rates in 2021 compared to gains driven by lower interest rates in 2020.
Changes in the fair value of equity derivative contracts, which included futures and options, resulted in losses in 2021 and 2020, and varied based on the relative change in equity market returns in the respective periods.
Changes in the fair value of fixed maturity securities, primarily corporate bonds, are used as a capital-efficient way to economically hedge interest rate and credit spread-related risk. The change in the fair value of the corporate bond hedging program in 2021 reflected losses due to higher interest rates. The gains in 2020 reflected the impact of decreases in interest rates and tightening credit spreads.
AIG | 2021 Form 10-K 135
DAC
The following table summarizes the major components of the changes in DAC, including VOBA, within the Life and Retirement companies:
Years Ended December 31, |
|
|
|
|
|
|
(in millions) |
| 2021 |
| 2020 |
| 2019 |
Balance, beginning of year | $ | 7,316 | $ | 8,119 | $ | 9,286 |
Initial allowance upon the adoption of the current expected credit loss accounting standard |
| - |
| 15 |
| - |
Acquisition costs deferred |
| 1,010 |
| 910 |
| 1,180 |
Amortization expense: |
|
|
|
|
|
|
Update of assumptions included in adjusted pre-tax income |
| (139) |
| 225 |
| 203 |
Related to realized gains and losses |
| (33) |
| 8 |
| 51 |
All other operating amortization |
| (834) |
| (856) |
| (875) |
Increase (decrease) in DAC due to foreign exchange |
| (10) |
| 18 |
| 18 |
Change related to unrealized depreciation (appreciation) of investments |
| 776 |
| (1,123) |
| (1,744) |
Balance, end of year, excluding Fortitude Re DAC(a) |
| 8,086 |
| 7,316 |
| 8,119 |
DAC on business ceded to Fortitude Re(b) |
| - |
| - |
| 456 |
Balance, end of year | $ | 8,086 | $ | 7,316 | $ | 8,575 |
(a)DAC balance excluding the amount related to unrealized depreciation (appreciation) of investments was $10.5 billion, $10.5 billion and $10.1 billion at December 31, 2021, 2020 and 2019, respectively.
(b)As of closing of the Majority Interest Fortitude Sale on June 2, 2020, these DAC balances were deemed to be not recoverable and were written off.
The net impact to DAC amortization from the update of actuarial assumptions for estimated gross profits, including those reported within change in DAC related to net realized gains (losses), represented one percent and two percent of the DAC balance excluding the amount related to unrealized depreciation (appreciation) of investments as of December 31, 2021 and 2020, respectively.
Reversion to the Mean
The projected separate account returns on variable annuities use a reversion-to-the-mean (RTM) approach, under which lower historical returns lead to higher current returns and vice versa. The RTM rate is updated quarterly based on market returns and can change dramatically in periods where market returns move significantly. An anchor date is set in the past, such that the historical returns since the anchor date, combined with the updated RTM rate applied for over the first five years of the projection brings the average growth over the combined period to the long-term rate 7.00 percent assumption. The criterion to review the five-year RTM anchor date is for the current RTM rate to be less than zero or more than double the long-term growth rate assumption for three consecutive months. When the anchor date is reset, the RTM rate is determined to be approximately one-half of the long-term rate. Should market returns be significantly out of line with our expectations there are caps and floors that if breached would trigger a reassessment of the long-term rate and the RTM rate.
For additional information on assumptions related to our reversion to the mean methodology see Critical Accounting Estimates – Estimated Gross Profits to Value Deferred Acquisition Costs and Unearned Revenue for Investment-Oriented Products.
DAC and Reserves Related to Unrealized Appreciation of Investments
DAC and Reserves for universal life insurance and investment-oriented products are adjusted at each balance sheet date to reflect the change in DAC, unearned revenue, and benefit reserves with an offset to Other comprehensive income (loss) (OCI) as if securities available for sale had been sold at their stated aggregate fair value and the proceeds reinvested at current yields (changes related to unrealized appreciation (depreciation) of investments). Similarly, for long-duration traditional products, significant unrealized appreciation of investments in a sustained low interest rate environment may cause additional future policy benefit liabilities with an offset to OCI to be recorded.
Changes related to unrealized appreciation (depreciation) of investments related to DAC and unearned revenue generally move in the opposite direction of the change in unrealized appreciation of the available for sale securities portfolio, reducing the reported DAC and unearned revenue balance when market interest rates decline. Conversely, changes related to unrealized appreciation (depreciation) of investments related to benefit reserves generally move in the same direction as the change in unrealized appreciation of the available for sale securities portfolio, increasing reported future policy benefit liabilities balance when market interest rates decline.
136 AIG | 2021 Form 10-K
Market conditions in 2021 drove a $7.4 billion decrease in the unrealized appreciation of the available for sale fixed maturity securities portfolio held to support the Life and Retirement businesses at December 31, 2021 compared to December 31, 2020. At December 31, 2021, the changes related to unrealized appreciation (depreciation) of investments reflected increases in amortized balances including DAC and unearned revenue reserves, while accrued liabilities such as policyholder benefit liabilities decreased $941 million from December 31, 2020.
Reserves
The following table presents a rollforward of insurance reserves by operating segments for Life and Retirement, including future policy benefits, policyholder contract deposits, other policyholder funds, and separate account liabilities, as well as Retail Mutual Funds and Group Retirement mutual fund assets under administration:
Years Ended December 31, |
|
|
| |||
(in millions) |
| 2021 |
| 2020 |
| 2019 |
Individual Retirement |
|
|
|
|
|
|
Balance at beginning of year, gross | $ | 148,837 | $ | 144,753 | $ | 132,529 |
Premiums and deposits |
| 13,916 |
| 10,370 |
| 14,899 |
Surrenders and withdrawals |
| (11,368) |
| (12,023) |
| (13,135) |
Death and other contract benefits |
| (3,138) |
| (3,075) |
| (3,204) |
Subtotal |
| 148,247 |
| 140,025 |
| 131,089 |
Change in fair value of underlying assets and reserve accretion, net of policy fees |
| 5,457 |
| 7,285 |
| 11,492 |
Cost of funds(a) |
| 1,683 |
| 1,675 |
| 1,666 |
Other reserve changes |
| 114 |
| (148) |
| 506 |
Less the sale of retail mutual fund assets |
| (7,009) |
| - |
| - |
Balance at end of year |
| 148,492 |
| 148,837 |
| 144,753 |
Reinsurance ceded |
| (308) |
| (313) |
| (308) |
Total Individual Retirement insurance reserves and mutual fund assets | $ | 148,184 | $ | 148,524 | $ | 144,445 |
Group Retirement |
|
|
|
|
|
|
Balance at beginning of year, gross | $ | 110,651 | $ | 102,049 | $ | 91,685 |
Premiums and deposits |
| 7,766 |
| 7,496 |
| 8,346 |
Surrenders and withdrawals |
| (10,097) |
| (8,696) |
| (10,317) |
Death and other contract benefits |
| (877) |
| (740) |
| (675) |
Subtotal |
| 107,443 |
| 100,109 |
| 89,039 |
Change in fair value of underlying assets and reserve accretion, net of policy fees |
| 10,240 |
| 9,644 |
| 11,939 |
Cost of funds(a) |
| 1,138 |
| 1,125 |
| 1,128 |
Other reserve changes |
| (329) |
| (227) |
| (57) |
Balance at end of year |
| 118,492 |
| 110,651 |
| 102,049 |
Total Group Retirement insurance reserves and mutual fund assets | $ | 118,492 | $ | 110,651 | $ | 102,049 |
Life Insurance |
|
|
|
|
|
|
Balance at beginning of year, gross | $ | 27,998 | $ | 27,397 | $ | 24,844 |
Premiums and deposits |
| 4,229 |
| 4,046 |
| 3,931 |
Surrenders and withdrawals |
| (487) |
| (484) |
| (663) |
Death and other contract benefits |
| (592) |
| (557) |
| (663) |
Subtotal |
| 31,148 |
| 30,402 |
| 27,449 |
Change in fair value of underlying assets and reserve accretion, net of policy fees |
| (808) |
| (1,133) |
| (1,138) |
Cost of funds(a) |
| 353 |
| 373 |
| 374 |
Other reserve changes |
| (2,278) |
| (1,644) |
| 712 |
Balance at end of year |
| 28,415 |
| 27,998 |
| 27,397 |
Reinsurance ceded |
| (1,554) |
| (1,437) |
| (1,358) |
Total Life Insurance reserves | $ | 26,861 | $ | 26,561 | $ | 26,039 |
AIG | 2021 Form 10-K 137
Institutional Markets |
|
|
|
|
|
|
Balance at beginning of year, gross | $ | 27,342 | $ | 23,673 | $ | 21,762 |
Premiums and deposits |
| 4,948 |
| 4,846 |
| 2,822 |
Surrenders and withdrawals |
| (1,821) |
| (1,788) |
| (984) |
Death and other contract benefits |
| (887) |
| (886) |
| (1,102) |
Subtotal |
| 29,582 |
| 25,845 |
| 22,498 |
Change in fair value of underlying assets and reserve accretion, net of policy fees |
| 741 |
| 823 |
| 788 |
Cost of funds(a) |
| 274 |
| 304 |
| 356 |
Other reserve changes |
| (333) |
| 370 |
| 31 |
Balance at end of year |
| 30,264 |
| 27,342 |
| 23,673 |
Reinsurance ceded |
| (45) |
| (45) |
| (44) |
Total Institutional Markets reserves | $ | 30,219 | $ | 27,297 | $ | 23,629 |
Total insurance reserves and mutual fund assets |
|
|
|
|
|
|
Balance at beginning of year, gross | $ | 314,828 | $ | 297,872 | $ | 270,820 |
Premiums and deposits |
| 30,859 |
| 26,758 |
| 29,998 |
Surrenders and withdrawals |
| (23,773) |
| (22,991) |
| (25,099) |
Death and other contract benefits |
| (5,494) |
| (5,258) |
| (5,644) |
Subtotal |
| 316,420 |
| 296,381 |
| 270,075 |
Change in fair value of underlying assets and reserve accretion, net of policy fees |
| 15,630 |
| 16,619 |
| 23,081 |
Cost of funds(a) |
| 3,448 |
| 3,477 |
| 3,524 |
Other reserve changes |
| (2,826) |
| (1,649) |
| 1,192 |
Less the sale of retail mutual fund assets |
| (7,009) |
| - |
| - |
Balance at end of year, excluding Fortitude Re reserves |
| 325,663 |
| 314,828 |
| 297,872 |
Fortitude Re reserves(b) |
| 27,654 |
| 28,505 |
| 30,441 |
Balance at end of year, including Fortitude Re reserves |
| 353,317 |
| 343,333 |
| 328,313 |
Fortitude Re reinsurance ceded(b) |
| (27,654) |
| (28,505) |
| - |
Reinsurance ceded |
| (1,907) |
| (1,795) |
| (1,710) |
Total insurance reserves and mutual fund assets | $ | 323,756 | $ | 313,033 | $ | 326,603 |
(a) Excludes amortization of deferred sales inducements.
(b) Includes amounts related to policies where AIG has partially ceded to other reinsurers and Fortitude Re.
Insurance reserves, as well as Retail Mutual Funds and Group Retirement mutual fund assets under administration, were comprised of the following balances:
|
|
|
| December 31, |
| December 31, |
(in millions) |
|
|
| 2021 |
| 2020(b) |
Future policy benefits |
|
| $ | 57,749 | $ | 54,645 |
Policyholder contract deposits |
|
|
| 156,844 |
| 154,669 |
Other policyholder funds(a) |
|
|
| 833 |
| 957 |
Separate account liabilities |
|
|
| 109,111 |
| 100,290 |
Total insurance reserves |
|
|
| 324,537 |
| 310,561 |
Mutual fund assets |
|
|
| 28,780 |
| 32,772 |
Total insurance reserves and mutual fund assets |
|
| $ | 353,317 | $ | 343,333 |
(a) Excludes unearned revenue liability.
(b) Liabilities for certain universal life products were reclassified from Policyholder contract deposits to Future policy benefits for life and accident and health insurance contracts. For additional information, see Note 1 to the Consolidated Financial Statements.
138 AIG | 2021 Form 10-K
Liquidity and Capital Resources
Overview
Liquidity refers to the ability to generate sufficient cash resources to meet our payment obligations. It is defined as cash and unencumbered assets that can be monetized in a short period of time at a reasonable cost. We endeavor to manage our liquidity prudently through various risk committees, policies and procedures, and a stress testing and liquidity risk framework established by our Treasury group with oversight by Enterprise Risk Management (ERM). Our liquidity risk framework is designed to manage liquidity at both AIG Parent and its subsidiaries to meet our financial obligations for a minimum of six months under a liquidity stress scenario.
For additional information see Enterprise Risk Management – Risk Appetite, Limits, Identification and Measurement and Enterprise Risk Management – Liquidity Risk Management below.
Capital refers to the long-term financial resources available to support the operation of our businesses, fund business growth, and cover financial and operational needs that arise from adverse circumstances. Our primary source of ongoing capital generation is derived from the profitability of our insurance subsidiaries. We must comply with numerous constraints on our minimum capital positions. These constraints drive the requirements for capital adequacy at AIG and the individual businesses and are based on internally-defined risk tolerances, regulatory requirements, rating agency and creditor expectations and business needs. Actual capital levels are monitored on a regular basis, and using ERM’s stress testing methodology, we evaluate the capital impact of potential macroeconomic, financial and insurance stresses in relation to the relevant capital constraints of both AIG and our insurance subsidiaries.
We believe that we have sufficient liquidity and capital resources to satisfy future requirements and meet our obligations to policyholders, customers, creditors and debt-holders, including those arising from reasonably foreseeable contingencies or events.
Nevertheless, some circumstances may cause our cash or capital needs to exceed projected liquidity or readily deployable capital resources. Additional collateral calls, deterioration in investment portfolios or reserve strengthening affecting statutory surplus, higher surrenders of annuities and other policies, downgrades in credit ratings, catastrophic losses or fluctuations in the capital markets generally may result in significant additional cash or capital needs and loss of sources of liquidity and capital. Other potential events that could cause a liquidity strain include an economic collapse of a nation or region significant to our operations, nationalization, catastrophic terrorist acts, pandemics or other events causing economic or political upheaval. In addition, regulatory and other legal restrictions could limit our ability to transfer funds freely, either to or from our subsidiaries.
For information regarding risks associated with COVID-19, see Part I, Item 1A. – Risk Factors – Market Conditions – “COVID-19 has adversely affected, and is expected to continue to adversely affect, our global business, results of operations, financial condition and liquidity, and its ultimate impact will depend on future developments that are uncertain and cannot be predicted”.
Depending on market conditions, regulatory and rating agency considerations and other factors, we may take various liability and capital management actions. Liability management actions may include, but are not limited to, repurchasing or redeeming outstanding debt, issuing new debt or engaging in debt exchange offers. Capital management actions may include, but are not limited to, issuing preferred stock, paying dividends to our shareholders on the AIG Common Stock, par value $2.50 per share (AIG Common Stock), paying dividends to the holders of our Series A 5.85% Non-Cumulative Perpetual Preferred Stock (Series A Preferred Stock), and repurchases of AIG Common Stock.
AIG | 2021 Form 10-K 139
LIQUIDITY AND CAPITAL RESOURCES HIGHLIGHTS Sources Liquidity to AIG Parent from Subsidiaries During 2021, our General Insurance companies distributed cash and fixed maturity securities of $2.3 billion, and our Life and Retirement companies distributed $2.8 billion of cash and $38 million of AIG Common Stock held by certain Life and Retirement companies to AIG Parent or applicable intermediate holding companies. Warrant Exercises In January 2021, we received aggregate proceeds of approximately $92 million in connection with warrant exercises to purchase approximately 2 million shares of AIG Common Stock that occurred prior to the January 19, 2021 expiration of warrants to purchase shares of AIG Common Stock. Tax Sharing Payment from Fortitude Re In January 2021, we received $109 million in tax sharing payments in the form of cash from Fortitude Re related to periods prior to the Majority Interest Fortitude Sale. The tax sharing payments from Fortitude Re may be subject to further adjustment in future periods. Blackstone Transactions In November 2021, AIG completed the sale of a 9.9 percent equity interest in SAFG to an affiliate of Blackstone for $2.2 billion. In December 2021, AIG Parent and AGL received net proceeds of $3.9 billion and $0.5 billion, respectively, from the sale of AIG’s interests in a U.S. affordable housing portfolio to Blackstone Real Estate Income Trust. |
Uses General Borrowings During 2021, $4.0 billion of debt categorized as general borrowings matured, was repaid or redeemed, including the following: Redeemed $1.5 billion aggregate principal amount of our 3.300% Notes Due 2021 for a redemption price of 100 percent of the principal amount, plus accrued and unpaid interest. Repurchased, through cash tender offers, $945 million aggregate principal amount of certain notes and debentures issued or guaranteed by AIG for an aggregate purchase price of approximately $1.3 billion. Redeemed $1.5 billion aggregate principal amount of our 4.875% Notes Due 2022 for a redemption price of 103.156 percent of the principal amount, plus accrued and unpaid interest. We made interest payments on our general borrowings totaling $1.0 billion during 2021. Of this amount, AIG Parent made interest payments on AIG Parent-issued debt instruments totaling $941 million during 2021. Dividends During 2021, we made: Four quarterly cash dividend payments of $365.625 per share on AIG’s Series A Preferred Stock totaling $29 million. Four quarterly cash dividend payments of $0.32 per share on AIG Common Stock totaling $1.1 billion. Repurchases of Common Stock* During 2021, AIG Parent repurchased approximately 50 million shares of AIG Common Stock, for an aggregate purchase price of approximately $2.6 billion. Approximately $92 million of these share repurchases were funded with proceeds received from warrant exercises that occurred prior to the expiration of warrants to purchase shares of AIG Common Stock on January 19, 2021. IRS Tax Prepayment During 2021, AIG Parent made aggregate prepayments of approximately $364 million to the U.S. Treasury in connection with certain settlement agreements described in Tax Matters below. |
* Pursuant to an Exchange Act Rule 10b5-1 repurchase plan, from January 1, 2022 to February 15, 2022, we repurchased approximately $522 million of additional shares of AIG Common Stock. As of February 15, 2022, approximately $3.4 billion remained under our share repurchase authorization.
140 AIG | 2021 Form 10-K
Analysis of Sources and Uses of Cash
Operating Cash Flow Activities
Insurance companies generally receive most premiums in advance of the payment of claims or policy benefits. The ability of insurance companies to generate positive cash flow is affected by the frequency and severity of losses under their insurance policies, policy retention rates, effective management of our investment portfolio and operating expense discipline.
Interest payments totaled $1.3 billion and $1.1 billion in 2021 and 2020, respectively. Excluding interest payments, AIG had operating cash inflows of $7.6 billion in 2021 compared to operating cash inflows of $2.1 billion in 2020.
Investing Cash Flow Activities
Net cash used in investing activities in 2021 included approximately $4.7 billion of proceeds from divestitures. Net cash used in investing activities in 2020 included $2.2 billion of net cash proceeds from the sale of Fortitude Holdings.
Financing Cash Flow Activities
Net cash used in financing activities in 2021 reflected:
• approximately $1.1 billion in the aggregate to pay a dividend of $0.32 per share on AIG Common Stock in each quarter of 2021;
• approximately $29 million in the aggregate to pay a dividend of $365.625 per share on AIG’s Series A Preferred Stock in each quarter of 2021;
• approximately $2.6 billion to repurchase approximately 50 million shares of AIG Common Stock;
• approximately $4.0 billion in net outflows from the issuance, repayment and cash tender of long-term debt;
• approximately $156 million in net outflows from the issuance and repayment of debt of consolidated investment entities; and
• approximately $2.2 billion in net inflows from the sale of a 9.9 percent equity interest in SAFG to an affiliate of Blackstone.
Net cash provided by financing activities in 2020 reflected:
• approximately $1.1 billion in the aggregate to pay a dividend of $0.32 per share on AIG Common Stock in each quarter of 2020;
• approximately $29 million in the aggregate to pay a dividend of $365.625 per share on AIG’s Series A Preferred Stock in each quarter of 2020;
• $500 million to repurchase approximately 12 million shares of AIG Common Stock;
• approximately $2.3 billion in net inflows from the issuance and repayment of long-term debt; and
• approximately $655 million in net outflows from the issuance and repayment of debt of consolidated investment entities.
AIG | 2021 Form 10-K 141
Liquidity and Capital Resources of AIG Parent and Subsidiaries
AIG Parent
As of December 31, 2021, AIG Parent and applicable intermediate holding companies had approximately $15.2 billion in liquidity sources. AIG Parent’s liquidity sources are primarily held in the form of cash, short-term investments and publicly traded, investment grade rated fixed maturity securities and also include a committed, revolving syndicated credit facility. Fixed maturity securities primarily include U.S. government and government sponsored entity securities, U.S. agency mortgage-backed securities, corporate and municipal bonds and certain other highly rated securities. AIG Parent actively manages its assets and liabilities in terms of products, counterparties and duration. Based upon an assessment of funding needs, the liquidity sources can be readily monetized through sales or repurchase agreements or contributed as admitted assets to regulated insurance companies. AIG Parent liquidity is monitored through the use of various internal liquidity risk measures. AIG Parent’s primary sources of liquidity are dividends, distributions, loans and other payments from subsidiaries and credit facilities. AIG Parent’s primary uses of liquidity are for debt service, capital and liability management, and operating expenses.
We believe that we have sufficient liquidity and capital resources to satisfy our reasonably foreseeable future requirements and meet our obligations to our creditors, debt-holders and insurance company subsidiaries. We expect to access the debt and preferred equity markets from time to time to meet funding requirements as needed.
We utilize our capital resources to support our businesses, with the majority of capital allocated to our insurance operations. Should we have or generate more capital than is needed to support our business strategies (including organic growth or acquisition opportunities) or mitigate risks inherent to our business, we may develop plans to distribute such capital to shareholders via dividends or AIG Common Stock repurchase authorizations or deploy such capital towards liability management.
In the normal course, it is expected that a portion of the capital released by our insurance companies, by our other operations or through the utilization of AIG’s deferred tax assets may be available to support our business strategies, for distribution to shareholders or for liability management.
In developing plans to distribute capital, AIG considers a number of factors, including, but not limited to: AIG’s business and strategic plans, expectations for capital generation and utilization, AIG’s funding capacity and capital resources in comparison to internal benchmarks, as well as rating agency expectations, regulatory requirements, bank creditor covenants and internal stress tests for capital.
The following table presents AIG Parent and applicable intermediate holding companies liquidity sources:
| As of | As of | ||
(in millions) | December 31, 2021 | December 31, 2020 | ||
Cash and short-term investments(a) | $ | 4,334 | $ | 6,762 |
Unencumbered fixed maturity securities(b) |
| 6,357 |
| 3,711 |
Total AIG Parent liquidity |
| 10,691 |
| 10,473 |
Available capacity under committed, syndicated credit facility(c) |
| 4,500 |
| 4,500 |
Total AIG Parent liquidity sources | $ | 15,191 | $ | 14,973 |
(a) Cash and short-term investments include agreements in which securities are purchased by us under agreements to resell totaling $1.9 billion and $5.4 billion as of December 31, 2021 and 2020, respectively.
(b) Unencumbered securities consist of publicly traded, investment grade rated fixed maturity securities. Fixed maturity securities primarily include U.S. government and government sponsored entity securities, U.S. agency mortgage-backed securities, corporate and municipal bonds and certain other highly rated securities.
(c) For additional information relating to this committed, syndicated credit facility see – Credit Facilities below.
Insurance Companies
We expect that our insurance companies will be able to continue to satisfy reasonably foreseeable future liquidity requirements and meet their obligations, including those arising from reasonably foreseeable contingencies or events, through cash from operations and, to the extent necessary, monetization of invested assets. Our insurance companies’ liquidity resources are primarily held in the form of cash, short-term investments and publicly traded, investment grade rated fixed maturity securities.
Each of our material insurance companies’ liquidity is monitored through various internal liquidity risk measures. The primary sources of liquidity are premiums, fees, reinsurance recoverables and investment income and maturities. The primary uses of liquidity are paid losses, reinsurance payments, benefit claims, surrenders, withdrawals, interest payments, dividends, expenses, investment purchases and collateral requirements.
142 AIG | 2021 Form 10-K
Our insurance companies may require additional funding to meet capital or liquidity needs under certain circumstances. For example, large catastrophes may require us to provide additional support to the affected operations of our General Insurance companies, and a shift in interest rates may require us to provide support to the affected operations of our Life and Retirement companies.
Downgrades in our credit ratings could put pressure on the insurer financial strength ratings of our subsidiaries, which could result in non-renewals or cancellations by policyholders and adversely affect a subsidiary’s ability to meet its own obligations. Increases in market interest rates may adversely affect the financial strength ratings of our subsidiaries, as rating agency capital models may reduce the amount of available capital relative to required capital.
Management believes that because of the size and liquidity of our Life and Retirement companies’ investment portfolios, normal deviations from projected claim or surrender experience would not create significant liquidity risk. Furthermore, our Life and Retirement companies’ products contain certain features that mitigate surrender risk, including surrender charges. However, in times of extreme capital markets disruption or as a result of fluctuations in the capital markets generally, liquidity needs could outpace resources.
As part of their risk management framework, our insurance companies continue to evaluate and, where appropriate, pursue strategies and programs to improve their liquidity position and facilitate their ability to maintain a fully invested asset portfolio.
Certain of our U.S. insurance companies are members of the FHLBs in their respective districts. Borrowings from FHLBs are used to supplement liquidity or for other uses deemed appropriate by management. Our U.S. General Insurance companies had no outstanding borrowings from FHLBs at both December 31, 2021 and 2020. Our U.S. Life and Retirement companies had $3.6 billion which were due to FHLBs in their respective districts at both December 31, 2021 and 2020, under funding agreements issued through our Individual Retirement, Group Retirement and Institutional Markets operating segments, which were reported in Policyholder contract deposits. Proceeds from funding agreements are generally invested in fixed income securities and other investments intended to generate spread income. These investment contracts do not have mortality or morbidity risk and are similar to GICs. In addition, our U.S. Life and Retirement companies had no outstanding borrowings in the form of cash advances from FHLBs at both December 31, 2021 and 2020.
Certain of our U.S. Life and Retirement companies have programs, which began in 2012, that lend securities from their investment portfolio to supplement liquidity or for other uses as deemed appropriate by management. Under these programs, these U.S. Life and Retirement companies lend securities to financial institutions and receive cash as collateral equal to 102 percent of the fair value of the loaned securities. Cash collateral received is invested in short-term investments or partially used for short-term liquidity purposes. Additionally, the aggregate amount of securities that a Life and Retirement company is able to lend under its program at any time is limited to five percent of its general account statutory-basis admitted assets. Our U.S. Life and Retirement companies had $3.3 billion and $3.4 billion of securities subject to these agreements at December 31, 2021 and 2020, respectively, and $3.4 billion and $3.5 billion of liabilities to borrowers for collateral received at December 31, 2021 and 2020, respectively.
AIG generally manages capital between AIG Parent and our insurance companies through internal, Board-approved policies and limits, as well as management standards. In addition, AIG Parent has unconditional capital maintenance agreements in place with certain subsidiaries. Nevertheless, regulatory and other legal restrictions could limit our ability to transfer capital freely, either to or from our subsidiaries.
AIG Parent and/or certain subsidiaries are parties to several letter of credit agreements with various financial institutions, which issue letters of credit from time to time in support of our insurance companies. These letters of credit are subject to reimbursement by AIG Parent and/or certain subsidiaries in the event of a drawdown of these letters of credit. Letters of credit issued in support of the General Insurance companies totaled approximately $4.8 billion at December 31, 2021. Letters of credit issued in support of the Life and Retirement companies totaled approximately $361 million at December 31, 2021.
In 2021, our General Insurance companies collectively paid to AIG Parent or applicable intermediate holding companies a total of approximately $2.3 billion in dividends in the form of cash and fixed maturity securities and received $2 million in tax sharing payments in the form of cash. The fixed maturity securities primarily included U.S. treasuries and securities issued by U.S. agencies.
In 2021, our Life and Retirement companies collectively paid to AIG Parent or applicable intermediate holding companies a total of approximately $1.3 billion in dividends in the form of cash and AIG Common Stock and $1.5 billion in tax sharing payments in the form of cash. On November 1, 2021, SAFG declared a dividend payable to AIG Parent in the amount of $8.3 billion. In connection with such dividend, SAFG issued a promissory note to AIG Parent in the amount of $8.3 billion, which will be required to be paid to AIG Parent prior to the initial public offering of SAFG. As of February 16, 2022, no amounts have been paid under the promissory note.
AIG | 2021 Form 10-K 143
Tax Matters
In October 2020, the Southern District of New York dismissed the case for the 1997 tax year related to the disallowance of foreign tax credits associated with cross border financing transactions based upon the settlement reached between AIG and the government. The settlement concluded our ongoing dispute related to the disallowance of foreign tax credits associated with cross border financing transactions for all years and as a result of the settlement, we will be required to make a payment to the U.S. Treasury. The amount we currently expect to pay based on settlement terms is approximately $0.2 billion, including obligations of AIG Parent and subsidiaries. This amount is net of payments previously made with respect to cross border financing transactions from tax years 1997 through 2006 and other matters related to 2006 and prior, including prepayments of approximately $548 million, $354 million and $10 million that AIG made to the U.S. Treasury in June 2020, June 2021 and October 2021, respectively. The amount also includes interest that will become due after review of the interest calculations and will reflect benefits from the application of interest netting which AIG has requested. While we continue to finalize the interest calculations with the IRS, the remaining amounts may not be determined until 2023.
For additional information regarding this matter see Note 21 to the Consolidated Financial Statements.
Credit Facilities
On November 19, 2021, we entered into a new committed, revolving syndicated credit facility (the Facility) as a potential source of liquidity for general corporate purposes. The Facility provides for aggregate commitments by the bank syndicate to provide unsecured revolving loans and/or standby letters of credit of up to $4.5 billion without any limits on the type of borrowings and is scheduled to expire in November 2026.
As of December 31, 2021, a total of $4.5 billion remains available under the Facility. Our ability to utilize the Facility is not contingent on our credit ratings. However, our ability to utilize the Facility is conditioned on the satisfaction of certain legal, operating, administrative and financial covenants and other requirements contained in the Facility. These include covenants relating to our maintenance of a specified total consolidated net worth and total consolidated debt to total consolidated capitalization. Failure to satisfy these and other requirements contained in the Facility would restrict our access to the Facility and could have a material adverse effect on our financial condition, results of operations and liquidity. We expect to utilize the Facility from time to time, and may use the proceeds for general corporate purposes.
In connection with our entry into the Facility, we terminated our prior $4.5 billion credit facility, and no amounts were outstanding under the prior facility at the time of termination.
Contractual Obligations
The following table summarizes material contractual obligations in total, and by remaining maturity:
December 31, 2021 |
|
| Payments due by Period | |||||
|
| Total |
|
| 2023 - |
|
| |
(in millions) |
| Payments |
| 2022 |
| 2024 |
| Thereafter |
Loss reserves(a) | $ | 80,855 | $ | 22,309 | $ | 23,036 | $ | 35,510 |
Insurance and investment contract liabilities |
| 293,624 |
| 16,435 |
| 36,536 |
| 240,653 |
Long-term debt(b) |
| 23,741 |
| 68 |
| 3,103 |
| 20,570 |
Interest payments on long-term debt |
| 13,683 |
| 1,002 |
| 1,874 |
| 10,807 |
Total | $ | 411,903 | $ | 39,814 | $ | 64,549 | $ | 307,540 |
(a) Represents loss reserves, undiscounted and gross of reinsurance.
(b) Does not reflect $6.4 billion of debt of consolidated investment entities, for which recourse is limited to the assets of the respective investment entities and for which there is no recourse to the general credit of AIG.
Loss Reserves
Loss reserves relate to our General Insurance companies and represent estimates of future loss and loss adjustment expense payments based on historical loss development payment patterns. The amounts presented in the above table are undiscounted and therefore exceed the liability for unpaid losses and loss adjustment expenses, including allowance for credit losses, as presented on the Consolidated Balance Sheets. Due to the significance of the assumptions used, the payments by period presented above could be materially different from actual required payments. We believe that our General Insurance companies maintain adequate financial resources to meet the actual required payments under these obligations.
144 AIG | 2021 Form 10-K
For additional information on loss reserves see Critical Accounting Estimates – Loss Reserves and Note 12 to the Consolidated Financial Statements.
Insurance and Investment Contract Liabilities
Insurance and investment contract liabilities, including GIC liabilities, relate to our Life and Retirement companies. These liabilities include various investment-type products with contractually scheduled maturities, including periodic payments. These liabilities also include benefit and claim liabilities, of which a significant portion represents policies and contracts that do not have stated contractual maturity dates and may not result in any future payment obligations. For these policies and contracts (i) we are not currently making payments until the occurrence of an insurable event, such as death or disability, (ii) payments are conditional on survivorship or (iii) payment may occur due to a surrender or other non-scheduled event beyond our control.
We have made significant assumptions to determine the estimated undiscounted cash flows of these contractual policy benefits. These assumptions include mortality, morbidity, future lapse rates, expenses, investment returns and interest crediting rates, offset by expected future deposits and premiums on in-force policies. Due to the significance of the assumptions, the periodic amounts presented could be materially different from actual required payments. The amounts presented in the above table are undiscounted and therefore exceed the liabilities for future policy benefits for life and accident and health insurance contracts, and policyholder contract deposits included in the Consolidated Balance Sheets.
We believe that our Life and Retirement companies have adequate financial resources to meet the payments actually required under these obligations. These subsidiaries have substantial liquidity in the form of cash and short-term investments. In addition, our Life and Retirement companies maintain significant levels of investment grade rated fixed maturity securities, including substantial holdings in government and corporate bonds, and could seek to monetize those holdings in the event operating cash flows are insufficient. We expect liquidity needs related to GIC liabilities to be funded through cash flows generated from maturities and sales of invested assets.
For additional information on loss reserves see Critical Accounting Estimates – Loss Reserves and Notes 12 and 13 to the Consolidated Financial Statements.
Long-Term Debt and Interest Payments on Long-Term Debt
The amounts presented in this table represent AIG's total long-term debt outstanding and associated future interest payments due on such debt.
For additional information on outstanding debt, see “Debt” below.
Other Contractual Obligations
We have no other significant contractual obligations not reflected in the table above that in aggregate would have a material effect on AIG's financial position, revenues or expenses, results of operations, liquidity, cash requirements or capital resources.
Off-Balance Sheet Arrangements and Commercial Commitments
In the normal course of business, AIG and our subsidiaries enter into commitments under which we may be required to make payments in the future on a contingent basis.
The following table summarizes Off-Balance Sheet Arrangements and Commercial Commitments in total, and by remaining maturity:
December 31, 2021 |
|
|
| Amount of Commitment Expiring | ||||
|
| Total Amounts |
|
|
| 2023 - |
|
|
(in millions) |
| Committed |
| 2022 |
| 2024 |
| Thereafter |
Commitments: |
|
|
|
|
|
|
|
|
Investment commitments | $ | 7,254 | $ | 4,132 | $ | 2,379 | $ | 743 |
Commitments to extend credit |
| 5,780 |
| 1,774 |
| 2,769 |
| 1,237 |
Letters of credit |
| 986 |
| 752 |
| 201 |
| 33 |
Total(a)(b) | $ | 14,020 | $ | 6,658 | $ | 5,349 | $ | 2,013 |
(a) Excludes guarantees, CMAs or other support arrangements between AIG consolidated entities.
(b) Excludes commitments with respect to pension plans. The annual pension contribution for 2022 is expected to be approximately $65 million.
AIG | 2021 Form 10-K 145
Investment commitments
We enter into investment commitments in the normal course of business that are aligned with and support our investment strategies. These represent commitments to investment in private equity funds, hedge funds and other funds, as well as commitments to purchase and develop real estate in the United States and abroad. The commitments to invest in private equity funds, hedge funds and other funds are called at the discretion of each fund, as needed for funding new investments or expenses of the fund. The expiration of these commitments is estimated based on the expected life cycle of the related funds, consistent with past trends of requirements for funding. These commitments are primarily made by insurance and real estate subsidiaries of the Company.
We also enter into arrangements with variable interest entities (VIEs) and consolidate a VIE when we are the primary beneficiary of the entity.
For additional information on investment commitments and VIEs see Note 9 to the Consolidated Financial Statements.
Commitments to extend credit
As part of our normal course of business lending operations, we enter into commitments to fund mortgage loans at certain interest rates and various other terms, within a stated period of time. Such commitments are legally binding and generally made by insurance subsidiaries of the Company.
Letters of credit
AIG is party to several letter of credit agreements with various financial institutions, which issue letters of credit from time to time for the benefit of third parties in support of our businesses. These letters of credit are subject to reimbursement by AIG in the event of a drawdown.
Other commitments and guarantees
We have no other significant guarantees or commitments not reflected in the table above that in aggregate would have a material effect on AIG's financial position, revenues or expenses, results of operations, liquidity, cash requirements or capital resources.
Indemnification Agreements
We are subject to financial guarantees and indemnity arrangements in connection with our sales of businesses. These arrangements may be triggered by declines in asset values, specified business contingencies, the realization of contingent liabilities, litigation developments, or breaches of representations, warranties or covenants provided by us. These arrangements are typically subject to time limitations, defined by contract or by operation of law, such as by prevailing statutes of limitation. Depending on the specific terms of the arrangements, the maximum potential obligation may or may not be subject to contractual limitations.
We have recorded liabilities for certain of these arrangements where it is possible to estimate them. These liabilities are not material in the aggregate. We are unable to develop a reasonable estimate of the maximum potential payout under some of these arrangements. Overall, we believe the likelihood that we will have to make any material payments under these arrangements is remote.
For additional information regarding our indemnification agreements see Note 15 to the Consolidated Financial Statements.
Debt
AIG expects to service and repay general borrowings through maturing investments and dispositions of invested assets, future cash flows from operations, cash flows generated from invested assets, future debt or preferred stock issuances and other financing arrangements. AIG borrowings supported by assets of AIG include GIAs that are supported by cash and investments held by AIG Parent, certain non-insurance subsidiaries and amounts posted to third parties as collateral for the repayment of those obligations. Total debt includes debt of consolidated investments not guaranteed by AIG.
For additional information on GIAs and associated collateral posted see Note 5 to the Consolidated Financial Statements.
146 AIG | 2021 Form 10-K
The following table provides the rollforward of AIG’s total debt outstanding:
|
| Balance at |
|
|
| Maturities |
| Effect of |
|
|
|
| Balance at |
Year Ended December 31, 2021 |
| December 31, |
|
|
| and |
| Foreign |
| Other |
| December 31, | |
(in millions) |
| 2020 | Issuances | Repayments |
| Exchange |
| Changes |
|
| 2021 | ||
Debt issued or guaranteed by AIG: |
|
|
|
|
|
|
|
|
|
|
|
|
|
AIG general borrowings: |
|
|
|
|
|
|
|
|
|
|
|
|
|
Notes and bonds payable | $ | 23,068 | $ | - | $ | (3,315) | $ | (157) | $ | 37 |
| $ | 19,633 |
Junior subordinated debt |
| 1,561 |
| - |
| (385) |
| (15) |
| 3 |
|
| 1,164 |
AIG Japan Holdings Kabushiki Kaisha |
| 361 |
| - |
| - |
| (28) |
| - |
|
| 333 |
AIGLH notes and bonds payable |
| 282 |
| - |
| (83) |
| - |
| - |
|
| 199 |
AIGLH junior subordinated debt |
| 361 |
| - |
| (134) |
| - |
| - |
|
| 227 |
Validus notes and bonds payable |
| 348 |
| - |
| (36) |
| - |
| (19) |
|
| 293 |
Total AIG general borrowings |
| 25,981 |
| - |
| (3,953) |
| (200) |
| 21 |
|
| 21,849 |
AIG borrowings supported by assets:(a) |
|
|
|
|
|
|
|
|
|
|
|
|
|
Series AIGFP matched notes and bonds payable |
| 21 |
| - |
| (3) |
| - |
| - |
|
| 18 |
GIAs, at fair value |
| 2,033 |
| 107 |
| (264) |
| - |
| (73) | (b) |
| 1,803 |
Notes and bonds payable, at fair value |
| 64 |
| - |
| (6) |
| - |
| 10 | (b) |
| 68 |
Total AIG borrowings supported by assets |
| 2,118 |
| 107 |
| (273) |
| - |
| (63) |
|
| 1,889 |
Total debt issued or guaranteed by AIG |
| 28,099 |
| 107 |
| (4,226) |
| (200) |
| (42) |
|
| 23,738 |
Other subsidiaries' notes, bonds, loans and |
|
|
|
|
|
|
|
|
|
|
|
|
|
mortgages payable - not guaranteed by AIG |
| 4 |
| - |
| (1) |
| - |
| - |
|
| 3 |
Total long-term debt |
| 28,103 |
| 107 |
| (4,227) |
| (200) |
| (42) |
|
| 23,741 |
Debt of consolidated investment entities - not |
|
|
|
|
|
|
|
|
|
|
|
|
|
guaranteed by AIG(c) |
| 9,431 |
| 4,338 |
| (4,495) |
| (21) |
| (2,831) | (d) |
| 6,422 |
Total debt | $ | 37,534 | $ | 4,445 | $ | (8,722) | $ | (221) | $ | (2,873) |
| $ | 30,163 |
(a) AIG Parent guarantees all such debt, except for Series AIGFP matched notes and bonds payable, which are direct obligations of AIG Parent. Collateral posted to third parties was $1.4 billion at both December 31, 2021 and December 31, 2020, respectively. This collateral primarily consists of securities of the U.S. government and government sponsored entities and generally cannot be repledged or resold by the counterparties.
(b) Primarily represents adjustments to the fair value of debt.
(c) At December 31, 2021, includes debt of consolidated investment entities primarily related to real estate investments of $1.9 billion and other securitization vehicles of $4.5 billion. At December 31, 2020, includes debt of consolidated investment entities related to real estate investments of $3.1 billion, affordable housing partnership investments of $2.3 billion and other securitization vehicles of $4.0 billion.
(d) Includes the effect of consolidating previously unconsolidated partnerships.
Debt Maturities
The following table summarizes maturing long-term debt at December 31, 2021 of AIG for the next four quarters:
|
| First |
| Second |
| Third |
| Fourth |
|
|
|
| Quarter |
| Quarter |
| Quarter |
| Quarter |
|
|
(in millions) |
| 2022 |
| 2022 |
| 2022 |
| 2022 |
| Total |
AIG general borrowings | $ | - | $ | - | $ | - | $ | 17 | $ | 17 |
AIG borrowings supported by assets |
| - |
| 19 |
| 19 |
| 12 |
| 50 |
Other subsidiaries' notes, bonds, loans and mortgages payable |
| - |
| - |
| - |
| 1 |
| 1 |
Total | $ | - | $ | 19 | $ | 19 | $ | 30 | $ | 68 |
For additional information on debt outstanding see Note 14 to the Consolidated Financial Statements.
AIG | 2021 Form 10-K 147
Credit Ratings
Credit ratings estimate a company’s ability to meet its obligations and may directly affect the cost and availability of financing to that company. The following table presents the credit ratings of AIG and certain of its subsidiaries as of the date of this filing. Figures in parentheses indicate the relative ranking of the ratings within the agency’s rating categories; that ranking refers only to the major rating category and not to the modifiers assigned by the rating agencies.
| Short-Term Debt |
| Senior Long-Term Debt | |||
| Moody’s | S&P |
| Moody’s(a) | S&P(b) | Fitch(c) |
American International Group, Inc. | P-2 (2nd of 3) | A-2 (2nd of 8) |
| Baa 2 (4th of 9) | BBB+ (4th of 9) | BBB+ (4th of 9) |
|
|
|
| / Stable outlook | CreditWatch | Rating Watch |
|
|
|
|
| Negative | Negative |
AIG Financial Products Corp.(d) | P-2 | A-2 |
| Baa 2 (4th of 9) | BBB+ |
|
|
|
|
| / Stable outlook | CreditWatch |
|
|
|
|
|
| Negative |
|
(a) Moody’s appends numerical modifiers 1, 2 and 3 to the generic rating categories to show relative position within the rating categories.
(b) S&P ratings may be modified by the addition of a plus or minus sign to show relative standing within the major rating categories.
(c) Fitch Ratings Inc. (Fitch) ratings may be modified by the addition of a plus or minus sign to show relative standing within the major rating categories.
(d) AIG guarantees all obligations of AIG Financial Products Corp.
These credit ratings are current opinions of the rating agencies. They may be changed, suspended or withdrawn at any time by the rating agencies as a result of changes in, or unavailability of, information or based on other circumstances. Ratings may also be withdrawn at our request. For a discussion of rating agency actions in response to AIG’s announced intention to separate its Life and Retirement business from AIG, see Rating Agency Actions Related to the Announced Separation of Life and Retirement below.
We are party to some agreements that contain “ratings triggers.” Depending on the ratings maintained by one or more rating agencies, these triggers could result in (i) the termination or limitation of credit availability or a requirement for accelerated repayment, (ii) the termination of business contracts or (iii) a requirement to post collateral for the benefit of counterparties.
In the event of a downgrade of AIG’s long-term senior debt ratings, AIG Financial Products Corp. and related subsidiaries (collectively AIGFP) and certain other AIG entities would be required to post additional collateral under some derivative and other transactions, or certain of the counterparties of AIGFP or of such other AIG entities would be permitted to terminate such transactions early.
The actual amount of collateral that we would be required to post to counterparties in the event of such downgrades, or the aggregate amount of payments that we could be required to make, depends on market conditions, the fair value of outstanding affected transactions and other factors prevailing at the time of the downgrade.
For information regarding the effects of downgrades in our credit ratings see Note 10 to the Consolidated Financial Statements and Part I, Item 1A. Risk Factors – Liquidity, Capital and Credit – “A downgrade by one or more of the rating agencies in the Insurer Financial Strength ratings of our insurance or reinsurance companies could limit their ability to write or prevent them from writing new business and impair their retention of customers and in-force business, and a downgrade in our credit ratings could adversely affect our business, results of operations, financial condition and liquidity”.
148 AIG | 2021 Form 10-K
FINANCIAL STRENGTH Ratings
Financial Strength ratings estimate an insurance company’s ability to pay its obligations under an insurance policy. The following table presents the ratings of our significant insurance subsidiaries as of the date of this filing.
| A.M. Best | S&P | Fitch | Moody’s |
National Union Fire Insurance Company of Pittsburgh, Pa. | A | A+ | A | A2 |
Lexington Insurance Company | A | A+ | A | A2 |
American Home Assurance Company | A | A+ | A | A2 |
American General Life Insurance Company | A | A+ | A+ | A2 |
The Variable Annuity Life Insurance Company | A | A+ | A+ | A2 |
United States Life Insurance Company in the City of New York | A | A+ | A+ | A2 |
AIG Europe S.A. | NR | A+ | NR | A2 |
American International Group UK Ltd. | A | A+ | NR | A2 |
AIG General Insurance Co. Ltd. | NR | A+ | NR | NR |
Validus Reinsurance, Ltd. | A | A+ | NR | A2 |
These financial strength ratings are current opinions of the rating agencies. They may be changed, suspended or withdrawn at any time by the rating agencies as a result of changes in, or unavailability of, information or based on other circumstances.
For a discussion of the effects of downgrades in our financial strength ratings see Note 10 to the Consolidated Financial Statements and Part I, Item 1A. Risk Factors – Liquidity, Capital and Credit – “A downgrade by one or more of the rating agencies in the Insurer Financial Strength ratings of our insurance or reinsurance companies could limit their ability to write or prevent them from writing new business and impair their retention of customers and in-force business, and a downgrade in our credit ratings could adversely affect our business, results of operations, financial condition and liquidity”.
Rating Agency Actions RELATED TO the ANNOUNCED SEPARATION OF LIFE AND RETIREMENT
On October 26, 2020, AIG announced its intention to separate its Life and Retirement business from AIG. On November 2, 2021, AIG and Blackstone completed the acquisition by Blackstone of a 9.9 percent equity stake in SAFG. In response to such announcements, the rating agencies in the tables above took the following actions:
On October 27, 2020, A.M. Best issued a comment stating that its financial strength and issuer credit ratings on AIG and subsidiaries are unchanged as a result of the announcement. On October 7, 2021, A.M. Best affirmed all of the financial strength and issuer credit ratings of AIG and subsidiaries with stable outlooks.
On October 28, 2020, Fitch placed the credit ratings of AIG on “Rating Watch Negative.” Fitch also affirmed the financial strength ratings and outlooks on AIG’s insurance subsidiaries.
On October 28, 2020, Moody’s placed the debt ratings of AIG on review for downgrade. Moody’s also affirmed the financial strength ratings and outlooks on AIG’s insurance subsidiaries. On July 15, 2021, Moody’s lowered its debt ratings of AIG to Baa2 from Baa1 and assigned a stable outlook. Moody’s also revised the outlook on the A2 financial strength ratings of the Life and Retirement subsidiaries to negative from stable. The ratings of the General Insurance subsidiaries were unaffected by these announcements.
On October 27, 2020, S&P placed the credit ratings of AIG and the financial strength ratings of most of the General Insurance subsidiaries on CreditWatch with negative implications. S&P also placed the financial strength ratings of the Life and Retirement subsidiaries on CreditWatch with developing implications.
Regulation and Supervision
For information regarding our regulation and supervision by different regulatory authorities in the United States and abroad, including with respect to our liquidity and capital resources see Part 1, Item 1. Business – Regulation and Item 1A. Risk Factors – Regulation.
AIG | 2021 Form 10-K 149
Dividends
The following table presents declaration date, record date, payment date and dividends paid per common share on AIG Common Stock in the twelve months ended December 31, 2021:
|
|
|
|
| Dividends Paid |
Declaration Date | Record Date | Payment Date |
|
| Per Common Share |
November 4, 2021 | December 16, 2021 | December 30, 2021 |
| $ | 0.32 |
August 5, 2021 | September 16, 2021 | September 30, 2021 |
|
| 0.32 |
May 6, 2021 | June 15, 2021 | June 29, 2021 |
|
| 0.32 |
February 16, 2021 | March 16, 2021 | March 30, 2021 |
|
| 0.32 |
On February 16, 2022, our Board of Directors declared a cash dividend on AIG Common Stock of $0.32 per share, payable on March 31, 2022 to shareholders of record on March 17, 2022.
The following table presents declaration date, record date, payment date and dividends paid per preferred share and per depository share on the Series A Preferred Stock in the twelve months ended December 31, 2021:
|
|
| Dividends Paid | |||
Declaration Date | Record Date | Payment Date |
| Per Preferred Share |
| Per Depositary Share |
November 4, 2021 | November 30, 2021 | December 15, 2021 | $ | 365.625 | $ | 0.365625 |
August 5, 2021 | August 31, 2021 | September 15, 2021 |
| 365.625 |
| 0.365625 |
May 6, 2021 | May 31, 2021 | June 15, 2021 |
| 365.625 |
| 0.365625 |
February 16, 2021 | February 26, 2021 | March 15, 2021 |
| 365.625 |
| 0.365625 |
On February 16, 2022, our Board of Directors declared a cash dividend on AIG’s Series A Preferred Stock of $365.625 per share, payable on March 15, 2022 to holders of record on February 28, 2022.
The payment of any future dividends will be at the discretion of our Board of Directors and will depend on various factors, as discussed further in Note 16 to the Consolidated Financial Statements.
Repurchases of AIG Common Stock
Our Board of Directors has authorized the repurchase of shares of AIG Common Stock through a series of actions. On August 3, 2021, our Board of Directors authorized a share repurchase authorization of AIG Common Stock of $6.0 billion (inclusive of the approximately $908 million remaining under the Board’s prior share repurchase authorization).
During 2021, AIG Parent repurchased approximately 50 million shares of AIG Common Stock for an aggregate purchase price of $2.6 billion, including approximately $6 million of shares purchased from certain Life and Retirement companies. Pursuant to an Exchange Act Rule 10b5-1 repurchase plan, from January 1, 2022 to February 15, 2022, we repurchased approximately $522 million of additional shares of AIG Common Stock. As of February 15, 2022, approximately $3.4 billion remained under the share repurchase authorization.
Shares may be repurchased from time to time in the open market, private purchases, through forward, derivative, accelerated repurchase or automatic repurchase transactions or otherwise. Certain of our share repurchases have been and may from time to time be effected through the Exchange Act Rule 10b5-1 repurchase plans. The timing of any future share repurchases will depend on market conditions, our business and strategic plans, financial condition, results of operations, liquidity and other factors, as discussed further in Note 16 to the Consolidated Financial Statements.
Dividend Restrictions
Payments of dividends to AIG by its insurance subsidiaries are subject to certain restrictions imposed by regulatory authorities.
For information regarding restrictions on payments of dividends by our subsidiaries see Note 18 to the Consolidated Financial Statements.
150 AIG | 2021 Form 10-K
Enterprise Risk Management
Risk management includes the identification and measurement of various forms of risk, the establishment of risk thresholds and the creation of processes intended to maintain risks within these thresholds while optimizing returns. We consider risk management an integral part of managing our core businesses and a key element of our approach to corporate governance.
Overview
We have an integrated process for managing risks throughout our organization in accordance with our firm-wide risk appetite. Our Board of Directors has oversight responsibility for the management of risk. Our Enterprise Risk Management Department supervises and integrates the risk management functions in each of our business units, providing senior management with a consolidated view of AIG’s major risk positions. Within each business unit, senior leaders and executives approve targeted risk tolerances within the framework provided by ERM. ERM supports our businesses and management by embedding risk management in our key day-to-day business processes and in identifying, assessing, quantifying, monitoring, reporting, and mitigating the risks taken by our businesses and AIG overall. Nevertheless, our risk management efforts may not always be successful and material adverse effects on our business, results of operations, cash flows, liquidity or financial condition may occur.
AIG employs a Three Lines of Defense model. AIG’s business leaders assume full accountability for the risks and controls in their operating units, and ERM performs a review, challenge and oversight function. The third line consists of our Internal Audit Group that provides independent assurance for AIG’s Board of Directors.
Risk Governance Structure
Our risk governance structure fosters the development and maintenance of a risk and control culture that encompasses all significant risk categories impacting our lines of business and functions. Accountability for the implementation and oversight of risk policies is aligned with individual corporate executives, with the risk committees receiving regular reports regarding compliance with each policy to support risk governance at our corporate level as well as in each business unit. We review our governance and committee structure on a regular basis and make changes as appropriate to continue to effectively manage and govern both our risks and risk-taking activities.
Our Board of Directors oversees the management of risk through its Risk and Capital Committee (RCC) and Audit Committee. These committees regularly interact with other committees of the Board of Directors which are further described below. Our Chief Risk Officer (CRO) reports to both the RCC and our Chairman and Chief Executive Officer.
The Group Risk Committee (GRC): The GRC is the senior management group responsible for assessing all significant risk issues on a global basis to protect our financial strength and reputation. The GRC is chaired by our CRO. Our CRO reports periodically on behalf of the GRC to both the RCC and the Audit Committee of the Board of Directors. Our CRO is also a member of the Executive Leadership Team providing ERM the opportunity to contribute to, review, monitor and consider the impact of changes in strategy.
Management committees that support the GRC are described below. These committees are comprised of senior executives and experienced business representatives from a range of functions and business units throughout AIG and its subsidiaries. These committees are charged with identifying, analyzing and reviewing specific risk matters within their respective mandates. In addition, various working groups are in place in support of the GRC to manage and monitor the various risks across the organization.
Financial Risk Group (FRG): The FRG is responsible for the oversight of financial risks taken by AIG and our subsidiaries. Its mandate includes overseeing our aggregate credit, market, interest rate, capital, liquidity and model risks, as well as asset-liability management, derivatives activity, and foreign exchange transactions. It provides the primary corporate-level review function for all proposed transactions and business practices that are significant in size, complex in scope, or that present heightened legal, reputational, accounting or regulatory risks. The FRG is chaired by our CRO. Membership of the FRG also includes our CFO, Chief Investment Officer and Treasurer.
Business Unit Risk Committees: Each of our major insurance businesses have established a risk committee that serves as the senior management committee responsible for risk oversight at the individual business unit level. The risk committees are responsible for the identification, assessment and monitoring of all sources of risk within their respective portfolios. Specific responsibilities include setting risk tolerances or limits, reviewing the capital allocation framework, considering insurance portfolio optimization, decisions with material impact on the risk profile and providing oversight of risk-adjusted metrics. In performing these responsibilities, the business unit risk committees may leverage input provided by other business unit committees and working groups.
AIG | 2021 Form 10-K 151
In addition to the above, where needed and appropriate, there are risk committees at the legal entity level that support the Business Unit Risk Committees in executing their duties. These duties include ensuring policies are adhered to and transactions are within the AIG risk appetite and have appropriate operational controls or plans for establishing such controls within a reasonable amount of time, as well as ensuring appropriate risk governance at the legal entity level.
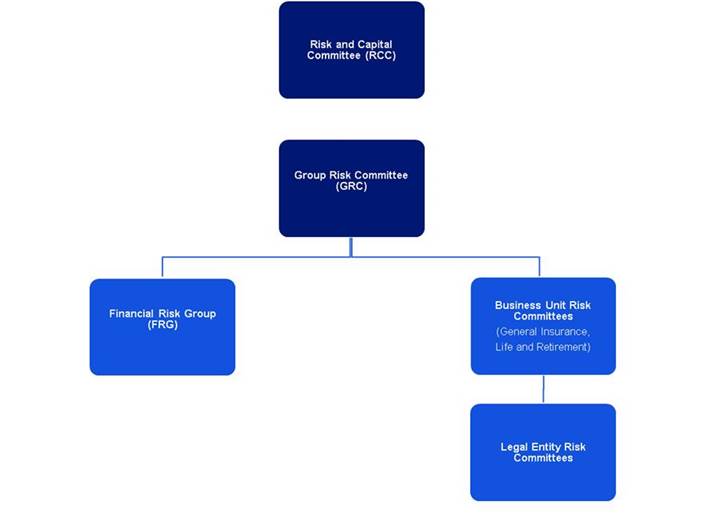
Risk Appetite, Limits, Identification and Measurement
Risk Appetite Framework
Our Risk Appetite Framework integrates stakeholder interests, strategic business goals and available financial resources. We balance these by seeking to take measured risks that are expected to generate repeatable, sustainable earnings and create long-term value for our shareholders. The framework includes our risk appetite statement approved by the Board of Directors and a set of supporting tools, including risk tolerances, risk limits and policies, which we use to manage our risk profile and financial resources.
We articulate our aggregate risk-taking by setting risk tolerances and thresholds on capital and liquidity measures. These measures are set at the AIG Parent level as well as the legal entity level and cover consolidated and insurance company capital and liquidity ratios. We must comply with standards for capital adequacy and maintain sufficient liquidity to meet all our obligations as they come due in accordance with our capital management and liquidity management policies. Our risk tolerances take into consideration regulatory requirements, rating agency expectations, and business needs. The GRC routinely reviews the level of risk taken by the consolidated organization in relation to the established risk tolerances. A consolidated risk report is also presented periodically to the RCC by our CRO.
152 AIG | 2021 Form 10-K
Risk Limits
A key component of our Risk Appetite Framework is having a process in place that establishes and maintains appropriate tolerances and limits on the material risks identified for our core businesses and facilitates the monitoring and meeting of both internal and external stakeholder expectations. Framework objectives include:
Establishing risk monitoring, providing early warning indicators, and ensuring timely oversight and enforceability of limits;
Defining a consistent and transparent approach to limits governance; and
Aligning our business activities with our risk appetite statement.
To support the monitoring and management of AIG’s and its business units’ material risks, ERM has an established limits framework that employs a three-tiered hierarchy:
Board-level risk tolerances are AIG’s aggregate consolidated capital and liquidity limits. They define the minimum level of consolidated capital and liquidity that we should maintain. These board-level risk tolerances are approved by the Board of Directors and monitored by the RCC.
AIG management level limits are risk type specific limits at the AIG consolidated level. These limits are approved by our CRO with consultation from the GRC.
Business unit and legal entity level limits are set to address key risks identified for the business unit and legal entities, protect capital and liquidity at legal entities and/or meet legal entity specific requirements of regulators and rating agencies. These limits are defined by the business unit and legal entity risk officers.
All limits are reviewed by the GRC or relevant business unit risk committees on a periodic basis and revisions, if applicable, are approved by those committees.
The business units are responsible for measuring and monitoring their risk exposures. ERM is responsible for monitoring compliance with limits and providing regular, timely reporting to our senior management and risk committees. Limit breaches are required to be reported in a timely manner and are documented and escalated in accordance with their level of severity or materiality.
Risk Identification and Measurement
We conduct risk identification through a number of processes at the business unit and corporate level focused on capturing our material risks. A key initiative is our integrated bottom-up risk identification and assessment process which is conducted down to the product-line level. In addition, we perform an annual top-down risk assessment to identify top risks and assign owners to ensure these risks are appropriately addressed and managed. These processes are used as a critical input to enhance and develop our analytics for measuring and assessing risks across the organization.
We employ various approaches to measure, monitor and manage risk exposures, including the utilization of a variety of metrics and early warning indicators. We use a proprietary internal capital and stress testing framework to measure our quantifiable risks.
The internal capital framework quantifies our aggregate economic risk at a given confidence interval, after taking into account diversification benefits between risk factors and business lines. We leverage the internal capital framework to help inform our consolidated risk consumption and profile as well as risk and capital allocation for our businesses.
The stress testing framework assesses our aggregate exposure to our most significant financial and insurance risks, including the risks in each of our key insurance company subsidiaries in relation to its capital needs under stress, risks inherent in our non-insurance company subsidiaries, and risks to AIG consolidated capital. The framework measures risk over multiple time horizons and under different levels of stress, and includes multi-factor stresses as well as single factor sensitivities that are designed to reflect AIG’s risk characteristics. We use this information to support the assessment of resources needed at the AIG Parent level to support our subsidiaries and capital resources required to maintain consolidated company target capitalization levels.
We evaluate and manage risk in material topics as shown below. These topics are discussed in further detail in the following pages: | ||
Credit Risk Management | Liquidity Risk Management | Insurance Risks |
Market Risk Management | Operational Risk Management | Other Business Risks |
AIG | 2021 Form 10-K 153
Credit Risk Management
Overview
Credit risk is defined as the risk that our customers or counterparties are unable or unwilling to repay their contractual obligations when they become due. Credit risk may also result from a downgrade of a counterparty’s credit ratings or a widening of its credit spreads.
We devote considerable resources to managing our direct and indirect credit exposures. These exposures may arise from, but are not limited to, fixed income investments, equity securities, deposits, commercial paper investments, reverse repurchase agreements and repurchase agreements, corporate and consumer loans, leases, reinsurance and retrocessional insurance recoverables, counterparty risk arising from derivatives activities, collateral extended to counterparties, insurance risk cessions to third parties, financial guarantees, letters of credit, and certain General Insurance businesses.
Governance
Our credit risks are managed by teams of credit professionals, subject to ERM oversight and various control processes. Their primary role is to ensure appropriate credit risk management in accordance with our credit policies and procedures relative to our credit risk parameters. ERM is primarily responsible for the development, implementation and maintenance of a risk management framework, which includes the following elements related to our credit risks:
developing and implementing our company-wide credit policies and procedures;
approving delegated credit authorities to our credit executives and qualified credit professionals;
developing methodologies for quantification and assessment of credit risks, including the establishment and maintenance of our internal risk rating process;
managing a system of credit and program limits, as well as the approval process for credit transactions, above limit exposures, and concentrations of risk that may exist or be incurred;
evaluating, monitoring, reviewing and reporting of credit risks and concentrations regularly with senior management; and
approving appropriate credit reserves, credit-related other-than-temporary impairments and corresponding methodologies for all credit portfolios.
We monitor and control our company-wide credit risk concentrations and attempt to avoid unwanted or excessive risk accumulations, whether funded or unfunded. To minimize the level of credit risk in some circumstances, we may require mitigants, such as third-party guarantees, reinsurance or collateral, including commercial bank-issued letters of credit and trust collateral accounts. We treat these guarantees, reinsurance recoverables, and letters of credit as credit exposure and include them in our risk concentration exposure data. We also closely monitor the quality of any trust collateral accounts.
For additional information on our credit concentrations and credit exposures see Investments – Credit Ratings – Available-for-Sale Investments.
Our credit risk management framework incorporates the following elements:
Risk Identification | including the ongoing capture and monitoring of all existing, contingent, potential and emerging credit risk exposures, whether funded or unfunded |
Risk Measurement | comprising risk ratings, default probabilities, loss given default and expected loss parameters, exposure calculations, stress testing and other risk analytics |
Risk Limits | including, but not limited to, a system of single obligor or risk group-based AIG-wide house limits and sub-limits for corporates, financial institutions, sovereigns and sub-sovereigns when appropriate and a defined process for identifying, evaluating, documenting and approving, if appropriate, breaches of and exceptions to such limits |
Risk Delegations | a comprehensive credit risk delegation framework to authorized credit professionals throughout the company |
Risk Evaluation, Monitoring and Reporting | including the ongoing analysis and assessment of credit risks, trending of those risks and reporting of other key risk metrics and limits, as may be required |
Credit Reserving | including but not limited to development of a proper framework, policies and procedures for establishing accurate identification of (i) reserves for credit losses and (ii) other-than-temporary impairments for securities portfolios |
154 AIG | 2021 Form 10-K
Market Risk Management
Overview
Market risk is defined as the risk of adverse impact due to systemic movements in one or more of the following market risk drivers: equity and commodity prices, residential and commercial real estate values, interest rates, credit spreads, foreign exchange, inflation, and their respective levels of volatility.
We are engaged in a variety of insurance, investment and other financial services businesses that expose us to market risk, directly and indirectly. We are exposed to market risks primarily within our insurance and capital markets activities, on both the asset and the liability sides of our balance sheet through on- and off-balance sheet exposures. Within each business, the risk officer is responsible for creating a framework for proper identification of market risks, and ensuring that the risks are appropriately measured, monitored and managed, and are in accordance with the risk governance framework established by the CRO.
The scope and magnitude of our market risk exposures is managed under a robust framework that contains defined risk limits and minimum standards for managing market risk in a manner consistent with our risk appetite statement. Our market risk management framework focuses on quantifying the financial repercussions of changes in the above mentioned market risk drivers.
Many of our market risk exposures, including exposures to changes in levels of interest rates and equity prices, are associated with the asset and liability exposures of our Life and Retirement companies. These exposures are generally long-term in nature. Examples of liability-related exposures include interest rate sensitive surrenders in our fixed deferred annuity product portfolio. Also, we have equity market risk sensitive surrenders in our variable annuity product portfolio. These interactive asset-liability types of risk exposures are regularly monitored in accordance with the risk governance framework noted above.
Governance
Market risk is overseen at the corporate level within ERM through the CRO. The CRO is supported by a dedicated team of professionals within ERM. Market risk is managed by our finance, treasury and investment management corporate functions, collectively, and in partnership with ERM. The CRO is responsible for the development and maintenance of a risk management framework that includes the following key components:
written policies that define the rules for our market risk-taking activities and provide clear guidance regarding their execution and management;
a limit framework that aligns with our Board-approved risk appetite statement;
independent measurement, monitoring and reporting for line of business, business unit and enterprise-wide market risks; and
clearly defined authorities for all individuals and committee roles and responsibilities related to market risk management.
These components facilitate the CRO’s identification, measurement, monitoring, reporting and management of our market risks.
Risk Identification
Market risk focuses on quantifying the financial repercussions of changes in broad, external, predominantly market-observable variables. Financial repercussions can include an adverse impact on results of operations, financial condition, liquidity and capital of AIG.
AIG | 2021 Form 10-K 155
Each of the following systemic risks is considered a market risk:
Equity prices | We are exposed to changes in equity market prices affecting a variety of instruments. Changes in equity prices can affect the valuation of publicly traded equity shares, investments in private equity, hedge funds, mutual funds, exchange-traded funds, alternative risk premia investment strategies, and other equity-linked capital market instruments as well as equity-linked insurance products, including but not limited to index annuities, variable annuities, indexed universal life insurance and variable universal life insurance. |
Residential and commercial real estate values | Our investment portfolios are exposed to the risk of changing values in a variety of residential and commercial real estate investments. Changes in residential/commercial real estate prices can affect the valuation of residential/commercial mortgages, residential/commercial mortgage-backed securities and other structured securities with underlying assets that include residential/commercial mortgages, trusts that include residential/commercial real estate and/or mortgages, residential mortgage insurance and reinsurance contracts and commercial real estate investments. |
Interest rates | Interest rate risk can arise from a mismatch in the interest rate exposure of assets versus liabilities. Lower interest rates generally result in lower investment income and make some of our product offerings less attractive to investors. Conversely, higher interest rates are typically beneficial for the opposite reasons. However, when rates rise quickly, there can be an asymmetric GAAP accounting effect where the existing securities lose market value, which is largely reported through Other comprehensive income, and the offsetting decrease in the value of certain liabilities may not be recognized. Changes in interest rates can affect the valuation of fixed maturity securities, financial liabilities, insurance contracts including but not limited to universal life, fixed rate annuities, variable annuities and derivative contracts. Additionally, for variable annuity, index annuity, and equity indexed universal life products, deviations in actual versus expected policyholder behavior can be driven by fluctuations in various market variables, including interest rates. Policies with guaranteed living benefit options or riders are also subject to the risk of actual benefit utilization being different than expected. |
Credit spreads | Credit spreads measure an instrument’s risk premium or yield relative to that of a comparable duration, default-free instrument. Changes in credit spreads can affect the valuation of fixed maturity securities, including but not limited to corporate bonds, asset backed securities, mortgage-backed securities, AIG-issued debt obligations, credit derivatives, derivative credit valuation adjustments and economic valuation of insurance liabilities. Much like higher interest rates, wider credit spreads paired with unchanged expectations about default losses imply higher investment income in the long term. In the short term, quickly rising spreads will cause a loss in the value of existing fixed maturity securities, which is largely reported through Other comprehensive income. A precipitous widening of credit spreads may also signal a fundamental weakness in the credit worthiness of bond obligors, potentially resulting in default losses. |
Foreign exchange (FX) rates | We are a globally diversified enterprise with income, assets and liabilities denominated in, and capital deployed in, a variety of currencies. Changes in FX rates can affect the valuation of a broad range of balance sheet and income statement items as well as the settlement of cash flows exchanged in specific transactions. |
Commodity prices | Changes in commodity prices (the value of commodities) can affect the valuation of publicly-traded commodities, commodity indices, derivatives on commodities and commodity indices, and other commodity-linked investments and insurance contracts. We are exposed to commodity prices primarily through their impact on the prices and credit quality of commodity producers’ debt and equity securities in our investment portfolio. |
Inflation | Changes in inflation can affect the valuation of fixed maturity securities, including AIG-issued debt obligations, derivatives and other contracts explicitly linked to inflation indices, and insurance contracts where the claims are linked to inflation either explicitly, via indexing, or implicitly, through medical costs or wage levels. |
156 AIG | 2021 Form 10-K
Risk Measurement
Our market risk measurement framework was developed with the main objective of communicating the range and scale of our market risk exposures. At the firm-wide level, market risk is measured in a manner that is consistent with AIG’s risk appetite statement. This is designed to ensure that we remain within our stated risk tolerance levels and can determine how much additional market risk taking capacity is available within our framework. The framework measures our overall exposure to change in each of the systemic market risk factors on an economic basis.
In addition, we monitor risks through multiple lenses that include economic, GAAP and statutory reporting frameworks at various levels of business consolidation. This process aims to establish a comprehensive coverage of potential implications from adverse market risk developments.
We use a number of approaches to measure our market risk exposure, including:
|
| Examples include: |
Sensitivity analysis | measures the impact from a unit change in a market risk input | • a one basis point increase in yield on fixed maturity securities, • a one basis point increase in credit spreads of fixed maturity securities, and • a one percent increase in prices of equity securities. |
Scenario analysis | uses historical, hypothetical, or forward-looking macroeconomic scenarios to assess and report exposures | • a 100 basis point parallel shift in the yield curve, or • a 20 percent immediate and simultaneous decrease in world-wide equity markets. Scenarios may also utilize a stochastic framework to arrive at a probability distribution of losses. |
Stress testing | a special form of scenario analysis in which the scenarios are designed to lead to a material adverse outcome is tailored to single-factor exposure and comprehensive stress scenarios that cover multiple risk factors. Stress testing analysis includes evaluation of exposures to instantaneous market shocks as well as to adverse market developments over forward time horizons | • the stock market crash of October 1987 or the widening of yields or spreads of RMBS or CMBS during 2008. |
AIG | 2021 Form 10-K 157
Market Risk Sensitivities
The following table provides estimates of sensitivity to changes in yield curves, equity prices and foreign currency exchange rates on our financial instruments and excludes approximately $178.1 billion and $174.2 billion as of December 31, 2021 and December 31, 2020 respectively, of insurance liabilities. AIG believes that the interest rate sensitivities of these insurance and other liabilities serve as an offset to the net interest rate risk of the financial assets presented in the table below. In addition, the table excludes $37.4 billion of interest rate sensitive assets and $1.8 billion of equity and alternative investments supporting the Fortitude Re funds withheld arrangements as the contractual returns related to the assets are transferred to Fortitude Re, as well as $40.6 billion of related funds withheld payables.
| Balance Sheet Exposure |
|
| Economic Effect |
| ||||||||
| December 31, |
| December 31, |
|
| December 31, |
| December 31, |
| ||||
(dollars in millions) |
| 2021 |
|
| 2020 |
|
|
| 2021 |
|
| 2020 |
|
Sensitivity factor |
|
|
|
|
|
| 100 bps parallel increase in all yield curves | ||||||
Interest rate sensitive assets: |
|
|
|
|
|
|
|
|
|
|
|
|
|
Fixed maturity securities | $ | 248,632 |
| $ | 239,694 |
|
| $ | (17,017) |
| $ | (15,325) |
|
Mortgage and other loans receivable(a) |
| 40,085 |
|
| 38,490 |
|
|
| (1,928) |
|
| (1,973) |
|
Derivatives: |
|
|
|
|
|
|
|
|
|
|
|
|
|
Interest rate contracts |
| 240 |
|
| 201 |
|
|
| (1,702) |
|
| (1,895) |
|
Equity contracts |
| 628 |
|
| 907 |
|
|
| (228) |
|
| (392) |
|
Other contracts |
| 439 |
|
| (125) |
|
|
| (2) |
|
| 32 |
|
Total interest rate sensitive assets | $ | 290,024 | (b) | $ | 279,167 | (b) |
| $ | (20,877) |
| $ | (19,553) |
|
Interest rate sensitive liabilities: |
|
|
|
|
|
|
|
|
|
|
|
|
|
Policyholder contract deposits: |
|
|
|
|
|
|
|
|
|
|
|
|
|
Investment-type contracts(a) | $ | (130,643) |
| $ | (128,204) |
|
| $ | 10,375 |
| $ | 10,857 |
|
Variable annuity and other embedded |
|
|
|
|
|
|
|
|
|
|
|
|
|
derivatives |
| (9,736) |
|
| (9,797) |
|
|
| 2,550 |
|
| 2,675 |
|
Long-term debt(a) (c) |
| (22,686) |
|
| (26,747) |
|
|
| 2,183 |
|
| 2,568 |
|
Total interest rate sensitive liabilities | $ | (163,065) |
| $ | (164,748) |
|
| $ | 15,108 |
| $ | 16,100 |
|
Sensitivity factor |
|
|
|
|
|
|
| 20% decline in stock prices and | |||||
|
|
|
|
|
|
|
| alternative investments | |||||
Derivatives: |
|
|
|
|
|
|
|
|
|
|
|
|
|
Equity contracts(d) | $ | 628 |
| $ | 908 |
|
| $ | 542 |
| $ | 440 |
|
Equity and alternative investments: |
|
|
|
|
|
|
|
|
|
|
|
|
|
Real estate investments |
| 2,526 |
|
| 7,572 |
|
|
| (505) |
|
| (1,514) |
|
Private equity |
| 7,533 |
|
| 6,294 |
|
|
| (1,507) |
|
| (1,259) |
|
Hedge funds |
| 1,812 |
|
| 2,110 |
|
|
| (362) |
|
| (422) |
|
Common equity |
| 728 |
|
| 1,042 |
|
|
| (146) |
|
| (208) |
|
Other investments |
| 1,328 |
|
| 912 |
|
|
| (266) |
|
| (182) |
|
Total derivatives, equity and alternative |
|
|
|
|
|
|
|
|
|
|
|
|
|
investments | $ | 14,555 |
| $ | 18,838 |
|
| $ | (2,244) |
| $ | (3,145) |
|
|
|
|
|
|
|
|
|
|
|
|
|
|
|
Policyholder contract deposits: |
|
|
|
|
|
|
|
|
|
|
|
|
|
Variable annuity and other |
|
|
|
|
|
|
|
|
|
|
|
|
|
embedded derivatives(d) | $ | (9,736) |
| $ | (9,797) |
|
| $ | (269) |
| $ | (59) |
|
Total liability | $ | (9,736) |
| $ | (9,797) |
|
| $ | (269) |
| $ | (59) |
|
Sensitivity factor |
|
|
|
|
|
|
| 10% depreciation of all foreign currency | |||||
|
|
|
|
|
|
|
| exchange rates against the U.S. dollar | |||||
Foreign currency-denominated net |
|
|
|
|
|
|
|
|
|
|
|
|
|
asset position: |
|
|
|
|
|
|
|
|
|
|
|
|
|
Great Britain pound | $ | 1,046 |
| $ | 1,281 |
|
| $ | (105) |
| $ | (128) |
|
Canada dollar |
| 758 |
|
| 762 |
|
|
| (76) |
|
| (76) |
|
South Korea won |
| 367 |
|
| 349 |
|
|
| (37) |
|
| (35) |
|
All other foreign currencies |
| 1,486 |
|
| 1,669 |
|
|
| (149) |
|
| (167) |
|
Total foreign currency-denominated net |
|
|
|
|
|
|
|
|
|
|
|
|
|
asset position(e) | $ | 3,657 |
| $ | 4,061 |
|
| $ | (367) |
| $ | (406) |
|
158 AIG | 2021 Form 10-K
(a) The economic effect is the difference between the estimated fair value and the effect of a 100 bps parallel increase in all yield curves on the estimated fair value. The estimated fair values for Mortgage and other loans receivable, Policyholder contract deposits (Investment-type contracts) and Long-term debt were $45.7 billion, $143.1 billion and $25.7 billion at December 31, 2021, respectively. The estimated fair values for Mortgage and other loans receivable, Policyholder contract deposits (Investment-type contracts) and Long-term debt were $45.1 billion, $144.6 billion and $31.2 billion at December 31, 2020, respectively.
(b) At December 31, 2021, the analysis covered $290.0 billion of $331.5 billion interest-rate sensitive assets. As indicated above, excluded were $33.7 billion and $3.6 billion of fixed maturity securities and loans, respectively, supporting the Fortitude Re funds withheld arrangements. In addition, $2.3 billion of loans and $2.0 billion of assets across various asset categories were excluded due to modeling limitations. At December 31, 2020, the analysis covered $279.2 billion of $324.0 billion interest-rate sensitive assets. As indicated above, excluded were $36.2 billion and $3.6 billion of fixed maturity securities and loans, respectively, supporting the Fortitude Re funds withheld arrangements. In addition, $3.4 billion of loans and $1.6 billion of assets across various asset categories were excluded due to modeling limitations.
(c) At December 31, 2021, the analysis excluded $0.4 billion of AIG Life Holdings, Inc. (AIGLH) borrowings, $0.3 billion of Validus borrowings, $2 million of borrowings from Glatfelter Insurance Group (Glatfelter) and $0.3 billion of AIG Japan Holdings loans. At December 31, 2020, the analysis excluded $0.6 billion of AIGLH borrowings, $0.3 billion of Validus borrowings, $4 million of borrowings from Glatfelter and $0.4 billion of AIG Japan Holdings loans.
(d) The balance sheet exposures for equity contracts and variable annuity and other embedded derivatives are also reflected under “Interest rate sensitive liabilities” above, and are not additive.
(e) The majority of the foreign currency exposure is reported on a one quarter lag.
The sensitivity analysis is an estimate and should not be viewed as predictive of our future financial performance. We cannot ensure that actual financial impacts in any particular period will not exceed the amounts indicated above.
Interest rate sensitivity is defined as change in value with respect to a 100 basis point parallel shift up in the interest rate environment, calculated as: scenario value minus base value, where base value is the value under the yield curves as of the period end and scenario value is the value reflecting a 100 basis point parallel increase in all yield curves.
We evaluate our interest rate risk without considering effects of correlation of changes in levels of interest rate with other key market risks or other assumptions used for calculating the values of our financial assets and liabilities. This scenario does not measure changes in values resulting from non-parallel shifts in the yield curves, which could produce different results.
We evaluate our equity price risk without considering effects of correlation of changes in equity prices with other key market risks or other assumptions used for calculating the values of our financial assets and liabilities. The stress scenario does not reflect the impact of basis risk, such as projections about the future performance of the underlying contract holder funds and actual fund returns, which we use as a basis for developing our hedging strategy.
Foreign currency-denominated net asset position reflects our aggregated non-U.S. dollar assets less our aggregated non-U.S. dollar liabilities on a GAAP basis, with certain adjustments. We use a bottom-up approach in managing our foreign currency exchange rate exposures with the objective of protecting statutory surplus at the regulated insurance entity level. At the AIG consolidated level, we monitor our foreign currency exposures against single currency and aggregate currency portfolio limits.
For illustrative purposes, we modeled our sensitivities based on a 100 basis point parallel increase in yield curves, a 20 percent decline in equity prices and prices of alternative assets, and a 10 percent depreciation of all foreign currency exchange rates against the U.S. dollar.
Risk Monitoring and Limits
The risk monitoring responsibilities, owned by the business units, include ensuring compliance with market risk limits and escalation and remediation of limit breaches. Such activities must be reported to the ERM Market Risk team by the relevant business unit. This monitoring approach is aligned with our overall risk limits framework.
To control our exposure to market risk, we rely on a three-tiered hierarchy of limits that are closely monitored by ERM and reported to our CRO, senior management and risk committees.
For additional information on our three-tiered hierarchy of limits see Risk Appetite, Limits, Identification and Measurement – Risk Limits.
AIG | 2021 Form 10-K 159
Liquidity Risk Management
Overview
Liquidity risk is defined as the risk that our financial condition will be adversely affected by the inability or perceived inability to meet our short-term cash, collateral or other financial obligations as they come due. Failure to appropriately manage liquidity risk can result in insolvency, reduced operating flexibility, increased costs, reputational harm and regulatory action.
AIG and its legal entities seek to maintain sufficient liquidity both during the normal course of business and under defined liquidity stress scenarios to ensure that sufficient cash will be available to meet the obligations as they come due.
AIG Parent liquidity risk tolerance levels are designed to allow us to meet our financial obligations for a minimum of six months under a liquidity stress scenario. We maintain liquidity limits and minimum coverage ratios designed to ensure that funding needs are met under stress conditions. If we project that we could breach these tolerances, we assess and determine appropriate liquidity management actions. However, market or other conditions in effect at that time may not permit us to achieve an increase in liquidity sources or a reduction in liquidity requirements.
Governance
Liquidity risk is overseen at the corporate level within ERM. The CRO has responsibility for the oversight of the Liquidity Risk Management Framework and delegates the day-to-day implementation of this framework to the AIG Treasurer. Our treasury function manages liquidity risk, subject to ERM oversight and various control processes.
The Liquidity Risk Management Framework is guided by the liquidity risk tolerance as set forth in the Board-approved risk appetite statement. The principal objective of this framework is to establish minimum liquidity requirements that protect our long-term viability and ability to fund our ongoing business, and to meet short-term financial obligations in a timely manner in both normal and stressed conditions.
Our Liquidity Risk Management Framework includes liquidity and funding policies and monitoring tools to address AIG-specific, broader industry and market-related liquidity events.
Risk Identification
The following sources of liquidity and funding risks could impact our ability to meet short-term financial obligations as they come due.
Market/Monetization Risk | Assets may not be readily transformed into cash due to unfavorable market conditions. Market liquidity risk may limit our ability to sell assets at reasonable values or necessary volumes to meet liquidity needs. Unfavorable market conditions could arise from credit deterioration, volatile interest rates, shocks in commodity prices or inflation, foreign exchange risk, equity volatility as well as adverse shocks in housing, employment, trade or other underlying market factors. |
Cash Flow Mismatch Risk | Discrete and cumulative cash flow mismatches or gaps over short-term horizons under both expected and adverse business conditions may create future liquidity shortfalls. |
Event Funding Risk | Additional funding may be required as the result of a trigger event. Event funding risk comes in many forms and may result from a downgrade in credit ratings, a market event, or some other event that creates a funding obligation or limits existing funding options. |
Financing Risk | We may be unable to raise additional cash on a secured or unsecured basis due to unfavorable market conditions, AIG-specific issues, or any other issue that impedes access to additional funding. |
Risk Measurement
Comprehensive cash flow projections under normal conditions are the primary component for identifying and measuring liquidity risk. We produce comprehensive liquidity projections over varying time horizons that incorporate all relevant liquidity sources and uses and include known and likely cash inflows and outflows. In addition, we perform stress testing by identifying liquidity stress scenarios and assessing the effects of these scenarios on our cash flow and liquidity.
160 AIG | 2021 Form 10-K
We use a number of approaches to measure our liquidity risk exposure, including:
Minimum Liquidity Limits | Minimum Liquidity Limits specify the amount of asset liquidity required to be maintained in order to meet obligations as they arise over a specified time horizon under stressed liquidity conditions. |
Coverage Ratios | Coverage Ratios measure the adequacy of available liquidity sources, including the ability to monetize assets to meet the forecasted cash flows over a specified time horizon. The portfolio of assets is selected based on our ability to convert those assets into cash under the assumed stressed conditions and within the specified time horizon. |
Cash Flow Forecasts | Cash Flow Forecasts measure the liquidity needed for a specific legal entity over a specified time horizon. |
Stress Testing | Asset liquidity and Coverage Ratios are re-measured under defined liquidity stress scenarios that will impact net cash flows, liquid assets and/or other funding sources. |
Relevant liquidity reporting is produced and reported regularly to AIG Parent and business unit risk committees. The frequency, content, and nature of reporting will vary for each business unit and legal entity, based on its complexity, risk profile, activities and size.
Operational Risk Management
Overview
Operational risk is defined as the risk of loss, or other adverse consequences, resulting from inadequate or failed internal processes, people, systems, or from external events. Operational risk includes legal, regulatory, technology, compliance, third-party and business continuity risks, but excludes business and strategy risks.
Operational risk is inherent in each of our business units and functions and can have many impacts, including but not limited to: unexpected economic losses or gains, reputational harm due to negative publicity, regulatory action from supervisory agencies and operational and business disruptions, and/or damage to customer relationships.
Governance
AIG and its consolidated subsidiaries establish and maintain operational risk and controls governance forums that include representatives from the relevant business units and functions to appropriately manage significant operational risk exposures.
Operational risk is overseen at the corporate level within ERM through the Head of Governance and Operational Controls. The Head of Governance and Operational Controls is responsible for the development and maintenance of the operational risk framework that includes policies, standards and deployment of systems.
Risk Identification, Measurement and Monitoring
The Operational Risk Management (ORM) function within ERM oversees adherence to the operational risk policy and risk and control framework, which includes risk identification, assessment, measurement, management and monitoring of operational risk exposures. ORM supports the Head of Governance and Operational Controls and has responsibility to provide an aggregate view of our operational risk profile. In line with the Three Lines of Defense Model, the ORM program includes, but is not limited to, several key components outlined below:
Risk Event Capture – enables every employee to identify, document, and escalate operational risk events, with a view to enhancing processes, promoting lessons learned and embedding a culture of risk management.
Risk Assessments – allows for the assessment, measurement and management of the key operational risks within our business units and helps inform on the efficacy of our control environment.
Key Risk Indicators – enhances the ongoing monitoring and mitigation of operational risks and facilitate risk reporting.
Issues Management – enables a consistent tracking and remediation of issues across the firm, including policy and process exceptions, control deficiencies and findings from risk and control assessment activities.
Scenario Analyses – executed by first- and second-line professionals to identify potential risks that could result in financial losses to the firm and support the prioritization of operational risk treatment.
AIG | 2021 Form 10-K 161
ORM, working together with other control and assurance functions (e.g., Compliance, Financial Controls Unit / Sarbanes Oxley, Enterprise Resiliency, and Internal Audit) through the risk and control framework, provides an independent view of operational risks for each business, and works with the business units, corporate functions, and the first line Risk and Control Owners. The first line responsibilities include coordinating identification, assessment, control and mitigation of risks to the operating environment and promoting awareness to facilitate implementation of the above programs. This includes coverage of operational risks related to core insurance activities, corporate functions, investing, model risk, technology, third-party providers, as well as compliance and regulatory matters. Based on the results of the risk identification and assessment efforts above, business leaders are accountable for tracking and remediating identified issues in line with our risk-monitoring procedures. Governance committees support these efforts and promote transparency enabling improved management decision making.
The risk and control framework facilitates the identification and mitigation of operational risk issues and is designed to: |
ensure first line accountability and ownership of risks and controls; promote role clarity among the business and risk and control functions; enhance transparency, risk management governance and culture; foster greater consistency in identifying, measuring and ranking material risks; proactively address potential risk issues and assign clear ownership and accountability for risk treatment; and manage the development of technology solutions that support the objectives above. |
Cybersecurity Risk
Cybersecurity risk is an important, constant, and evolving focus for AIG and the insurance and financial services industries in general. The goal of unauthorized parties, using a variety of attack methods, is to gain access to AIG’s data and systems to obtain confidential information, destroy data, disrupt or degrade service, sabotage systems or cause other damage. AIG, like other global companies, continues to witness the increased sophistication and activities of unauthorized parties attempting cyber and other computer-related penetrations such as “denial of service” attacks, phishing, untargeted but sophisticated and automated attacks, and other disruptive software in an effort to compromise systems, networks and obtain sensitive information. Cybersecurity risks may also derive from unintentional human error or intentional malice on the part of AIG employees or third parties who have authorized access to AIG’s systems or information.
ERM works closely with and supports the risk management practices of Information Technology, the Information Security Office and the business units and functions that form the lines of defense against the cybersecurity risks that we face. This includes the risks that emerge as a result of the execution of our business strategies and our corresponding exposure to new products, clients, service providers, industry segments and regions. AIG seeks to mitigate these risks through initiatives such as investments in technological infrastructure, education and training for employees and vendors, and monitoring of industry developments. As part of our overarching cybersecurity strategy, ERM monitors and assesses the programs designed to remediate our exposures and enhance our systems and applications security.
AIG’s Board of Directors is regularly briefed by management on AIG’s cybersecurity matters, including threats, policies, practices and ongoing efforts to improve security. As part of our disclosure controls and procedures, the Cyber Incident Management team, a cross functional group, is responsible for ensuring that the members of management responsible for disclosure controls are informed in a timely manner of known cybersecurity risks and incidents that may materially impact our operations so that timely notifications and public disclosures can be made as appropriate. There is no guarantee that the measures AIG takes and the resources AIG devotes to protect against cybersecurity risk will provide absolute security or recoverability of AIG’s systems given the complexity and frequency of the risk which AIG may not always be able to anticipate or adequately address. For additional information regarding the privacy data protection and cybersecurity regulations to which we are subject, see Part I, Item 1. Business – Regulation – U.S. Regulation – Privacy, Data Protection and Cybersecurity and – International Regulation – Privacy, Data Protection and Cybersecurity. For additional discussion of cybersecurity risks, see Part I, Item 1A. Risk Factors – Business and Operations.
162 AIG | 2021 Form 10-K
Insurance Risks
Overview
Insurance risk is defined as the risk of actual claims experience and/or policyholder behavior being materially different than initially expected at the inception of an insurance contract. Uncertainties related to insurance risk can lead to deviations in magnitude and/or timing of prospective cash flows associated with our liabilities compared to what we expected.
Except as described above, we manage our business risk oversight activities through our insurance operations. A primary goal in managing our insurance operations is to achieve an acceptable risk-adjusted return on equity. To achieve this goal, we must be disciplined in risk selection, premium adequacy, and appropriate terms and conditions to cover the risk accepted.
We operate our insurance businesses on a global basis, and we are exposed to a wide variety of risks with different time horizons. We manage these risks throughout the organization, both centrally and locally, through a number of processes and procedures, including, but not limited to:
pricing and risk selection models including regular monitoring;
pricing approval processes;
pre-launch approval of product design, development and distribution;
underwriting approval processes and authorities;
modeling and reporting of aggregations and limit concentrations at multiple levels (policy, line of business, product group, country, individual/group, correlation and catastrophic risk events);
risk transfer tools such as reinsurance, both internal and third-party;
review and challenge of reserves to ensure comprehensive analysis with established escalation procedures to provide appropriate transparency in reserving decisions and judgments made in the establishment of reserves;
management of relationship between assets and liabilities, including hedging;
model risk management framework and validation processes;
actuarial profitability and reserve reviews; and
experience monitoring and assumption updates.
We closely manage insurance risk by monitoring and controlling the nature and geographic location of the risks in each underwritten line of business, concentrations in industries, the terms and conditions of the underwriting and the premiums we charge for taking on the risk. We analyze concentrations of risks using various modeling techniques, including both probability distributions (stochastic) and/or single-point estimates (deterministic) approaches.
Governance
Insurance risks are monitored at the business unit level and overseen by the business unit’s chief risk officer. As part of our established governance practices, key decisions and considerations related to insurance risks can, and in certain instances, must be raised and deferred for discussion and consideration to the business unit’s risk committees that are chaired by the business unit’s chief risk officer. In addition, in some business units, pricing committees review insurance risk considerations associated with pricing of new insurance products. The insurance risk oversight framework includes the following key components:
articulation of risk appetite by line of business that integrates strategy, financial objectives and capital resources;
written policies that define the rules for our insurance risk-taking activities;
a limit / threshold framework focused on key insurance risks that aligns with our Board-approved risk appetite statement;
clearly defined authorities for all individuals and committee roles and responsibilities related to insurance risk management;
identification of client segments that meet our selection criteria and a focus on distribution channels that target these customers; and
underwriting and claims quality/compliance reviews.
AIG | 2021 Form 10-K 163
Risk Identification
General Insurance companies – risks covered include property, casualty, fidelity/surety, accident and health, aviation, mortgage insurance, professional liability, cyber and management liability. We manage risks in the General Insurance business through aggregations and limitations of concentrations at multiple levels: policy, line of business, geography, industry and legal entity.
Life and Retirement companies – risks include mortality and morbidity in the individual and group life insurance and health coverage products, longevity risk in the individual retirement, group retirement and institutional markets products, and policyholder behavior across all product lines. We manage risks through product design, sound medical and non-medical underwriting, reinsurance and at times hedging instruments in the market.
We purchase reinsurance for our insurance and reinsurance operations. Reinsurance facilitates insurance risk management (retention, volatility, concentrations) and capital planning. We may purchase reinsurance on a pooled basis. Pooling of our reinsurance risks enables us to purchase reinsurance more efficiently at a consolidated level, manage global counterparty risk and relationships and manage global catastrophe risks.
Risk Measurement, Monitoring and Limits
We use a number of approaches to measure our insurance risk exposure, including: |
Sensitivity analysis. Deterministic analyses are used to measure statistical variances from best estimate assumptions on important risk factors, as well as different distributions risk categories. Stochastic methods. Stochastic methods are used to measure and monitor risks including natural catastrophe, reserve and premium risk. We develop probabilistic estimates of risk based on our exposures, historical observed volatility or industry-recognized models in the case of catastrophe risk. In addition, stochastic methods are used to measure risks of impacts of policyholder behavior on values of options and guarantees offered across annuity and life insurance products. Scenario analysis. Scenario or deterministic analysis is used to measure and monitor risks such as terrorism and pandemic or to estimate losses due to man-made catastrophic scenarios. Experience studies. Ongoing assessment of mortality, longevity, morbidity and policyholder behavior experience relative to that assumed in pricing and valuation and that experienced in the general market. |
Additionally, there are risk-specific assessment tools, both internal and third-party, in place to better manage the variety of insurance risks to which we are exposed.
We monitor concentrations of exposure through insurance limits and thresholds aggregated along dimensions such as geography, industry, or counterparty.
The risk monitoring responsibilities of the business units include ensuring compliance with insurance risk limits and escalation and remediation of limit breaches. Such activities are reported to management by all business units for informative decision-making on a regular basis. This monitoring approach is aligned with our overall risk limits framework. Risk limits have a consistent framework used across AIG, its business units, and legal entities.
For additional information on our three-tiered hierarchy of limits see Risk Appetite, Limits, Identification and Measurement – Risk Limits.
General Insurance Companies’ Key Risks
We manage our risks through risk review and selection processes, exposure limitations, exclusions, deductibles, self-insured retentions, coverage limits, attachment points, and reinsurance. This management is supported by sound underwriting practices, pricing procedures and the use of actuarial analysis to help determine overall adequacy of provisions for insurance. Underwriting practices and pricing procedures incorporate historical experience, changes in underlying exposure, current regulation and judicial decisions as well as proposed or anticipated regulatory changes or societal trends.
164 AIG | 2021 Form 10-K
For General Insurance companies, risks primarily include the following:
Loss Reserves – The potential inadequacy of the liabilities we establish for unpaid losses and loss adjustment expenses is a key risk faced by the General Insurance companies. There is significant uncertainty in factors that may drive the ultimate development of losses compared to our estimates of losses and loss adjustment expenses. We manage this uncertainty through internal controls and oversight of the loss reserve setting process, as well as reviews by external experts. For further information see Critical Accounting Estimates – Loss Reserves.
Underwriting – The potential inadequacy of premiums charged for future risk periods on risks underwritten in our portfolios can impact the General Insurance companies’ ability to achieve an underwriting profit. We develop pricing based on our estimates of losses and expenses, but factors such as market pressures and the inherent uncertainty and complexity in estimating losses may result in premiums that are inadequate to generate underwriting profit. This may be driven by adverse economic conditions, unanticipated emergence of risks or increase in frequency of claims, or unexpected or increased costs or expenses.
Catastrophe Exposure – Our business is exposed to various catastrophic events in which multiple losses can occur and affect multiple lines of business in any calendar year. Natural disasters, such as hurricanes, earthquakes and other catastrophes, have the potential to adversely affect our operating results. Other risks, such as man-made catastrophes or pandemic disease, could also adversely affect our business and operating results to the extent they are covered by our insurance products. Concentration of exposure in certain industries or geographies may cause us to suffer disproportionate losses.
Single Risk Loss Exposure – Our business is exposed to loss events that have the potential to generate losses from a single insured client. Events such as fires or explosions can result in loss activity for our clients. The net risk to us is managed to acceptable limits established by the Chief Underwriting Officer through a combination of internal underwriting standards and external reinsurance. Furthermore, single risk loss exposure is managed and monitored on both a segregated and aggregated basis.
Reinsurance – Since we use reinsurance to limit our losses, we are exposed to risks associated with reinsurance including the unrecoverability of expected payments from reinsurers due to either an inability or unwillingness to pay, contracts that do not respond properly to the event or actual reinsurance coverage that is different than anticipated. The inability or unwillingness to pay is considered credit risk and is monitored through our credit risk management framework.
Natural Catastrophe Risk
We manage catastrophe exposure with multiple approaches such as setting risk limits based on aggregate Probable Maximum Loss (PML) modeling, monitoring overall exposures and risk accumulations, modifying our gross underwriting standards, and purchasing catastrophe reinsurance through both the traditional reinsurance and capital markets in addition to other reinsurance protections.
We use third-party catastrophe risk models and other tools to evaluate and simulate frequency and severity of catastrophic events and associated losses to our portfolios of exposures. We apply adjustments to modeled losses to account for loss adjustment expenses, model biases, data quality and non-modeled risks.
We perform post-catastrophe event studies to identify model inefficiencies, underwriting gaps, and improvement opportunities. Lessons learned from post-catastrophe event studies are incorporated into the modeling and underwriting processes of risk pricing and selection. The majority of policies exposed to catastrophic risks are one-year contracts that allow us to adjust our underwriting guidelines, pricing and exposure accumulation in a relatively short period.
We recognize that climate change has implications for insurance industry exposure to natural catastrophe risk. With multiple levels of risk management processes in place, we actively analyze the latest climate science and policies to anticipate potential changes to our risk profile, pricing models and strategic planning. For example, we continually consider changes in climate and weather patterns as an integral part of the underwriting process. In addition, we provide insurance products and services to help our clients be proactive against the threat of climate change. Our internal product development, underwriting, and modeling, will continue to adapt to and evolve with the developing risk exposures attributed to climate change.
Our natural catastrophe exposure to primary modeled perils is principally driven by the U.S. and secondarily Japan, though our overall exposure is diversified across multiple countries and perils. We have exposures to additional perils such as European windstorms and wildfire exposures across multiple countries. Within the U.S., we have significant hurricane exposure in Florida, the Gulf of Mexico, the Northeast U.S. and mid-Atlantic regions and significant earthquake exposure in California and the Pacific Northwest regions. Earthquakes impacting the Pacific Northwest region may result in a higher share of industry losses than other regions primarily due to our relative share of exposure in these regions. Additionally, we have significant gross wildfire exposures in California.
The table below details our modeled estimates of PML, net of reinsurance, on an annual aggregate basis. The 1-in-100 and 1-in-250 PMLs are the annual aggregate probable maximum losses with probability of 1 percent and 0.4 percent in a year, respectively. Estimates as of December 31, 2021 reflect our in-force portfolio for exposures as of October 1, 2021 and all inuring reinsurance covers as of December 31, 2021, except for the catastrophe reinsurance programs, which are as of January 1, 2022.
AIG | 2021 Form 10-K 165
The following table presents an overview of annual aggregate modeled losses for world-wide all perils and exposures arising from our largest primarily modeled perils:
At December 31, 2021 |
| Net of |
| Net of | Percent of Total |
|
(in millions) |
| Reinsurance |
| Reinsurance, After Tax(f) | Shareholder Equity |
|
Exposures: |
|
|
|
|
|
|
World-wide all peril (1-in-250)(a) | $ | 4,197 | $ | 3,316 | 5.0 | % |
U.S. Hurricane (1-in-100)(b) |
| 1,165 |
| 920 | 1.4 |
|
U.S. Earthquake (1-in-250)(c) |
| 1,105 |
| 873 | 1.3 |
|
Japanese Typhoon (1-in-100)(d) |
| 573 |
| 453 | 0.7 |
|
Japanese Earthquake (1-in-250)(e) |
| 492 |
| 388 | 0.6 |
|
(a) The world-wide all peril loss estimate includes wildfire exposure.
(b) The U.S. hurricane loss estimate includes losses to Commercial and Personal Property from hurricane hazards of wind and storm surge.
(c) The U.S. earthquake loss estimates represent exposure to Commercial and Personal Property, Workers’ Compensation (U.S.) and A&H business lines.
(d) Japan Typhoon loss estimate represents exposure to Commercial and Personal Property.
(e) Japan Earthquake loss estimate represents exposure to Commercial and Personal Property and A&H business lines.
(f) Taxed at the statutory tax rate of 21 percent for both the U.S. and Japanese modeled losses. The majority of Japan exposures are ceded to our U.S. Pool.
AIG, along with other property casualty insurance and reinsurance companies, uses industry-recognized catastrophe models and applies proprietary modeling processes and assumptions to arrive at loss estimates. The use of different methodologies and assumptions could materially change the projected losses. Since there is no industry standard for assumptions and preparation of insured data for use in these models, our modeled losses may not be comparable to estimates made by other companies.
Also, the modeled results are based on the assumption that all reinsurers fulfill their obligations to us under the terms of the reinsurance arrangements. However, reinsurance recoverables may not be fully collectible. Therefore, these estimates are inherently uncertain and may not accurately reflect our net exposure, inclusive of credit risk, to these events.
Our 2022 property catastrophe reinsurance program is a worldwide program providing both aggregate and per occurrence protection, with differing per occurrence and aggregate attachment points for North America, Japan, and Rest of World (for these purposes, Hawaii is included in Rest of World and Mexico and the Caribbean are included in North America). The program includes $1.0 billion of per occurrence limit that is shared across the regional towers, as well as $1.1 billion of aggregate limit that is also shared across the regional towers.
Our coverage for North America includes:
$1.275 billion of per occurrence protection, the first $275 million of which is partially placed, covering our U.S and Caribbean personal lines business, with varying attachment points in specific geographies and for specific perils ranging from $50 million to $150 million
Per occurrence protection of up to $1.75 billion (inclusive of the shared per occurrence limit) excess of $250 million, primarily covering commercial exposures but also personal lines exposures not covered by the above personal lines protection
Aggregate protection utilizing the $1.1 billion of shared limit attaching excess $400 million with per occurrence deductibles of $25 million or $50 million, depending on region/event, primarily covering commercial exposures
Our coverage for exposure outside North America includes:
Japan per occurrence coverage of $1.45 billion (inclusive of the shared per occurrence limit) excess of $200 million and includes both personal and commercial exposure
Rest of World per occurrence coverage of $1.3 billion (inclusive of the shared per occurrence limit) excess of $100 million, including both personal and commercial exposure
Rest of World and Japan $1.1 billion of aggregate shared limit attaching excess of $100 million and $200 million, respectively, with per occurrence deductibles of $20 million
Although the $1.1 billion of aggregate shared limit coverage for North America, Japan and Rest of World has varying retentions per region, the maximum aggregate retention globally, after the impact of the per occurrence deductibles, is $600 million for 2022.
We have also purchased property per risk covers that provide protection against large losses globally, which include those emanating from non-critical catastrophe events (all events except for named windstorm and earthquake) globally as well as critical catastrophe events (named windstorm and earthquake) outside North America.
166 AIG | 2021 Form 10-K
For Validus Re, our catastrophe protection comes from a variety of reinsurance protections but is largely providing $400 million of per occurrence limit in excess of a $150 million retention for US windstorm and earthquake, $150 million of per occurrence limit in excess of a $200 million retention for Europe, Japan and other US perils and in excess of $125 million retention for rest of the world perils. Further to the occurrence protection, there is $175 million of limit in excess of a $350 million retention (subject to per event caps) placed on a worldwide aggregate excess of loss cover and $400 million of limit excess $550 million on an aggregate index basis via the renewed Tailwind Re Cat Bond which covers U.S., Puerto Rico and Canada named storm losses.
Actual results in any period are likely to vary, perhaps materially, from the modeled scenarios. The occurrence of one or more severe events could have a material adverse effect on our financial condition, results of operations and liquidity.
For additional information see also Part 1, Item 1A. Risk Factors – Reserves and Exposures.
Terrorism Risk
We actively monitor terrorism risk and manage exposures to losses from terrorist attacks. We have set risk limits based on modeled losses from certain terrorism attack scenarios. Terrorism risks are modeled using a third-party vendor model for various terrorism attack modes and scenarios. Adjustments are made to account for vendor model gaps and the nature of the General Insurance companies’ exposures. Examples of modeled scenarios are conventional bombs of different sizes, anthrax attacks and nuclear attacks.
Our largest terrorism concentrations are in New York City, and estimated losses are largely driven by the Property and Workers’ Compensation lines of business. At our largest exposure location, modeled losses for a five-ton bomb attack net of the Terrorism Risk Insurance Program Reauthorization Act (TRIPRA) and reinsurance recoveries are estimated to be $1.3 billion based on the exposures as of October 1, 2021.
Our exposure to terrorism risk in the U.S. is mitigated by TRIPRA in addition to limited private reinsurance protections. TRIPRA covers certified terrorist attacks within the United States or U.S. missions and against certain U.S. carriers or vessels and excludes certain lines of business as specified by applicable law. In 2021, TRIPRA covers 80 percent of insured losses above a deductible. The current estimate of our deductible is approximately $1.7 billion for 2021.
We offer terrorism coverage in many other countries through various insurance products and participate in country terrorism pools when applicable. International terrorism exposure is estimated using scenario-based modeling and exposure concentration is monitored routinely. Targeted reinsurance purchases are made for some lines of business to cover potential losses due to terrorist attacks. We also rely on the government-sponsored and government-arranged terrorism reinsurance programs, including pools, in force in applicable non-U.S. jurisdictions.
Life and Retirement Companies’ Key Risks
We manage risk through product design, experience monitoring, pricing and underwriting discipline, risk limits and thresholds, reinsurance and active monitoring and management of the alignment between risk and cash flow profiles of assets and liabilities, and hedging instruments.
For Life and Retirement companies, risks include the following:
Longevity risk – represents the risk of an increase in liabilities associated with an insurance product, e.g. an annuity policy or a payout benefit as a result of actual mortality experience being lower than the expected mortality experience. This risk could arise from medical advancement and longer-term societal health changes. This risk exists in a number of our product lines but is most significant for our annuity products.
Morbidity risk – represents the risk arising from actual morbidity (e.g. illness, disability or disease) incidence rate being higher than expected or the length of the claims extending longer than expected resulting in a higher overall benefit payout. This risk could arise from longer-term medical advances in detection and treatment for various diseases and medical conditions resulting in higher claim amounts. This risk exists in a number of our product lines such as individual and group accident and health and long-term care businesses which for the most part are in run-off, and ceded to Fortitude Re.
Mortality (including pandemic) risk – represents the risk of unexpected loss arising from current actual mortality experience being higher than expected mortality experience. This risk could arise from pandemics or other events, including longer-term societal changes that cause higher-than-expected current mortality. This risk exists in a number of our product lines, but is most significant for our life insurance products.
AIG | 2021 Form 10-K 167
Policyholder behavior risk (including full and partial surrender/lapses) – represents the risk that actual policyholder behavior differs from expected behavior in a manner that has an adverse effect on our operating results. There are many related assumptions made when products are sold, including how long the contracts will persist and other assumptions which impact the expected utilization of contract benefits, options and guarantees. Actual experience can vary significantly from these assumptions. This risk is impacted by a number of factors including changes in personal policyholder situations and market conditions, especially changes in the levels of yields, equity prices, tax law, regulations, competitive landscape and policyholder preferences. This risk exists in many of our product lines, but most notably within the annuity and individual life portfolio of business.
The emergence of significant adverse experience compared to the experience we expected and priced for could require an adjustment to benefit reserves and/or DAC, which could have a material adverse effect on our consolidated financial results of operations for a particular period.
For additional information on the impact of actual and expected experience on DAC and benefit reserves see Critical Accounting Estimates – Future Policy Benefit Reserves for Life and Accident and Health Insurance Contracts and Critical Accounting Estimates – Liabilities for Guaranteed Benefit Features of Variable Annuity, Fixed Annuity and Fixed Index Annuity Products. For additional information on business risks see Part I, Item 1A. Risk Factors – Business and Operations.
Variable Annuity, Index Annuity and Universal Life Risk Management and Hedging Programs
Our Individual and Group Retirement businesses offer variable and index annuity products with guaranteed living benefit (GLB) riders that guarantee a certain level of lifetime benefits. Under GAAP rules, variable and certain index annuity GLBs are accounted for as embedded derivatives measured at fair value, with changes in the fair value recorded in Other realized gains (losses). GLB features subject the Life and Retirement companies to market risk, including exposure to changes in levels of interest rates, equity prices, credit spreads and market volatility.
Product design is the first step in managing our exposure to these market risks. Risk mitigation features of our variable annuity product designs include GLB rider fees indexed to a broad equity market volatility index, which can provide additional fee assessments in periods of increased market volatility, required minimum allocations to fixed accounts to reduce overall equity exposure, and for some of the variable annuity products, the utilization of volatility control funds, which have an ability to adjust equity exposures in these funds in response to changes in market volatility, even under sudden or extreme market movements.
We utilize asset liability management and hedging programs to manage economic exposure to market risks that are not fully mitigated through product designs. Our hedging program is designed to offset certain changes in the economic value of embedded derivatives associated with our variable annuity, index annuity and index universal life liabilities, within established thresholds. The hedging program is designed to provide additional protection against large and combined movements in levels of interest rates, equity prices, credit spreads and market volatility under multiple scenarios.
Our hedging program utilizes an economic hedge target, which represents our estimate of the underlying economic risks in the embedded derivatives. For example, for variable annuity GLBs, the hedge targets are calculated as a difference between present value of the future expected benefit payments for the GLB and the present value of future GLB rider fees, with present values determined over numerous equally weighted stochastic scenarios. This stochastic projection method uses best estimate assumptions for policyholder behavior (including mortality, lapses, withdrawals and benefit utilization) in conjunction with market scenarios calibrated to observable equity and interest rate option prices. Policyholder behaviors are regularly evaluated to compare current assumptions to actual experience and, if appropriate, changes are made to the policyholder behavior assumptions. The risk of changes in policyholder behavior is not explicitly hedged, and such differences between expected and actual policyholder behaviors will result in hedge ineffectiveness.
Due to differences between the calculation of the value of the economic hedge target and the U.S. GAAP valuation of the embedded derivative, which include differences in the treatment of rider fees and exclusion of certain risk margins and other differences in discount rates, we expect relative movements in the economic hedge target and the U.S. GAAP embedded derivative valuation will vary over time with changes in levels of equity markets, interest rates, credit spreads and volatility.
For information on the impact on our consolidated pre-tax income from the change in fair value of the embedded derivatives and the hedging portfolio, as well as additional discussion of differences between the economic hedge target and the valuation of the embedded derivatives see Insurance Reserves – Life and Annuity Future Policy Benefits, Policyholder Contract Deposits and DAC – Variable Annuity Guaranteed Benefits and Hedging Results.
168 AIG | 2021 Form 10-K
In designing the hedging portfolio for our variable annuity hedging program, we make assumptions that are used in projections of future performance of the underlying mutual funds elected by the variable annuity policyholders. We use these assumptions to project future policy level account value changes. We map the mutual funds to a set of publicly traded indices that we believe best represent the liability to be hedged. Basis risk exists due to the variance between funds returns projected under these assumptions and actual fund returns, which may result in variances between changes in the value of the hedging portfolio and changes in the economic value of the hedge liability target. Net hedge results and the associated cost of hedging are also impacted by differences between realized volatility and implied volatility.
Our hedging programs associated with index annuity and index universal life products, are designed to manage market risk associated with the index crediting strategies offered on these product platforms. These hedging programs are designed to offset the economic risk arising in conjunction with index returns, associated with the crediting strategies that will be occurring during the current crediting rate reset period. Similarly, as with the variable annuities, there are differences between the calculation of the value of the economic liability hedge target and the U.S. GAAP valuation of the index annuity and index universal life embedded derivatives, which can lead to variances in their relative movements.
To manage the capital market exposures embedded within the economic liability hedge targets, we identify and hedge market sensitivities to changes in equity markets, interest rates, volatility and for variable annuities, credit spreads. Each hedge program purchases derivative instruments or securities having sensitivities that offset corresponding sensitivities in the associated economic hedge targets, within internally defined threshold limits. Since the relative movements of the hedging portfolio and the economic hedge target vary over time or with market changes, the net exposure can be outside the threshold limits. As such, periodic adjustments are made to the hedging portfolio in order to return the net exposure to within the threshold limits.
Our hedging programs utilize various derivative instruments, including but not limited to equity options, futures contracts, interest rate swaps and swaptions, as well as other hedging instruments. In addition, within the variable annuities hedging program, we purchase certain fixed income securities classified as available for sale. To minimize counterparty credit risk, the majority of the derivative instruments utilized within the hedging programs are cleared through global exchanges. Over the counter derivatives utilized within the hedging programs are subject to two-way collateralization, managed under a net zero collateral threshold.
The hedging programs are monitored on a daily basis to ensure that the economic liability hedge targets and the associated derivative portfolios stay within the threshold limits, pursuant to the approved hedging strategies. In addition, monthly stress tests are performed to determine the program’s effectiveness relative to the applicable limits, under an array of combined severe market stresses in equity prices, interest rates, volatility and credit spreads. Finally, hedging strategies are reviewed regularly to gauge their effectiveness in managing our market exposures in the context of our overall risk appetite.
Reinsurance Activities
Reinsurance is used primarily to manage overall capital adequacy and mitigate the insurance loss (Life and Non-Life) exposure related to certain events, such as natural and man-made catastrophes, death events, or single policy level events. Our subsidiaries operate worldwide primarily by underwriting and accepting risks for their direct account on a gross basis and reinsuring a portion of the exposure on either an individual risk or an aggregate basis to the extent those risks exceed the desired retention level. In addition, as a condition of certain direct underwriting transactions, we may be required by clients, agents or regulation to cede all or a portion of risks to specified reinsurance entities, such as captives, other insurers, local reinsurers and compulsory pools.
Reinsurance markets include:
Traditional local and global reinsurance markets including those in the United States, Bermuda, London and Europe, accessed directly and through reinsurance intermediaries;
Capital markets through insurance-linked securities and collateralized reinsurance transactions, such as catastrophe bonds, sidecars and similar vehicles; and
Other insurers that engage in both direct and assumed reinsurance.
The form of reinsurance we may choose from time to time will generally depend on whether we are seeking:
proportional reinsurance, whereby we cede a specified percentage of premiums and losses to reinsurers;
non-proportional or excess of loss reinsurance, whereby we cede all or a specified portion of losses in excess of a specified amount on a per risk, per occurrence (including catastrophe reinsurance) or aggregate basis; or
facultative contracts that reinsure individual policies.
We continually evaluate the relative attractiveness of different forms of reinsurance contracts and different markets that may be used to achieve our risk and profitability objectives.
AIG | 2021 Form 10-K 169
Reinsurance contracts do not relieve our subsidiaries from their direct obligations to insureds. However, an effective reinsurance program substantially mitigates our exposure to potentially significant losses.
In certain markets, we are required to participate on a proportional basis in reinsurance pools based on our relative share of direct writings in those markets. Such mandatory reinsurance generally covers higher-risk consumer exposures such as assigned-risk automobile and earthquake, as well as certain commercial exposures such as workers’ compensation.
Reinsurance Recoverable
AIG’s reinsurance recoverable assets are comprised of:
Paid losses recoverable – balances due from reinsurers for losses and loss adjustment expenses paid by our subsidiaries and billed, but not yet collected.
Ceded loss reserves – ultimate ceded reserves for losses and loss adjustment expenses, including reserves for claims reported but not yet paid and estimates for IBNR.
Ceded reserves for unearned premiums.
Life and Annuity reinsurance recoverables (ceded policy and claim reserves and policyholder contract deposits).
At December 31, 2021, total reinsurance recoverable assets were $74.3 billion. These assets include general reinsurance paid losses recoverable of $3.3 billion, ceded loss reserves of $35.3 billion including reserves for IBNR claims, and ceded reserves for unearned premiums of $4.3 billion, as well as life reinsurance recoverable of $31.4 billion. The methods used to estimate IBNR and to establish the resulting ultimate losses involve projecting the frequency and severity of losses over multiple years. These methods are continually reviewed and updated by management. Any adjustments are reflected in income. We believe that the amount recorded for ceded loss reserves at December 31, 2021 reflects a reasonable estimate of the ultimate losses recoverable. Actual losses may, however, differ from the reserves currently ceded.
The Reinsurance Credit Department (RCD) conducts periodic detailed assessments of the financial strength and condition of current and potential reinsurers, both foreign and domestic. The RCD monitors both the financial condition of reinsurers as well as the total reinsurance recoverable ceded to reinsurers, and sets limits with regard to the amount and type of exposure we are willing to take with reinsurers. As part of these assessments, we attempt to identify whether a reinsurer is appropriately licensed, assess its financial capacity and liquidity, and evaluate the local economic and financial environment in which a foreign reinsurer operates. The RCD reviews the nature of the risks ceded and the need for measures, including collateral to mitigate credit risk. For example, in our treaty reinsurance contracts, we frequently include provisions that require a reinsurer to post collateral or use other measures to reduce exposure when a referenced event occurs. Furthermore, we limit our unsecured exposure to reinsurers through the use of credit triggers such as insurer financial strength rating downgrades, declines in regulatory capital, or relevant RBC ratios fall below certain levels. We also set maximum limits for reinsurance recoverable exposure, which in some cases is the recoverable amount plus an estimate of the maximum potential exposure from unexpected events for a reinsurer. In addition, credit executives within ERM review reinsurer exposures and credit limits and approve reinsurer credit limits above specified levels. Finally, even where we conclude that uncollateralized credit risk is acceptable, we require collateral from active reinsurance counterparties where it is necessary for our subsidiaries to recognize the reinsurance recoverable assets for statutory accounting purposes. At December 31, 2021, we held $77.5 billion of collateral, in the form of funds withheld, securities in reinsurance trust accounts and/or irrevocable letters of credit, in support of reinsurance recoverable assets from unaffiliated reinsurers.
The following table presents information for each reinsurer representing in excess of five percent of our total reinsurance recoverable assets:
At December 31, 2021 |
| A.M. |
| Gross |
| Percent of |
|
|
| Uncollateralized | |
| S&P | Best | Reinsurance |
| Reinsurance |
|
| Collateral | Reinsurance | ||
(in millions) | Rating(a) | Rating(a) |
| Assets |
| Assets(b) |
|
| Held(c) |
| Assets |
Reinsurer: |
|
|
|
|
|
|
|
|
|
|
|
Fortitude Re | NR | A | $ | 34,228 |
| 46.1 | % | $ | 34,228 | $ | - |
Berkshire Hathaway Group of Companies | AA+ | A++ | $ | 13,051 | (d) | 17.6 | % | $ | 12,827 | $ | 224 |
Swiss Reinsurance Group of Companies | AA- | A+ | $ | 4,229 |
| 5.7 | % | $ | 1,397 | $ | 2,832 |
(a) The financial strength ratings reflect the ratings of the various reinsurance subsidiaries of the companies listed as of January 27, 2022.
(b) Total reinsurance assets include both Property Casualty and Life and Retirement reinsurance recoverable.
(c) Excludes collateral held in excess of recoverable balances.
(d) Includes $11.9 billion recoverable under the 2011 retroactive asbestos reinsurance transaction and the 2017 adverse development reinsurance agreement.
170 AIG | 2021 Form 10-K
At December 31, 2021, we had no significant reinsurance recoverable due from any individual reinsurer that was financially troubled. Reduced profitability associated with lower interest rates, market volatility and catastrophe losses (including COVID-19), could potentially result in reduced capacity or rating downgrades for some reinsurers. The RCD, in conjunction with the credit executives within ERM, reviews these developments, monitors compliance with credit triggers that may require the reinsurer to post collateral, and seeks to use other appropriate means to mitigate any material risks arising from these developments.
For additional information on reinsurance recoverable see Critical Accounting Estimates – Reinsurance Assets.
Other BUSINESS RiskS
Derivative Transactions
We utilize derivatives principally to enable us to hedge exposure associated with changes in levels of interest rates, currencies, credit, commodities, equity prices and other risks. Credit risk associated with derivative counterparties exists for a derivative contract when that contract has a positive fair value to us. The maximum potential exposure will increase or decrease during the life of the derivative commitments as a function of maturity and market conditions. All derivative transactions must be transacted within counterparty limits that have been approved by ERM.
We evaluate counterparty credit quality via an internal analysis that is consistent with the AIG Credit Policy. We utilize various credit enhancements, including letters of credit, guarantees, collateral, credit triggers, credit derivatives, margin agreements and subordination to reduce the credit risk related to outstanding financial derivative transactions. We require credit enhancements in connection with specific transactions based on, among other things, the creditworthiness of the counterparties, and transaction size and maturity. Furthermore, we enter into certain agreements that have the benefit of set-off and close-out netting provisions, such as ISDA Master Agreements. These provisions provide that, in the case of an early termination of a transaction, we can set off receivables from a counterparty against payables to the same counterparty arising out of all covered transactions. As a result, where a legally enforceable netting agreement exists, the fair value of the transaction with the counterparty represents the net sum of estimated fair values.
The fair value of our interest rate, currency, credit, commodity and equity swaps, options, swaptions, and forward commitments, futures, and forward contracts reported as a component of Other assets, was approximately $0.8 billion at both December 31, 2021 and December 31, 2020. Where applicable, these amounts have been determined in accordance with the respective master netting agreements.
The following table presents the fair value of our derivatives portfolios in asset positions by internal counterparty credit rating:
At December 31, |
|
|
|
|
(in millions) |
| 2021 |
| 2020 |
Rating: |
|
|
|
|
AAA | $ | 41 | $ | 8 |
AA |
| 201 |
| 12 |
A |
| 107 |
| 130 |
BBB |
| 473 |
| 601 |
Below investment grade* |
| 21 |
| 23 |
Total | $ | 843 | $ | 774 |
* Below investment grade includes not rated.
For additional information related to derivative transactions see Note 10 to the Consolidated Financial Statements.
AIG | 2021 Form 10-K 171
Glossary
Accident year The annual calendar accounting period in which loss events occurred, regardless of when the losses are actually reported, booked or paid.
Accident year combined ratio, as adjusted (Accident year combined ratio, ex-CAT) The combined ratio excluding catastrophe losses and related reinstatement premiums, prior year development, net of premium adjustments, and the impact of reserve discounting.
Accident year loss ratio, as adjusted (Accident year loss ratio, ex-CAT) The loss ratio excluding catastrophe losses and related reinstatement premiums, prior year development, net of premium adjustments, and the impact of reserve discounting.
Acquisition ratio Acquisition costs divided by net premiums earned. Acquisition costs are those costs incurred to acquire new and renewal insurance contracts and also include the amortization of VOBA and DAC. Acquisition costs vary with sales and include, but are not limited to, commissions, premium taxes, direct marketing costs and certain costs of personnel engaged in sales support activities such as underwriting.
Additional premium represents a premium on an insurance policy over and above the initial premium imposed at the beginning of the policy. An additional premium may be assessed if the insured’s risk is found to have increased significantly.
Adjusted revenues exclude Net realized gains (losses), income from non-operating litigation settlements (included in Other income for GAAP purposes) and changes in fair value of securities used to hedge guaranteed living benefits (included in Net investment income for GAAP purposes). Adjusted revenues is a GAAP measure for our segments.
Assets under administration include assets under management and Retail Mutual Funds and Group Retirement mutual fund assets that we sell or administer.
Assets under management include assets in the general and separate accounts of our subsidiaries that support liabilities and surplus related to our life and annuity insurance products and the notional value of stable value wrap contracts.
Attritional losses are losses recorded in the current accident year, which are not catastrophe losses.
Base spread Net investment income excluding income from alternative investments and other enhancements, less interest credited excluding amortization of deferred sales inducements.
Base yield Net investment income excluding income from alternative investments and other enhancements, as a percentage of average base invested asset portfolio, which excludes alternative investments, other bond securities and certain other investments for which the fair value option has been elected.
Book value per common share, excluding accumulated other comprehensive income (loss) (AOCI) adjusted for the cumulative unrealized gains and losses related to Fortitude Re funds withheld assets and deferred tax assets (DTA) (Adjusted book value per common share) is a non-GAAP measure and is used to show the amount of our net worth on a per-common share basis. Adjusted book value per common share is derived by dividing total AIG common shareholders’ equity, excluding AOCI adjusted for the cumulative unrealized gains and losses related to Fortitude Re funds withheld assets and DTA (Adjusted Common Shareholders’ Equity), by total common shares outstanding.
Casualty insurance Insurance that is primarily associated with the losses caused by injuries to third persons, i.e., not the insured, and the legal liability imposed on the insured as a result.
Combined ratio Sum of the loss ratio and the acquisition and general operating expense ratios.
CSA Credit Support Annex A legal document generally associated with an ISDA Master Agreement that provides for collateral postings which could vary depending on ratings and threshold levels.
Credit Valuation Adjustment (CVA)/Non-Performance Risk Adjustment (NPA) The CVA/NPA adjusts the valuation of derivatives to account for nonperformance risk of our counterparty with respect to all net derivative assets positions. Also, the CVA/NPA reflects the fair value movement in AIGFP's asset portfolio that is attributable to credit movements only, without the impact of other market factors such as interest rates and foreign exchange rates. Finally, the CVA/NPA also accounts for our own credit risk in the fair value measurement of all derivative net liability positions and liabilities where AIG has elected the fair value option, when appropriate.
DAC Deferred Policy Acquisition Costs Deferred costs that are incremental and directly related to the successful acquisition of new business or renewal of existing business.
172 AIG | 2021 Form 10-K
DAC Related to Unrealized Appreciation (Depreciation) of Investments An adjustment to DAC and Reserves for investment-oriented products, equal to the change in DAC and unearned revenue amortization that would have been recorded if fixed maturity securities available for sale at fair value had been sold at their stated aggregate fair value and the proceeds reinvested at current yields. An adjustment to benefit reserves for investment-oriented products is also recognized to reflect the application of the benefit ratio to the accumulated assessments that would have been recorded if fixed maturity securities available for sale at fair value had been sold at their stated aggregate fair value and the proceeds reinvested at current yields.
For long-duration traditional products, significant unrealized appreciation of investments in a sustained low interest rate environment may cause additional future policy benefit liabilities to be recorded.
Deferred gain on retroactive reinsurance Retroactive reinsurance is a reinsurance contract in which an assuming entity agrees to reimburse a ceding entity for liabilities incurred as a result of past insurable events. If the amount of premium paid by the ceding reinsurer is less than the related ceded loss reserves, the resulting gain is deferred and amortized over the settlement period of the reserves. Any related development on the ceded loss reserves recoverable under the contract would increase the deferred gain if unfavorable, or decrease the deferred gain if favorable.
DSI Deferred Sales Inducements Represents enhanced crediting rates or bonus payments to contract holders on certain annuity and investment contract products that meet the criteria to be deferred and amortized over the life of the contract.
Expense ratio Sum of acquisition expenses and general operating expenses, divided by net premiums earned.
General operating expense ratio General operating expenses divided by net premiums earned. General operating expenses are those costs that are generally attributed to the support infrastructure of the organization and include but are not limited to personnel costs, projects and bad debt expenses. General operating expenses exclude losses and loss adjustment expenses incurred, acquisition expenses, and investment expenses.
GIC/GIA Guaranteed Investment Contract/Guaranteed Investment Agreement A contract whereby the seller provides a guaranteed repayment of principal and a fixed or floating interest rate for a predetermined period of time.
IBNR Incurred But Not Reported Estimates of claims that have been incurred but not reported to us.
ISDA Master Agreement An agreement between two counterparties, which may have multiple derivative transactions with each other governed by such agreement, that generally provides for the net settlement of all or a specified group of these derivative transactions, as well as pledged collateral, through a single payment, in a single currency, in the event of a default on, or affecting any, one derivative transaction or a termination event affecting all, or a specified group of, derivative transactions.
LAE Loss Adjustment Expenses The expenses directly attributed to settling and paying claims of insureds and include, but are not limited to, legal fees, adjuster’s fees and the portion of general expenses allocated to claim settlement costs.
Loan-to-value ratio Principal amount of loan amount divided by appraised value of collateral securing the loan.
Loss ratio Losses and loss adjustment expenses incurred divided by net premiums earned.
Loss reserve development The increase or decrease in incurred losses and loss adjustment expenses related to prior years as a result of the re-estimation of loss reserves at successive valuation dates for a given group of claims.
Loss reserves Liability for unpaid losses and loss adjustment expenses. The estimated ultimate cost of settling claims relating to insured events that have occurred on or before the balance sheet date, whether or not reported to the insurer at that date.
Master netting agreement An agreement between two counterparties who have multiple derivative contracts with each other that provides for the net settlement of all contracts covered by such agreement, as well as pledged collateral, through a single payment, in a single currency, in the event of default on or upon termination of any one such contract.
Natural catastrophe losses are generally weather or seismic events having a net impact on AIG in excess of $10 million each and man-made catastrophe losses, such as terrorism and civil disorders that exceed the $10 million threshold.
Net premiums written represent the sales of an insurer, adjusted for reinsurance premiums assumed and ceded, during a given period. Net premiums earned are the revenue of an insurer for covering risk during a given period. Net premiums written are a measure of performance for a sales period, while net premiums earned are a measure of performance for a coverage period.
Noncontrolling interests The portion of equity ownership in a consolidated subsidiary not attributable to the controlling parent company.
Policy fees An amount added to a policy premium, or deducted from a policy cash value or contract holder account, to reflect the cost of issuing a policy, establishing the required records, sending premium notices and other related expenses.
AIG | 2021 Form 10-K 173
Pool A reinsurance arrangement whereby all of the underwriting results of the pool members are combined and then shared by each member in accordance with its pool participation percentage.
Premiums and deposits – Life and Retirement includes direct and assumed amounts received and earned on traditional life insurance policies, group benefit policies and life-contingent payout annuities, as well as deposits received on universal life, investment-type annuity contracts, FHLB funding agreements and mutual funds.
Prior year development See Loss reserve development.
RBC Risk-Based Capital A formula designed to measure the adequacy of an insurer’s statutory surplus compared to the risks inherent in its business.
Reinstatement premiums Additional premiums payable to reinsurers or receivable from insurers to restore coverage limits that have been reduced or exhausted as a result of reinsured losses under certain excess of loss reinsurance contracts.
Reinsurance The practice whereby one insurer, the reinsurer, in consideration of a premium paid to that insurer, agrees to indemnify another insurer, the ceding company, for part or all of the liability of the ceding company under one or more policies or contracts of insurance which it has issued.
Retroactive reinsurance See Deferred gain on retroactive reinsurance.
Return on common equity – Adjusted after-tax income excluding AOCI adjusted for the cumulative unrealized gains and losses related to Fortitude Re funds withheld assets and DTA (Adjusted return on common equity) is a non-GAAP measure and is used to show the rate of return on common shareholders’ equity. Adjusted return on common equity is derived by dividing actual or annualized adjusted after-tax income attributable to AIG common shareholders by average Adjusted Common Shareholders’ Equity.
Return premium represents amounts given back to the insured in the case of a cancellation, an adjustment to the rate or an overpayment of an advance premium.
Solvency II Legislation in the European Union which reforms the insurance industry’s solvency framework, including minimum capital and solvency requirements, governance requirements, risk management and public reporting standards. The Solvency II Directive (2009/138/EEC) was adopted on November 25, 2009 and became effective on January 1, 2016.
Subrogation The amount of recovery for claims we have paid our policyholders, generally from a negligent third party or such party’s insurer.
Surrender charge A charge levied against an investor for the early withdrawal of funds from a life insurance or annuity contract, or for the cancellation of the agreement.
Surrender rate represents annualized surrenders and withdrawals as a percentage of average reserves and Group Retirement mutual fund assets under administration.
Unearned premium reserve Liabilities established by insurers and reinsurers to reflect unearned premiums, which are usually refundable to policyholders if an insurance or reinsurance contract is canceled prior to expiration of the contract term.
VOBA Value of Business Acquired Present value of projected future gross profits from in-force policies of acquired businesses.
174 AIG | 2021 Form 10-K
Acronyms
A&H Accident and Health Insurance | GMWB Guaranteed Minimum Withdrawal Benefits |
ABS Asset-Backed Securities | ISDA International Swaps and Derivatives Association, Inc. |
APTI Adjusted pre-tax income | Moody's Moody's Investors’ Service Inc. |
AUM Assets Under Management | NAIC National Association of Insurance Commissioners |
CDO Collateralized Debt Obligations | NM Not Meaningful |
CDS Credit Default Swap | ORR Obligor Risk Ratings |
CMA Capital Maintenance Agreement | OTC Over-the-Counter |
CMBS Commercial Mortgage-Backed Securities | OTTI Other-Than-Temporary Impairment |
EGPs Estimated Gross Profits | RMBS Residential Mortgage-Backed Securities |
FASB Financial Accounting Standards Board | S&P Standard & Poor’s Financial Services LLC |
FRBNY Federal Reserve Bank of New York | SEC Securities and Exchange Commission |
GAAP Accounting Principles Generally Accepted in the United | URR Unearned Revenue Reserve |
States of America | VIE Variable Interest Entity |
GMDB Guaranteed Minimum Death Benefits |
|
AIG | 2021 Form 10-K 175
ITEM 7A | Quantitative and Qualitative Disclosures about Market Risk
The information required by this item is set forth in the Enterprise Risk Management section of Item 7. Management’s Discussion and Analysis of Financial Condition and Results of Operations and is incorporated herein by reference.
176 AIG | 2021 Form 10-K
Part II
ITEM 8 | Financial Statements and Supplementary Data
American International Group, Inc.
Reference to Financial Statements and Schedules
AIG | 2021 Form 10-K 177
Report of Independent Registered Public Accounting Firm
To the Board of Directors and Shareholders of American International Group, Inc.
Opinions on the Financial Statements and Internal Control over Financial Reporting
We have audited the accompanying consolidated balance sheets of American International Group, Inc. and its subsidiaries (the Company) as of December 31, 2021 and 2020, and the related consolidated statements of income (loss), of comprehensive income (loss), of equity and of cash flows for each of the three years in the period ended December 31, 2021, including the related notes and financial statement schedules listed in the accompanying index (collectively referred to as the “consolidated financial statements”). We also have audited the Company's internal control over financial reporting as of December 31, 2021, based on criteria established in Internal Control - Integrated Framework (2013) issued by the Committee of Sponsoring Organizations of the Treadway Commission (COSO).
In our opinion, the consolidated financial statements referred to above present fairly, in all material respects, the financial position of the Company as of December 31, 2021 and 2020, and the results of its operations and its cash flows for each of the three years in the period ended December 31, 2021 in conformity with accounting principles generally accepted in the United States of America. Also in our opinion, the Company maintained, in all material respects, effective internal control over financial reporting as of December 31, 2021, based on criteria established in Internal Control - Integrated Framework (2013) issued by the COSO.
Basis for Opinions
The Company's management is responsible for these consolidated financial statements, for maintaining effective internal control over financial reporting, and for its assessment of the effectiveness of internal control over financial reporting, included in Management’s Report on Internal Control over Financial Reporting appearing under Item 9A. Our responsibility is to express opinions on the Company’s consolidated financial statements and on the Company's internal control over financial reporting based on our audits. We are a public accounting firm registered with the Public Company Accounting Oversight Board (United States) (PCAOB) and are required to be independent with respect to the Company in accordance with the U.S. federal securities laws and the applicable rules and regulations of the Securities and Exchange Commission and the PCAOB.
We conducted our audits in accordance with the standards of the PCAOB. Those standards require that we plan and perform the audits to obtain reasonable assurance about whether the consolidated financial statements are free of material misstatement, whether due to error or fraud, and whether effective internal control over financial reporting was maintained in all material respects.
Our audits of the consolidated financial statements included performing procedures to assess the risks of material misstatement of the consolidated financial statements, whether due to error or fraud, and performing procedures that respond to those risks. Such procedures included examining, on a test basis, evidence regarding the amounts and disclosures in the consolidated financial statements. Our audits also included evaluating the accounting principles used and significant estimates made by management, as well as evaluating the overall presentation of the consolidated financial statements. Our audit of internal control over financial reporting included obtaining an understanding of internal control over financial reporting, assessing the risk that a material weakness exists, and testing and evaluating the design and operating effectiveness of internal control based on the assessed risk. Our audits also included performing such other procedures as we considered necessary in the circumstances. We believe that our audits provide a reasonable basis for our opinions.
Definition and Limitations of Internal Control over Financial Reporting
A company’s internal control over financial reporting is a process designed to provide reasonable assurance regarding the reliability of financial reporting and the preparation of financial statements for external purposes in accordance with generally accepted accounting principles. A company’s internal control over financial reporting includes those policies and procedures that (i) pertain to the maintenance of records that, in reasonable detail, accurately and fairly reflect the transactions and dispositions of the assets of the company; (ii) provide reasonable assurance that transactions are recorded as necessary to permit preparation of financial statements in accordance with generally accepted accounting principles, and that receipts and expenditures of the company are being made only in accordance with authorizations of management and directors of the company; and (iii) provide reasonable assurance regarding prevention or timely detection of unauthorized acquisition, use, or disposition of the company’s assets that could have a material effect on the financial statements.
Because of its inherent limitations, internal control over financial reporting may not prevent or detect misstatements. Also, projections of any evaluation of effectiveness to future periods are subject to the risk that controls may become inadequate because of changes in conditions, or that the degree of compliance with the policies or procedures may deteriorate.
Critical Audit Matters
The critical audit matters communicated below are matters arising from the current period audit of the consolidated financial statements that were communicated or required to be communicated to the audit committee and that (i) relate to accounts or disclosures that are material to the consolidated financial statements and (ii) involved our especially challenging, subjective, or complex judgments. The communication of critical audit matters does not alter in any way our opinion on the consolidated financial statements, taken as a whole, and we are not, by communicating the critical audit matters below, providing separate opinions on the critical audit matters or on the accounts or disclosures to which they relate.
178 AIG | 2021 Form 10-K
Valuation of Certain Level 3 Fixed Maturity Securities
As described in Note 4 to the consolidated financial statements, as of December 31, 2021, the total fair value of the Company’s level 3 fixed maturity securities, including bonds available for sale and other bond securities, was $29.6 billion, comprised of residential mortgage backed securities, commercial mortgage backed securities, collateralized debt obligations, other asset-backed securities, and fixed maturity securities issued by corporations (including private placements), states, municipalities, and other governmental agencies. As the volume or level of market activity for these securities is limited, management determines fair value either by requesting brokers who are knowledgeable about the particular security to provide a price quote, which according to management is generally non-binding, or by employing market accepted valuation models. In both cases, certain inputs used by management to determine fair value may not be observable in the market. For certain private placement securities, fair value is determined by management based on discounted cash flow models using discount rates based on credit spreads, yields or price levels of comparable securities, adjusted for illiquidity and structure. For other level 3 fixed maturity securities, such assumptions may include loan delinquencies and defaults, loss severity, and prepayments. As disclosed by management, fair value estimates are subject to management review to ensure valuation models and related inputs are reasonable.
The principal considerations for our determination that performing procedures relating to the valuation of certain level 3 fixed maturity securities is a critical audit matter are (i) the significant judgment by management to determine the fair value of these securities, which in turn led to a high degree of auditor subjectivity and judgment in performing the audit procedures relating to the aforementioned assumptions that are used to determine the fair value, (ii) the significant audit effort and judgment in evaluating the audit evidence related to the valuation, and (iii) the audit effort involved the use of professionals with specialized skill and knowledge.
Addressing the matter involved performing procedures and evaluating audit evidence in connection with forming our overall opinion on the consolidated financial statements. These procedures included testing the effectiveness of controls relating to the valuation of level 3 fixed maturity securities, including controls related to (i) management’s review over the pricing function and (ii) identifying and resolving pricing exceptions. These procedures also included, among others, obtaining independent third party vendor pricing, where available, and the involvement of professionals with specialized skill and knowledge to assist in developing an independent range of prices for a sample of securities. Developing the independent range of prices involved testing the completeness and accuracy of data provided by management on a sample basis and evaluating management’s assumptions noted above. The independent third party vendor pricing and the independently developed ranges were compared to management’s recorded fair value estimates.
Valuation of Insurance Liabilities - Unpaid Losses and Loss Adjustment Expenses (Loss Reserves), Net of Reinsurance
As described in Note 12 to the consolidated financial statements, loss reserves represent the accumulation of estimates of unpaid claims, including estimates for claims incurred but not reported and loss adjustment expenses, less applicable discount. As of December 31, 2021, the Company’s net liability for unpaid losses and loss adjustment expenses was $43.8 billion. As disclosed by management, the estimate of the loss reserves relies on several key judgments, including (i) actuarial methods, (ii) relative weights given to these methods by product line, (iii) underlying actuarial assumptions, and (iv) groupings of similar product lines. Actuarial assumptions include (i) expected loss ratios and (ii) loss development factors. During management’s actuarial reviews, various factors are considered, including economic conditions; the legal, regulatory, judicial and social environment; medical cost trends; policy pricing, terms and conditions; changes in the claims handling process; and the impact of reinsurance. As described in Note 12 to the consolidated financial statements, management uses a combination of actuarial methods to project ultimate losses for both long-tail and short-tail exposures.
The principal considerations for our determination that performing procedures relating to the valuation of insurance liabilities - loss reserves, net of reinsurance is a critical audit matter are (i) the significant judgment by management when developing their estimate, which in turn led to a high degree of auditor subjectivity and judgment in performing the audit procedures related to the estimate, (ii) the significant audit effort and judgment in evaluating the audit evidence related to the actuarial methods, weights given to these methods by product line, groupings of similar product lines, and the aforementioned actuarial assumptions, and (iii) the audit effort involved the use of professionals with specialized skill and knowledge.
Addressing the matter involved performing procedures and evaluating audit evidence in connection with forming our overall opinion on the consolidated financial statements. These procedures included testing the effectiveness of controls relating to the valuation of the net liability for unpaid losses and loss adjustment expense, including controls over the selection of actuarial methods and development of significant assumptions, as well as controls designed to identify and address management bias and contrary evidence. These procedures also included, among others, the involvement of professionals with specialized skill and knowledge to assist in performing one or a combination of procedures for a sample of product lines, including (i) independently estimating reserves using actual historical data and loss development patterns, as well as industry data and other benchmarks, and comparing management’s actuarially determined reserves to these independent estimates and (ii) evaluating management’s actuarial reserving methods and aforementioned factors, including actuarial assumptions and judgments impacting loss reserves and the consistency of management’s approach period-over-period. Performing these procedures involved testing the completeness and accuracy of data used by management on a sample basis.
AIG | 2021 Form 10-K 179
Valuation of Embedded Derivatives for Variable Annuity and Fixed Index Annuity Products and Valuation of Certain Guaranteed Benefit Features for Universal Life Products
As described in Notes 4 and 13 to the consolidated financial statements, certain fixed index annuity and variable annuity contracts contain embedded derivatives that are bifurcated from the host contracts and accounted for separately at fair value in policyholder contract deposits. As of December 31, 2021, the fair value of these embedded derivatives was $6.4 billion and $2.5 billion for fixed index annuity and variable annuities with guaranteed minimum withdrawal benefits, respectively. The fair value of embedded derivatives contained in certain variable annuity and fixed index annuity contracts is measured based on policyholder behavior and capital market assumptions related to projected cash flows over the expected lives of the contracts. The policyholder behavior assumptions for these liabilities include mortality, lapses, withdrawals, and benefit utilization, along with an explicit risk margin to reflect a market participant’s estimates of projected cash flows. Estimates of future policyholder behavior assumptions are subjective and based primarily on the Company’s historical experience. The capital market assumptions related to the embedded derivatives for variable annuity contracts involve judgments regarding expected market rates of return, market volatility, credit spreads, correlations of certain market variables, fund performance, and discount rates. Unobservable inputs used for valuing the embedded derivative include long-term equity volatilities which represent the volatility beyond the period for which observable equity volatilities are available. With respect to embedded derivatives for fixed index annuity contracts, option pricing models are used to estimate fair value, taking into account the capital market assumptions. Such models use option budget assumptions which estimate the expected long-term cost of options used to hedge exposures associated with equity price changes. The option budget determines the future costs of the options, which impacts the growth in account value and the valuation of embedded derivatives. Additional policyholder liabilities are also established for universal life policies with secondary guarantees, as well as other universal life policies for which profits followed by losses are expected at contract inception. As of December 31, 2021, the liability for universal life secondary guarantees and similar features was $4.5 billion, which is included within future policy benefits. The policyholder behavior assumptions for these liabilities include mortality, lapses and premium persistency. The capital market assumptions used for the liability for universal life secondary guarantees include discount rates and net earned rates.
The principal considerations for our determination that performing procedures relating to the valuation of embedded derivatives for variable annuity and fixed index annuity products and valuation of certain guaranteed benefit features for universal life products is a critical audit matter are (i) the significant judgment by management in developing the aforementioned policyholder behavior assumptions, as well as long-term equity volatilities and option budget assumptions, which in turn led to a high degree of auditor subjectivity and judgment in performing the audit procedures related to the significant assumptions used in the estimate, (ii) the significant audit effort and judgment in evaluating the audit evidence relating to the significant assumptions used by management in the valuation of the embedded derivatives and additional policyholder liabilities, and (iii) the audit effort involved the use of professionals with specialized skill and knowledge.
Addressing the matter involved performing procedures and evaluating audit evidence in connection with forming our overall opinion on the consolidated financial statements. These procedures included testing the effectiveness of controls relating to the development of assumptions used in the valuation of embedded derivatives for variable annuity and fixed index annuity products and valuation of certain guaranteed benefit features for universal life products. These procedures also included, among others, the involvement of professionals with specialized skill and knowledge to assist in performing an evaluation of the appropriateness of management’s methodology and the reasonableness of management’s judgments used in developing policyholder behavior, as well as long-term volatilities and option budget assumptions used in estimating the valuation of guaranteed benefit features. These procedures considered the consistency of the assumptions across products, in relation to prior periods, and in relation to management’s historical experience or observed industry practice, and the continued appropriateness of unchanged assumptions. Procedures were performed to test the completeness and accuracy of data used by management on a sample basis.
Valuation of Deferred Policy Acquisition Costs for Universal Life and Individual Retirement Variable Annuity Products
As described in Note 8 to the consolidated financial statements, as of December 31, 2021, a portion of the $5.8 billion deferred policy acquisition costs (DAC) for investment-oriented products are associated with universal life and individual retirement variable annuity products. Policy acquisition costs and policy issuance costs related to investment-oriented products are deferred and amortized, with interest, in relation to the incidence of estimated gross profits to be realized over the estimated lives of the contracts. Estimated gross profits are affected by a number of factors, including current and expected interest rates, net investment income and spreads, net realized gains and losses, fees, surrender rates, mortality experience, policyholder behavior experience, equity market returns, and volatility. If the assumptions used for estimated gross profits change, DAC is recalculated using the new assumptions, including actuarial assumptions related to mortality, lapse, benefit utilization, and premium persistency, and any resulting adjustment is included in income. DAC for investment-oriented products is reviewed by management for recoverability, which involves estimating the future profitability of the current business. If actual profitability is substantially lower than previously estimated profitability, DAC may be subject to an impairment charge.
The principal considerations for our determination that performing procedures relating to the valuation of DAC for universal life and individual retirement variable annuity products is a critical audit matter are (i) the significant judgment by management to determine the policyholder behavior assumptions related to mortality, lapse, benefit utilization, and premium persistency, which in turn led to a high degree of auditor subjectivity and judgment in performing the audit procedures related to the significant assumptions used in the estimate, (ii) the significant audit effort and judgment in evaluating the audit evidence relating to management’s policyholder behavior assumptions, and (iii) the audit effort involved the use of professionals with specialized skill and knowledge.
Addressing the matter involved performing procedures and evaluating audit evidence in connection with forming our overall opinion on the consolidated financial statements. These procedures included testing the effectiveness of controls relating to the amortization and recoverability of DAC for universal life and individual retirement variable annuity products, including controls over the development of significant assumptions. These procedures also included, among others, the involvement of professionals with specialized skill and knowledge to assist in evaluating the appropriateness of management’s methodology and the reasonableness of management’s policyholder behavior assumptions related to mortality, lapse, benefit utilization, and premium persistency, which are used in the calculation of estimated gross profits. The evaluation of the reasonableness of the assumptions included consideration of the consistency of the assumptions across products in relation to prior periods and in relation to management’s historical experience or observed industry practice. Procedures were performed to test the completeness and accuracy of data used by management in developing the assumptions on a sample basis.
180 AIG | 2021 Form 10-K
Recoverability of U.S. Federal Deferred Tax Asset
As described in Note 21 to the consolidated financial statements, as of December 31, 2021, the Company had a net U.S. federal deferred tax asset of $11.0 billion, $6.1 billion of which related to federal U.S. tax attributes with a limited carryforward period. Management evaluates the recoverability of the deferred tax asset and the need for a valuation allowance based on the weight of all positive and negative evidence to reach a conclusion of whether it is more likely than not that all or some portion of the deferred tax asset will not be realized. As disclosed by management, in assessing the recoverability of the deferred tax asset, management considers a number of factors, which include forecasts of future income for each of the businesses and actual and planned business and operational changes, using assumptions about future macroeconomic and company specific conditions and events. Management subjects the forecasts to changes in key assumptions and evaluates the effect on tax attribute utilization, including tax attribute carryforward periods. Management also applies changes to assumptions about the effectiveness of relevant prudent and feasible tax planning strategies. As of December 31, 2021, management determined that it is no longer more-likely-than-not that $850 million of the Company’s deferred tax assets related to tax attribute carryforwards will be utilized prior to expiration.
The principal considerations for our determination that performing procedures relating to the recoverability of the U.S. federal deferred tax asset is a critical audit matter are (i) the significant judgment by management when developing their estimate of the recoverability, which in turn led to a high degree of auditor subjectivity and judgment in performing the audit procedures relating to the forecasts of future income for each of the businesses, assumptions about future macroeconomic and company specific conditions and events, tax attribute carryforward periods, and tax planning strategies, (ii) the significant audit effort and judgment in evaluating the audit evidence related to the recoverability of the U.S. federal deferred tax asset, and (iii) the audit effort involved the use of professionals with specialized skill and knowledge.
Addressing the matter involved performing procedures and evaluating audit evidence in connection with forming our overall opinion on the consolidated financial statements. These procedures included testing the effectiveness of controls relating to the recoverability of the U.S. federal deferred tax asset, including controls over the accuracy of input data relevant to the analysis, such as cumulative income/loss measurement, reversal of temporary differences, adjustments to forecasted pre-tax income to calculate future taxable income, impacts of tax audits, and enacted and effective tax law considerations. These procedures also included, among others, the involvement of professionals with specialized skill and knowledge to assist in (i) evaluating management’s assessment of the recoverability of the U.S. federal deferred tax asset and the need for a valuation allowance, including the reasonableness of the application of tax law, (ii) testing management’s process for forecasting future income for each of the businesses, which included evaluating the impact of actual and planned business and operational changes, the reasonableness of assumptions about future macroeconomic and company specific conditions and events, impacts of tax audits, as well as considering whether management demonstrated their ability and intent in executing planned strategies, (iii) testing the tax attribute carryforward periods, and (iv) evaluating the prudence and feasibility of the implementation of available tax planning strategies that impact the recoverability of the U.S. federal deferred tax asset.
/s/
February 17, 2022
We have served as the Company’s auditor since 1980.
AIG | 2021 Form 10-K 181
American International Group, Inc.
Consolidated Balance Sheets
| December 31, | December 31, | ||
(in millions, except for share data) |
| 2021 |
| 2020 |
Assets: |
|
|
|
|
Investments: |
|
|
|
|
Fixed maturity securities: |
|
|
|
|
Bonds available for sale, at fair value, net of allowance for credit losses of $ |
|
|
|
|
(amortized cost: 2021 - $ | $ | $ | ||
Other bond securities, at fair value (See Note 5)* |
|
| ||
Equity securities, at fair value (See Note 5)* |
|
| ||
Mortgage and other loans receivable, net of allowance for credit losses of $ |
|
| ||
Other invested assets (portion measured at fair value: 2021 - $ |
|
| ||
Short-term investments, including restricted cash of $ |
|
|
|
|
(portion measured at fair value: 2021 - $ |
|
| ||
Total investments |
|
| ||
|
|
|
|
|
Cash* |
|
| ||
Accrued investment income* |
|
| ||
Premiums and other receivables, net of allowance for credit losses and disputes of $ |
|
| ||
Reinsurance assets - Fortitude Re, net of allowance for credit losses and disputes of $ |
|
| ||
Reinsurance assets - other, net of allowance for credit losses and disputes of $ |
|
| ||
Deferred income taxes |
|
| ||
Deferred policy acquisition costs |
|
| ||
Other assets, net of allowance for credit losses of $ |
|
|
|
|
and $ |
|
| ||
Separate account assets, at fair value |
|
| ||
Total assets | $ | $ | ||
Liabilities: |
|
|
|
|
Liability for unpaid losses and loss adjustment expenses, including allowance for credit losses of $ | $ | $ | ||
Unearned premiums |
|
| ||
Future policy benefits for life and accident and health insurance contracts |
|
| ||
Policyholder contract deposits (portion measured at fair value: 2021 - $ |
|
| ||
Other policyholder funds |
|
| ||
Fortitude Re funds withheld payable (portion measured at fair value: 2021 - $ |
|
| ||
Other liabilities (portion measured at fair value: 2021 - $ |
|
| ||
Long-term debt (portion measured at fair value: 2021 - $ |
|
| ||
Debt of consolidated investment entities* |
|
| ||
Separate account liabilities |
|
| ||
Total liabilities |
|
| ||
Contingencies, commitments and guarantees (See Note 15) |
|
| ||
|
|
|
|
|
AIG shareholders’ equity: |
|
|
|
|
Series A non-cumulative preferred stock and additional paid in capital, $ |
|
|
|
|
authorized; shares issued: 2021 - |
|
| ||
Common stock, $ |
|
|
|
|
2020 - |
|
| ||
Treasury stock, at cost; 2021 - |
| ( |
| ( |
Additional paid-in capital |
|
| ||
Retained earnings |
|
| ||
Accumulated other comprehensive income |
|
| ||
Total AIG shareholders’ equity |
|
| ||
Non-redeemable noncontrolling interests |
|
| ||
Total equity |
|
| ||
Total liabilities and equity | $ | $ | ||
*
See accompanying Notes to Consolidated Financial Statements.
182 AIG | 2021 Form 10-K
American International Group, Inc.
Consolidated Statements of Income (Loss)
| Years Ended December 31, | ||||||
(dollars in millions, except per common share data) |
| 2021 |
|
| 2020 |
| 2019 |
Revenues: |
|
|
|
|
|
|
|
Premiums | $ |
| $ | $ | |||
Policy fees |
|
|
|
| |||
Net investment income: |
|
|
|
|
|
|
|
Net investment income - excluding Fortitude Re funds withheld assets |
|
|
|
| |||
Net investment income - Fortitude Re funds withheld assets |
|
|
|
| |||
Total net investment income |
|
|
|
| |||
Net realized gains (losses): |
|
|
|
|
|
|
|
Net realized gains (losses) - excluding Fortitude Re funds withheld |
|
|
|
|
|
|
|
assets and embedded derivative |
|
|
| ( |
| ||
Net realized gains on Fortitude Re funds withheld assets |
|
|
|
| |||
Net realized losses on Fortitude Re funds withheld embedded derivative |
| ( |
|
| ( |
| |
Total net realized gains (losses) |
|
|
| ( |
| ||
Other income |
|
|
|
| |||
Total revenues |
|
|
|
| |||
Benefits, losses and expenses: |
|
|
|
|
|
|
|
Policyholder benefits and losses incurred |
|
|
|
| |||
Interest credited to policyholder account balances |
|
|
|
| |||
Amortization of deferred policy acquisition costs |
|
|
|
| |||
General operating and other expenses |
|
|
|
| |||
Interest expense |
|
|
|
| |||
Loss on extinguishment of debt |
|
|
|
| |||
Net (gain) loss on divestitures |
| ( |
|
|
| ||
Total benefits, losses and expenses |
|
|
|
| |||
Income (loss) from continuing operations before income tax expense (benefit) |
|
|
| ( |
| ||
Income tax expense (benefit): |
|
|
|
|
|
|
|
Current |
| ( |
|
|
| ||
Deferred |
|
|
| ( |
| ||
Income tax expense (benefit) |
|
|
| ( |
| ||
Income (loss) from continuing operations |
|
|
| ( |
| ||
Income from discontinued operations, net of income taxes |
|
|
|
| |||
Net income (loss) |
|
|
| ( |
| ||
Less: |
|
|
|
|
|
|
|
Net income from continuing operations attributable to noncontrolling interests |
|
|
|
| |||
Net income (loss) attributable to AIG |
|
|
| ( |
| ||
Less: Dividends on preferred stock |
|
|
|
| |||
Net income (loss) attributable to AIG common shareholders | $ |
| $ | ( | $ | ||
|
|
|
|
|
|
|
|
Income (loss) per common share attributable to AIG common shareholders: |
|
|
|
|
|
|
|
Basic: |
|
|
|
|
|
|
|
Income (loss) from continuing operations | $ |
| $ | ( | $ | ||
Income (loss) from discontinued operations | $ |
| $ | $ | |||
Net income (loss) attributable to AIG common shareholders | $ |
| $ | ( | $ | ||
Diluted: |
|
|
|
|
|
|
|
Income (loss) from continuing operations | $ |
| $ | ( | $ | ||
Income (loss) from discontinued operations | $ |
| $ | $ | |||
Net income (loss) attributable to AIG common shareholders | $ |
| $ | ( | $ | ||
Weighted average shares outstanding: |
|
|
|
|
|
|
|
Basic |
|
|
|
| |||
Diluted |
|
|
|
| |||
See accompanying Notes to Consolidated Financial Statements.
AIG | 2021 Form 10-K 183
American International Group, Inc.
Consolidated Statements of Comprehensive Income (Loss)
| Years Ended December 31, | ||||||
(in millions) |
| 2021 |
|
| 2020 |
| 2019 |
Net income (loss) | $ |
| $ | ( | $ | ||
Other comprehensive income (loss), net of tax |
|
|
|
|
|
|
|
Change in unrealized appreciation (depreciation) of fixed maturity securities on |
|
|
|
|
|
|
|
which allowance for credit losses was taken |
|
|
| ( |
| ||
Change in unrealized appreciation of fixed maturity securities on |
|
|
|
|
|
|
|
which other-than-temporary credit impairments were taken |
|
|
|
| |||
Change in unrealized appreciation (depreciation) of all other investments |
| ( |
|
|
| ||
Change in foreign currency translation adjustments |
| ( |
|
|
| ||
Change in retirement plan liabilities adjustment |
|
|
| ( |
| ( | |
Change in fair value of liabilities under fair value option attributable to changes in own credit risk |
| ( |
|
|
| ( | |
Other comprehensive income (loss) |
| ( |
|
|
| ||
Comprehensive income |
|
|
|
| |||
Comprehensive income attributable to noncontrolling interests |
|
|
|
| |||
Comprehensive income attributable to AIG | $ |
| $ | $ | |||
|
|
|
|
|
|
|
|
See accompanying Notes to Consolidated Financial Statements. |
|
| |||||
184 AIG | 2021 Form 10-K
American International Group, Inc.
Consolidated Statements of Equity
|
| Preferred |
|
|
|
|
|
|
|
|
|
|
|
|
| Non- |
|
|
| Stock and |
|
|
|
|
|
|
|
|
| Accumulated |
| Total AIG |
| redeemable |
|
| |
| Additional |
|
|
|
|
| Additional |
|
|
| Other |
| Share- |
| Non- |
|
| |
|
| Paid-in |
| Common |
| Treasury |
| Paid-in |
| Retained | Comprehensive |
| holders' |
| controlling |
| Total | |
(in millions) |
| Capital |
| Stock |
| Stock |
| Capital |
| Earnings | Income (Loss) |
| Equity |
| Interests |
| Equity | |
Balance, January 1, 2019 | $ | $ | $ | ( | $ | $ | $ | ( | $ | $ | $ | |||||||
Preferred stock issued |
|
|
|
|
|
|
|
|
| |||||||||
Common stock issued under stock plans |
|
|
|
| ( |
|
|
| ( |
|
| ( | ||||||
Net income attributable to AIG or |
|
|
|
|
|
|
|
|
|
|
|
|
|
|
|
|
|
|
noncontrolling interests |
|
|
|
|
|
|
|
|
| |||||||||
Dividends on preferred stock |
|
|
|
|
| ( |
|
| ( |
|
| ( | ||||||
Dividends on common stock |
|
|
|
|
| ( |
|
| ( |
|
| ( | ||||||
Other comprehensive income |
|
|
|
|
|
|
|
|
| |||||||||
Net increase due to divestitures |
|
|
|
|
|
|
|
|
|
|
|
|
|
|
|
|
|
|
and acquisitions |
|
|
|
|
|
|
|
|
| |||||||||
Contributions from noncontrolling interests |
|
|
|
|
|
|
|
|
| |||||||||
Distributions to noncontrolling interests |
|
|
|
|
|
|
|
| ( |
| ( | |||||||
Other |
|
|
|
|
| ( |
|
|
|
| ||||||||
Balance, December 31, 2019 | $ | $ | $ | ( | $ | $ | $ | $ | $ | $ | ||||||||
Cumulative effect of change in accounting |
|
|
|
|
|
|
|
|
|
|
|
|
|
|
|
|
|
|
principle, net of tax |
|
|
|
|
| ( |
|
| ( |
|
| ( | ||||||
Common stock issued under stock plans |
|
|
|
| ( |
|
|
| ( |
|
| ( | ||||||
Purchase of common stock |
|
|
| ( |
|
|
|
| ( |
|
| ( | ||||||
Net income (loss) attributable to AIG or |
|
|
|
|
|
|
|
|
|
|
|
|
|
|
|
|
|
|
noncontrolling interests |
|
|
|
|
| ( |
|
| ( |
|
| ( | ||||||
Dividends on preferred stock |
|
|
|
|
| ( |
|
| ( |
|
| ( | ||||||
Dividends on common stock |
|
|
|
|
| ( |
|
| ( |
|
| ( | ||||||
Other comprehensive income (loss) |
|
|
|
|
|
|
|
| ( |
| ||||||||
Net decrease due to divestitures |
|
|
|
|
|
|
|
|
|
|
|
|
|
|
|
|
|
|
and acquisitions |
|
|
|
|
|
|
|
| ( |
| ( | |||||||
Contributions from noncontrolling interests |
|
|
|
|
|
|
|
|
| |||||||||
Distributions to noncontrolling interests |
|
|
|
|
|
|
|
| ( |
| ( | |||||||
Other |
|
|
| ( |
|
| ( |
|
|
| ( |
| ||||||
Balance, December 31, 2020 | $ | $ | $ | ( | $ | $ | $ | $ | $ | $ | ||||||||
Common stock issued under stock plans |
|
|
|
| ( |
|
|
| ( |
|
| ( | ||||||
Purchase of common stock |
|
|
| ( |
| ( |
|
|
| ( |
|
| ( | |||||
Net income attributable to AIG or |
|
|
|
|
|
|
|
|
|
|
|
|
|
|
|
|
|
|
noncontrolling interests |
|
|
|
|
|
|
|
|
| |||||||||
Dividends on preferred stock |
|
|
|
|
| ( |
|
| ( |
|
| ( | ||||||
Dividends on common stock |
|
|
|
|
| ( |
|
| ( |
|
| ( | ||||||
Other comprehensive loss |
|
|
|
|
|
| ( |
| ( |
| ( |
| ( | |||||
Net increase due to divestitures |
|
|
|
|
|
|
|
|
|
|
|
|
|
|
|
|
|
|
and acquisitions |
|
|
|
|
|
| ( |
| ( |
|
| |||||||
Contributions from noncontrolling interests |
|
|
|
|
|
|
|
|
| |||||||||
Distributions to noncontrolling interests |
|
|
|
|
|
|
|
| ( |
| ( | |||||||
Other |
|
|
|
|
|
|
|
|
| |||||||||
Balance, December 31, 2021 | $ | $ | $ | ( | $ | $ | $ | $ | $ | $ | ||||||||
See accompanying Notes to Consolidated Financial Statements.
AIG | 2021 Form 10-K 185
American International Group, Inc.
Consolidated Statements of Cash Flows
| Years Ended December 31, | |||||
(in millions) |
| 2021 |
| 2020 |
| 2019 |
Cash flows from operating activities: |
|
|
|
|
|
|
Net income (loss) | $ | $ | ( | $ | ||
Income from discontinued operations |
|
| ( |
| ( | |
Adjustments to reconcile net income (loss) to net cash provided by (used in) operating activities: |
|
|
|
|
| |
Noncash revenues, expenses, gains and losses included in income (loss): |
|
|
|
|
|
|
Net gains on sales of securities available for sale and other assets |
| ( |
| ( |
| ( |
Net (gain) loss on divestitures |
| ( |
|
| ||
Losses on extinguishment of debt |
|
|
| |||
Unrealized gains in earnings - net |
| ( |
| ( |
| ( |
Equity in loss from equity method investments, net of dividends or distributions |
|
|
| |||
Depreciation and other amortization |
|
|
| |||
Impairments of assets |
|
|
| |||
Changes in operating assets and liabilities: |
|
|
|
|
|
|
Insurance reserves |
|
|
| ( | ||
Premiums and other receivables and payables - net |
| ( |
|
| ||
Reinsurance assets, net |
| ( |
| ( |
| |
Capitalization of deferred policy acquisition costs |
| ( |
| ( |
| ( |
Current and deferred income taxes - net |
|
| ( |
| ||
Other, net |
| ( |
|
| ( | |
Total adjustments |
| ( |
|
| ( | |
Net cash provided by (used in) operating activities |
|
|
| ( | ||
Cash flows from investing activities: |
|
|
|
|
|
|
Proceeds from (payments for) |
|
|
|
|
|
|
Sales or distributions of: |
|
|
|
|
|
|
Available for sale securities |
|
|
| |||
Other securities |
|
|
| |||
Other invested assets |
|
|
| |||
Divestitures, net |
|
|
| |||
Maturities of fixed maturity securities available for sale |
|
|
| |||
Principal payments received on and sales of mortgage and other loans receivable |
|
|
| |||
Purchases of: |
|
|
|
|
|
|
Available for sale securities |
| ( |
| ( |
| ( |
Other securities |
| ( |
| ( |
| ( |
Other invested assets |
| ( |
| ( |
| ( |
Mortgage and other loans receivable |
| ( |
| ( |
| ( |
Net change in short-term investments |
|
| ( |
| ( | |
Other, net |
| ( |
|
| ||
Net cash used in investing activities |
| ( |
| ( |
| ( |
Cash flows from financing activities: |
|
|
|
|
|
|
Proceeds from (payments for) |
|
|
|
|
|
|
Policyholder contract deposits |
|
|
| |||
Policyholder contract withdrawals |
| ( |
| ( |
| ( |
Issuance of long-term debt |
|
|
| |||
Issuance of debt of consolidated investment entities |
|
|
| |||
Repayments of long-term debt |
| ( |
| ( |
| ( |
Repayments of debt of consolidated investment entities |
| ( |
| ( |
| ( |
Issuance of preferred stock, net of issuance costs |
|
|
| |||
Purchase of common stock |
| ( |
| ( |
| |
Dividends paid on preferred stock |
| ( |
| ( |
| ( |
Dividends paid on common stock |
| ( |
| ( |
| ( |
Other, net |
|
|
| |||
Net cash provided by (used in) financing activities |
| ( |
|
| ||
Effect of exchange rate changes on cash and restricted cash |
| ( |
|
| ||
Net decrease in cash and restricted cash |
| ( |
| ( |
| ( |
Cash and restricted cash at beginning of year |
|
|
| |||
Change in cash of held for sale assets |
|
|
| ( | ||
Cash and restricted cash at end of year | $ | $ | $ | |||
186 AIG | 2021 Form 10-K
American International Group, Inc.
Consolidated Statements of Cash Flows (continued)
Supplementary Disclosure of Consolidated Cash Flow Information |
|
|
|
|
|
|
| Years Ended December 31, | |||||
(in millions) |
| 2021 |
| 2020 |
| 2019 |
Cash | $ | $ | $ | |||
Restricted cash included in Short-term investments* |
|
|
| |||
Restricted cash included in Other assets* |
|
|
| |||
Total cash and restricted cash shown in the Consolidated Statements of Cash Flows | $ | $ | $ | |||
|
|
|
|
|
|
|
Cash paid during the period for: |
|
|
|
|
|
|
Interest | $ | $ | $ | |||
Taxes | $ | $ | $ | |||
Non-cash investing activities: |
|
|
|
|
|
|
Fixed maturity securities available for sale received in connection with pension risk |
|
|
|
|
|
|
transfer transactions | $ | $ | $ | |||
Fixed maturity securities received in connection with reinsurance transactions | $ | $ | $ | |||
Fixed maturity securities transferred in connection with reinsurance transactions | $ | ( | $ | ( | $ | |
Non-cash financing activities: |
|
|
|
|
|
|
Interest credited to policyholder contract deposits included in financing activities | $ | $ | $ | |||
Fee income debited to policyholder contract deposits included in financing activities | $ | ( | $ | ( | $ | ( |
* Includes funds held for tax sharing payments to AIG Parent, security deposits, and replacement reserve deposits related to real estate investments.
See accompanying Notes to Consolidated Financial Statements.
AIG | 2021 Form 10-K 187
1. Basis of Presentation
American International Group, Inc. (AIG) is a leading global insurance organization serving customers in approximately
The consolidated financial statements include the accounts of AIG Parent, our controlled subsidiaries (generally through a greater than 50 percent ownership of voting rights and voting interests), and variable interest entities (VIEs) of which we are the primary beneficiary. Equity investments in entities that we do not consolidate, including corporate entities in which we have significant influence and partnership and partnership-like entities in which we have more than minor influence over the operating and financial policies, are accounted for under the equity method unless we have elected the fair value option.
Certain of our foreign subsidiaries included in the Consolidated Financial Statements report on the basis of a fiscal year ending November 30. The effect on our consolidated financial condition and results of operations of all material events occurring at these subsidiaries through the date of each of the periods presented in these Consolidated Financial Statements has been considered for adjustment and/or disclosure.
The accompanying consolidated financial statements have been prepared in accordance with accounting principles generally accepted in the United States (U.S. GAAP). All material intercompany accounts and transactions have been eliminated.
Sales/disposals of ASSETS AND Businesses
Separation of Life and Retirement Business and Relationship with Blackstone Inc.
On October 26, 2020, AIG announced its intention to separate its Life and Retirement business from AIG. On November 2, 2021, AIG and Blackstone Inc. (Blackstone) completed the acquisition by Blackstone of a
For additional information on the sale of SAFG to Blackstone see Note 16.
188 AIG | 2021 Form 10-K
On December 15, 2021, AIG and Blackstone Real Estate Income Trust (BREIT), a long-term, perpetual capital vehicle affiliated with Blackstone, completed the acquisition by BREIT of AIG’s interests in a U.S. affordable housing portfolio for $
Sale of Certain AIG Life and Retirement Retail Mutual Funds Business
On February 8, 2021, AIG announced the execution of a definitive agreement with Touchstone Investments (Touchstone), an indirect wholly-owned subsidiary of Western & Southern Financial Group, to sell certain assets of Life and Retirement’s Retail Mutual Funds business. This sale consisted of the reorganization of
Fortitude Holdings
On June 2, 2020, we completed the sale of a majority of the interests in Fortitude Group Holdings, LLC (Fortitude Holdings) to Carlyle FRL, L.P. (Carlyle FRL), an investment fund advised by an affiliate of The Carlyle Group Inc. (Carlyle), and T&D United Capital Co., Ltd. (T&D), a subsidiary of T&D Holdings, Inc., under the terms of a membership interest purchase agreement entered into on November 25, 2019 (the Purchase Agreement) by and among AIG, Fortitude Holdings, Carlyle FRL, Carlyle, T&D and T&D Holdings, Inc. (the Majority Interest Fortitude Sale). AIG established Fortitude Reinsurance Company Ltd. (Fortitude Re), a wholly owned subsidiary of Fortitude Holdings, in 2018 in a series of reinsurance transactions related to AIG’s Run-Off operations. As of December 31, 2021, approximately $
AIG sold a
AIG recorded a total after-tax reduction to total AIG shareholders’ equity of $
AIG | 2021 Form 10-K 189
In connection with the Majority Interest Fortitude Sale, AIG, Fortitude Holdings, and TCG agreed that, effective as of the closing, (i) AIG’s investment commitment targets under the 2018 Fortitude Sale (whereby AIG had agreed to invest certain amounts into various Carlyle strategies and to make certain minimum investment management fee payments by November 2021) were assumed by Fortitude Holdings and AIG was released therefrom, (ii) the purchase price adjustment that AIG had agreed to provide TCG in the 2018 Fortitude Sale (whereby AIG had agreed to reimburse TCG for adverse development in property casualty related reserves, based on an agreed methodology, that may occur through December 31, 2023, up to the value of TCG’s investment in Fortitude Holdings) has been terminated, and (iii) TCG remains obligated to pay AIG $
Following closing, in the second quarter of 2020, AIG contributed $
For additional information on the sale of Fortitude Holdings see Note 7.
Blackboard
At the end of March 2020, Blackboard U.S. Holdings, Inc. (Blackboard), AIG’s technology-driven subsidiary, was placed into run-off. As a result of this decision, during the year ended December 31, 2020, AIG recognized a pre-tax loss of $
Use of Estimates
The preparation of financial statements in accordance with U.S. GAAP requires the application of accounting policies that often involve a significant degree of judgment. Accounting policies that we believe are most dependent on the application of estimates and assumptions are considered our critical accounting estimates and are related to the determination of:
loss reserves;
future policy benefit reserves for life and accident and health insurance contracts;
liabilities for guaranteed benefit features of variable annuity, fixed annuity and fixed index annuity products;
embedded derivative liabilities for fixed index annuity and life products;
estimated gross profits to value deferred acquisition costs and unearned revenue for investment-oriented products;
reinsurance assets, including the allowance for credit losses and disputes;
goodwill impairment;
allowance for credit losses on certain investments, primarily on loans and available for sale fixed maturity securities;
legal contingencies;
fair value measurements of certain financial assets and financial liabilities; and
income taxes, in particular the recoverability of our deferred tax asset and establishment of provisions for uncertain tax positions.
These accounting estimates require the use of assumptions about matters, some of which are highly uncertain at the time of estimation. To the extent actual experience differs from the assumptions used, our consolidated financial condition, results of operations and cash flows could be materially affected.
190 AIG | 2021 Form 10-K
REVISION OF PRIOR PERIOD FINANCIAL STATEMENTS
In the third quarter of 2021, we identified misclassifications related to the balance sheet presentation of certain of our universal life and variable annuity products which resulted in an overstatement of Policyholder contract deposits and an understatement of Future policyholder benefits for life and accident and health insurance contracts. These balance sheet-only items had no impact to total liabilities reported, the Consolidated Statements of Income (Loss) or the Consolidated Statements of Cash Flows in any prior period. Accordingly, the Policyholder contract deposits, and Future policy benefits for life and accident and health insurance contracts included within the Consolidated Balance Sheets were decreased and increased, respectively, by $ billion on December 31, 2020 to $
We assessed the materiality of the misclassifications described above on prior period financial statements in accordance with SEC Staff Accounting Bulletin Number 99, Materiality, as codified in ASC 250-10, Accounting Changes and Error Corrections. We have determined that these misclassifications were not material to the financial statements of any prior annual or interim period.
2. Summary of Significant Accounting Policies
The following table identifies our significant accounting policies presented in other Notes to these Consolidated Financial Statements, with a reference to the Note where a detailed description can be found:
Note 5. Investments
Fixed maturity and equity securities
Other invested assets
Short-term investments
Net investment income
Net realized gains (losses)
Allowance for credit losses/Other-than-temporary impairments
Note 6. Lending Activities
Mortgage and other loans receivable – net of allowance
Note 7. Reinsurance
Reinsurance assets – net of allowance
Retroactive reinsurance
Note 8. Deferred Policy Acquisition Costs
Deferred policy acquisition costs
Amortization of deferred policy acquisition costs
Note 9. Variable Interest Entities
Note 10. Derivatives and Hedge Accounting
Derivative assets and liabilities, at fair value
Note 11. Goodwill and Other Intangible Assets
Note 12. Insurance Liabilities
Liability for unpaid losses and loss adjustment expenses
Discounting of reserves
Future policy benefits
Policyholder contract deposits
Other policyholder funds
Note 13. Variable Life and Annuity Contracts
Note 14. Debt
Long-term debt
Debt of consolidated investment entities
Note 15. Contingencies, Commitments and Guarantees
Legal contingencies
Note 17. Earnings Per Common Share
Note 21. Income Taxes
AIG | 2021 Form 10-K 191
ITEM 8 | Notes to Consolidated Financial Statements | 2. Summary of Significant Accounting Policies
Other significant accounting policies
Premiums for short-duration contracts are recorded as written on the inception date of the policy. Premiums are earned primarily on a pro rata basis over the term of the related coverage. Sales of extended services contracts are reflected as premiums written and earned on a pro rata basis over the term of the related coverage. In addition, certain miscellaneous income is included as premiums written and earned. The reserve for unearned premiums includes the portion of premiums written relating to the unexpired terms of coverage. Reinsurance premiums are typically earned over the same period as the underlying policies or risks covered by the contract. As a result, the earnings pattern of a reinsurance contract may extend up to
Reinsurance premiums ceded under prospective reinsurance agreements are recognized as a reduction in revenues over the period the reinsurance coverage is provided in proportion to the risks to which the premiums relate.
Reinsurance premiums for assumed business are estimated based on information received from brokers, ceding companies and reinsureds. Any subsequent differences that arise regarding such estimates are recorded in the periods in which they are determined.
Premiums for long-duration insurance products and life contingent annuities are recognized as revenues when due. Estimates for premiums due but not yet collected are accrued.
Policy fees represent fees recognized from universal life and investment-type products consisting of policy charges for the cost of insurance, policy administration charges, surrender charges and amortization of unearned revenue reserves. Policy fees are recognized as revenues in the period in which they are assessed against policyholders, unless the fees are designed to compensate AIG for services to be provided in the future. Fees deferred as unearned revenue are amortized in relation to the incidence of expected gross profits to be realized over the estimated lives of the contracts, similar to DAC.
Other income includes advisory fee income from the Life and Retirement broker dealer business.
Other assets consist of deferred sales inducements (DSI), prepaid expenses, deposits, other deferred charges, real estate, other fixed assets, capitalized software costs, goodwill, intangible assets other than goodwill, restricted cash, derivative assets, accrued interest income, and assets classified as held-for-sale.
The cost of buildings and furniture and equipment is depreciated principally on the straight-line basis over their estimated useful lives (maximum of
192 AIG | 2021 Form 10-K
ITEM 8 | Notes to Consolidated Financial Statements | 2. Summary of Significant Accounting Policies
Accounting Standards Adopted During 2021
Income Tax
On December 18, 2019, the FASB issued an accounting standard that simplifies the accounting for income taxes by eliminating certain exceptions to the incremental approach for intraperiod tax allocation, the methodology for calculating income taxes in an interim period and the recognition of deferred tax liabilities for outside basis differences. The amendments also simplified other areas including the accounting for franchise taxes and enacted tax laws or rates and clarified the accounting for transactions that result in the step-up in the tax basis of goodwill. We adopted the standard on its effective date of January 1, 2021. The impact of adoption was not material to our consolidated financial condition, results of operations and cash flows.
Clarification of Accounting for Certain Equity Method Investments
On January 16, 2020, the FASB issued an accounting standard to clarify how a previously issued standard regarding a company’s ability to measure the fair value of certain equity securities without a readily determinable fair value should interact with equity method investments standards. The previously issued standard provides that such equity securities could be measured at cost, minus impairment, if any, unless an observable transaction for an identical or similar security occurs (measurement alternative). The new standard clarifies that a company should consider observable transactions that require the company to either apply or discontinue the equity method of accounting for the purposes of applying the measurement alternative in accordance with the equity method immediately before applying or upon discontinuing the equity method.
The standard further clarifies that, when determining the accounting for certain forward contracts and purchased options a company should not consider, whether upon settlement or exercise, if the underlying securities would be accounted for under the equity method or fair value option.
We adopted the standard prospectively on its effective date of January 1, 2021. The adoption of the standard did not have a material impact on our consolidated financial condition, results of operations or cash flows.
AIG | 2021 Form 10-K 193
ITEM 8 | Notes to Consolidated Financial Statements | 2. Summary of Significant Accounting Policies
Reference Rate Reform
On March 12, 2020, the FASB issued an accounting standard that provides temporary optional guidance to ease the potential burden in accounting for reference rate reform. The standard allows us to account for certain contract modifications that result from the discontinuation of the London Inter-Bank Offered Rate (LIBOR) or another reference rate as a continuation of the existing contract without additional analysis. This standard may be elected and applied prospectively over time from March 12, 2020 through December 31, 2022 as reference rate reform activities occur.
Where permitted by the guidance, we have accounted for contract modifications stemming from the discontinuation of LIBOR or another reference rate as a continuation of the existing contract. As part of our implementation efforts, we have and will continue to assess our operational readiness and current and alternative reference rates’ merits, limitations, risks and suitability for our investment and insurance processes. The adoption of the standard has not had, and is not expected to have, a material impact on our reported consolidated financial condition, results of operations, cash flows and required disclosures.
Future Application of Accounting Standards
Targeted Improvements to the Accounting for Long-Duration Contracts
In August 2018, the FASB issued an accounting standard update with the objective of making targeted improvements to the existing recognition, measurement, presentation, and disclosure requirements for long-duration contracts issued by an insurance entity.
The Company will adopt the standard on January 1, 2023. We continue to evaluate and expect the adoption of this standard will impact our financial condition, results of operations, statement of cash flows and disclosures, as well as systems, processes and controls.
The Company will adopt the standard using the modified retrospective transition method relating to liabilities for traditional and limited payment contracts and deferred policy acquisition costs associated therewith. The Company will adopt the standard in relation to market risk benefits (MRBs) on a retrospective basis. Based upon this transition method, the Company currently estimates that the January 1, 2021 transition date (Transition Date) impact from adoption is likely to result in a decrease in AIG’s equity between approximately $
Market risk benefits: The standard requires the measurement of all MRBs associated with deposit (or account balance) contracts at fair value at each reporting period. Changes in fair value compared to prior periods will be recorded and presented separately within the income statement, with the exception of instrument-specific credit risk changes (non-performance adjustments), which will be recognized in other comprehensive income. MRBs will impact both retained earnings and AOCI upon transition.
As MRBs are required to be accounted for at fair value, the quarterly valuation of these items will result in variability and volatility in the Company’s results following adoption.
Discount rate assumption: The standard requires the discount rate assumption for the liability for future policy benefits to be updated at the end of each reporting period using an upper-medium grade (low credit risk) fixed income instrument yield that maximizes the use of observable market inputs. Upon transition, the Company currently estimates an adjustment to AOCI due to the fact that the market upper-medium grade (low credit risk) interest rates as of the Transition Date differ from reserve interest accretion rates. Lower interest rates result in a higher liability for future policy benefits, and are anticipated to more significantly impact our Life Insurance and Institutional Markets segments.
Following adoption, the impact of changes to discount rates will be recognized through other comprehensive income. Changes resulting from unlocking the discount rate each reporting period will primarily impact term life insurance and other traditional life insurance products, as well as pension risk transfer and structured settlement products.
Removal of balances related to changes in unrealized appreciation (depreciation) on investments: Under the standard, the majority of balances recorded in AOCI related to changes in unrealized appreciation (depreciation) on investments will be eliminated.
In addition to the above, the standard also:
Requires the review and if necessary, update of future policy benefit assumptions at least annually for traditional and limited pay long duration contracts, with the recognition and separate presentation of any resulting re-measurement gain or loss (except for discount rate changes as noted above) in the income statement.
194 AIG | 2021 Form 10-K
ITEM 8 | Notes to Consolidated Financial Statements | 2. Summary of Significant Accounting Policies
Simplifies the amortization of DAC to a constant level basis over the expected term of the related contracts with adjustments for unexpected terminations, but no longer requires an impairment test.
Increased disclosures of disaggregated roll-forwards of several balances, including: liabilities for future policy benefits, deferred acquisition costs, account balances, market risk benefits, separate account liabilities and information about significant inputs, judgments and methods used in measurement and changes thereto and impact of those changes.
We expect that the accounting for Fortitude Re will continue to remain largely unchanged. With respect to Fortitude Re, the reinsurance assets, including the discount rates, will continue to be calculated using the same methodology and assumptions as the direct policies. Accounting for modco remains unchanged.
The Company has created a governance framework and a plan to support implementation of the updated standard. As part of its implementation plan, the Company has also advanced the modernization of its actuarial technology platform to enhance its modeling, data management, experience study and analytical capabilities, increase the end-to-end automation of key reporting and analytical processes and optimize its control framework. The Company has designed and begun implementation and testing of internal controls related to the new processes created as part of implementing the updated standard and will continue to refine these internal controls until the formal implementation in the first quarter of 2023.
3. Segment Information
We report our results of operations consistent with the manner in which our chief operating decision makers review the business to assess performance and allocate resources, as follows:
General Insurance
General Insurance business is presented as
North America – consists of insurance businesses in the United States, Canada and Bermuda, and our global reinsurance business, AIG Re. This also includes the results of Western World Insurance Group, Inc. and Glatfelter Insurance Group.
International – consists of regional insurance businesses in Japan, the United Kingdom, Europe, Middle East and Africa (EMEA region), Asia Pacific, Latin America and Caribbean, and China. International also includes the results of Talbot Holdings, Ltd. as well as AIG’s Global Specialty business.
North America and International operating segments consist of the following products:
– Commercial Lines – consists of Liability, Financial Lines, Property, Global Specialty and Crop Risk Services.
– Personal Insurance – consists of Personal Lines and Accident & Health.
Life and Retirement
Life and Retirement business is presented as
Individual Retirement – consists of fixed annuities, fixed index annuities, variable annuities and retail mutual funds.
Group Retirement – consists of record-keeping, plan administrative and compliance services, financial planning and advisory solutions offered to employer-defined contribution plan participants, along with proprietary and non-proprietary annuities and advisory and brokerage products offered outside of plans.
Life Insurance – primary products in the U.S. include term life and universal life insurance. International operations primarily include distribution of life and health products in the UK and Ireland.
Institutional Markets – consists of stable value wrap products, structured settlement and pension risk transfer annuities, corporate- and bank-owned life insurance, high net worth products and guaranteed investment contracts (GICs).
For additional information on the Life and Retirement business, see Note 1.
Other Operations
Other Operations primarily consists of income from assets held by AIG Parent and other corporate subsidiaries, deferred tax assets related to tax attributes, corporate expenses and intercompany eliminations, our institutional asset management business and results of our consolidated investment entities, General Insurance portfolios in run-off as well as the historical results of our legacy insurance lines ceded to Fortitude Re.
AIG | 2021 Form 10-K 195
The accounting policies of the segments are the same as those described in Note 2. We evaluate segment performance based on adjusted revenues and adjusted pre-tax income (loss). Adjusted revenues and adjusted pre-tax income (loss) are derived by excluding certain items from total revenues and net income (loss) attributable to AIG, respectively. These items generally fall into one or more of the following broad categories: legacy matters having no relevance to our current businesses or operating performance; adjustments to enhance transparency to the underlying economics of transactions; and measures that we believe to be common to the industry. Legal entities are attributed to each segment based upon the predominance of activity in that legal entity. For the items excluded from adjusted revenues and adjusted pre-tax income (loss) see the table below.
The following table presents AIG’s continuing operations by operating segment:
|
|
|
|
|
|
|
|
|
| Adjusted |
|
|
|
|
| Net |
|
|
|
|
| Pre-tax |
|
| Adjusted |
| Investment |
| Interest | Amortization |
| Income |
| ||
(in millions) |
| Revenues |
| Income |
| Expense |
| of DAC |
| (Loss) |
|
2021 |
|
|
|
|
|
|
|
|
|
|
|
General Insurance |
|
|
|
|
|
|
|
|
|
|
|
North America | $ |
|
| $ | $ | $ | ( | (a) | |||
International |
|
|
|
|
|
| (a) | ||||
Net investment income |
| $ |
|
|
|
| |||||
Total General Insurance |
|
|
|
|
|
| |||||
Life and Retirement |
|
|
|
|
|
|
|
|
|
|
|
Individual Retirement |
|
|
|
|
|
| |||||
Group Retirement |
|
|
|
|
|
| |||||
Life Insurance |
|
|
|
|
|
| |||||
Institutional Markets |
|
|
|
|
|
| |||||
Total Life and Retirement |
|
|
|
|
|
| |||||
Other Operations |
|
|
|
|
|
|
|
|
|
|
|
Other Operations before consolidation and eliminations |
|
|
|
|
| ( |
| ||||
AIG consolidation and eliminations |
| ( |
| ( |
| ( |
|
| ( |
| |
Total Other Operations |
|
|
|
|
| ( |
| ||||
Total |
|
|
|
|
|
| |||||
Reconciling items to pre-tax income: |
|
|
|
|
|
|
|
|
|
|
|
Changes in fair value of securities used to hedge guaranteed |
|
|
|
|
|
|
|
|
|
|
|
living benefits |
|
|
|
|
|
| |||||
Changes in benefit reserves and DAC, VOBA and DSI related to |
|
|
|
|
|
|
|
|
|
|
|
net realized gains (losses) |
|
|
|
|
| ( |
| ||||
Changes in the fair value of equity securities |
| ( |
| ( |
|
|
| ( |
| ||
Other income (expense) - net |
| ( |
|
|
|
|
| ||||
Loss on extinguishment of debt |
|
|
|
|
| ( |
| ||||
Net investment income on Fortitude Re funds withheld assets |
|
|
|
|
|
| |||||
Net realized gains (losses) on Fortitude Re funds withheld assets |
|
|
|
|
|
| |||||
Net realized gains (losses) on Fortitude Re funds withheld |
|
|
|
|
|
|
|
|
|
|
|
embedded derivative |
| ( |
|
|
|
| ( |
| |||
Net realized gains (losses)(b) |
|
| ( |
| ( |
|
|
| |||
Net gain on divestitures |
|
|
|
|
|
| |||||
Non-operating litigation reserves and settlements |
|
|
|
|
| ( |
| ||||
Favorable prior year development and related amortization |
|
|
|
|
|
|
|
|
|
|
|
changes ceded under retroactive reinsurance agreements |
|
|
|
|
|
| |||||
Net loss reserve discount benefit |
|
|
|
|
|
| |||||
Pension expense related to lump sum payments to former employees |
|
|
|
|
| ( |
| ||||
Integration and transaction costs associated with acquiring or divesting |
|
|
|
|
|
|
|
|
|
|
|
businesses |
|
|
|
|
| ( |
| ||||
Restructuring and other costs |
|
|
|
|
| ( |
| ||||
Non-recurring costs related to regulatory or accounting changes |
|
|
|
|
| ( |
| ||||
Revenues and pre-tax income | $ | $ | $ | $ | $ |
| |||||
2020 |
|
|
|
|
|
|
|
|
|
|
|
General Insurance |
|
|
|
|
|
|
|
|
|
|
|
North America | $ |
|
| $ | $ | $ | ( | (a) | |||
International |
|
|
|
|
|
| (a) | ||||
Net investment income |
| $ |
|
|
|
| |||||
Total General Insurance |
|
|
|
|
|
| |||||
Life and Retirement |
|
|
|
|
|
|
|
|
|
|
|
Individual Retirement |
|
|
|
|
|
| |||||
Group Retirement |
|
|
|
|
|
| |||||
Life Insurance |
|
|
|
|
|
| |||||
Institutional Markets |
|
|
|
|
|
| |||||
Total Life and Retirement |
|
|
|
|
|
| |||||
196 AIG | 2021 Form 10-K
Other Operations |
|
|
|
|
|
|
|
|
|
|
|
Other Operations before consolidation and eliminations |
|
|
|
|
| ( |
| ||||
AIG consolidation and eliminations |
| ( |
| ( |
| ( |
|
| ( |
| |
Total Other Operations |
|
|
|
|
| ( |
| ||||
Total |
|
|
|
|
|
| |||||
Reconciling items to pre-tax income (loss): |
|
|
|
|
|
|
|
|
|
|
|
Changes in fair value of securities used to hedge guaranteed |
|
|
|
|
|
|
|
|
|
|
|
living benefits |
|
|
|
|
|
| |||||
Changes in benefit reserves and DAC, VOBA and DSI related to |
|
|
|
|
|
|
|
|
|
|
|
net realized gains (losses) |
|
|
|
| ( |
|
| ||||
Changes in the fair value of equity securities |
|
|
|
|
|
| |||||
Other income (expense) - net |
|
|
|
|
|
| |||||
Loss on extinguishment of debt |
|
|
|
|
| ( |
| ||||
Net investment income on Fortitude Re funds withheld assets |
|
|
|
|
|
| |||||
Net realized gains on Fortitude Re funds withheld assets |
|
|
|
|
|
| |||||
Net realized losses on Fortitude Re funds withheld |
|
|
|
|
|
|
|
|
|
|
|
embedded derivative |
| ( |
|
|
|
| ( |
| |||
Net realized losses(b) |
| ( |
| ( |
| ( |
|
| ( |
| |
Net loss on divestitures |
|
|
|
|
| ( |
| ||||
Non-operating litigation reserves and settlements |
|
|
|
|
|
| |||||
Favorable prior year development and related amortization |
|
|
|
|
|
|
|
|
|
|
|
changes ceded under retroactive reinsurance agreements |
|
|
|
|
|
| |||||
Net loss reserve discount charge |
|
|
|
|
| ( |
| ||||
Integration and transaction costs associated with acquiring or divesting |
|
|
|
|
|
|
|
|
|
|
|
businesses |
|
|
|
|
| ( |
| ||||
Restructuring and other costs |
|
|
|
|
| ( |
| ||||
Non-recurring costs related to regulatory or accounting changes |
|
|
|
|
| ( |
| ||||
Revenues and pre-tax income (loss) | $ | $ | $ | $ | $ | ( |
| ||||
2019 |
|
|
|
|
|
|
|
|
|
|
|
General Insurance |
|
|
|
|
|
|
|
|
|
|
|
North America | $ |
|
| $ | $ | $ | ( | (a) | |||
International |
|
|
|
|
|
| (a) | ||||
Net investment income |
| $ |
|
|
|
| |||||
Total General Insurance |
|
|
|
|
|
| |||||
Life and Retirement |
|
|
|
|
|
|
|
|
|
|
|
Individual Retirement |
|
|
|
|
|
| |||||
Group Retirement |
|
|
|
|
|
| |||||
Life Insurance |
|
|
|
|
|
| |||||
Institutional Markets |
|
|
|
|
|
| |||||
Total Life and Retirement |
|
|
|
|
|
| |||||
Other Operations |
|
|
|
|
|
|
|
|
|
|
|
Other Operations before consolidation and eliminations |
|
|
|
|
| ( |
| ||||
AIG consolidation and eliminations |
| ( |
| ( |
| ( |
|
| ( |
| |
Total Other Operations |
|
|
|
|
| ( |
| ||||
Total |
|
|
|
|
|
| |||||
Reconciling items to pre-tax income: |
|
|
|
|
|
|
|
|
|
|
|
Changes in fair value of securities used to hedge guaranteed |
|
|
|
|
|
|
|
|
|
|
|
living benefits |
|
|
|
|
|
| |||||
Changes in benefit reserves and DAC, VOBA and DSI related to |
|
|
|
|
|
|
|
|
|
|
|
net realized gains (losses) |
|
|
|
| ( |
|
| ||||
Changes in the fair value of equity securities |
|
|
|
|
|
| |||||
Other income (expense) - net |
|
|
|
|
|
| |||||
Loss on extinguishment of debt |
|
|
|
|
| ( |
| ||||
Net realized gains (losses)(b) |
|
| ( |
| ( |
|
|
| |||
Net loss on divestitures |
|
|
|
|
| ( |
| ||||
Non-operating litigation reserves and settlements |
|
|
|
|
|
| |||||
Favorable prior year development and related amortization |
|
|
|
|
|
|
|
|
|
|
|
changes ceded under retroactive reinsurance agreements |
|
|
|
|
|
| |||||
Net loss reserve discount charge |
|
|
|
|
| ( |
| ||||
Integration and transaction costs associated with acquiring or divesting |
|
|
|
|
|
|
|
|
|
|
|
businesses |
|
|
|
|
| ( |
| ||||
Restructuring and other costs |
|
|
|
|
| ( |
| ||||
Non-recurring costs related to regulatory or accounting changes |
|
|
|
|
| ( |
| ||||
Revenues and pre-tax income | $ | $ | $ | $ | $ |
|
(a) General Insurance North America’s and General Insurance International’s Adjusted pre-tax income does not include Net investment income as the investment portfolio results are managed at the General Insurance level. Net investment income is shown separately as a component of General Insurance’s total Adjusted pre-tax income results.
AIG | 2021 Form 10-K 197
(b) Includes all net realized gains and losses except earned income (periodic settlements and changes in settlement accruals) on derivative instruments used for non-qualifying (economic) hedging or for asset replication and net realized gains and losses on Fortitude Re funds withheld assets held by AIG in support of Fortitude Re’s reinsurance obligations to AIG (Fortitude Re funds withheld assets).
The following table presents AIG’s year-end identifiable assets and capital expenditures by segment:
| Year-End Identifiable Assets |
| Capital Expenditures | ||||||
(in millions) |
| 2021 |
| 2020* |
|
| 2021 |
| 2020 |
General Insurance | $ | $ |
| $ | $ | ||||
Life and Retirement |
|
|
|
|
| ||||
Other Operations |
|
|
|
|
| ||||
Total Assets | $ | $ |
| $ | $ | ||||
|
|
|
|
|
|
|
| Real Estate and Other Fixed Assets, | |||||
| Total Revenues* |
| Net of Accumulated Depreciation | ||||||||||
(in millions) |
| 2021 |
| 2020 |
| 2019 |
|
| 2021 |
| 2020 |
| 2019 |
North America | $ | $ | $ |
| $ | $ | $ | ||||||
International |
|
|
|
|
|
|
| ||||||
Consolidated | $ | $ | $ |
| $ | $ | $ | ||||||
4. Fair Value Measurements
Fair Value Measurements on a Recurring Basis
We carry certain of our financial instruments at fair value. We define the fair value of a financial instrument as the amount that would be received from the sale of an asset or paid to transfer a liability in an orderly transaction between market participants at the measurement date. We are responsible for the determination of the value of the investments carried at fair value and the supporting methodologies and assumptions.
The degree of judgment used in measuring the fair value of financial instruments generally inversely correlates with the level of observable valuation inputs. We maximize the use of observable inputs and minimize the use of unobservable inputs when measuring fair value. Financial instruments with quoted prices in active markets generally have more pricing observability and less judgment is used in measuring fair value. Conversely, financial instruments for which no quoted prices are available have less observability and are measured at fair value using valuation models or other pricing techniques that require more judgment. Pricing observability is affected by a number of factors, including the type of financial instrument, whether the financial instrument is new to the market and not yet established, the characteristics specific to the transaction, liquidity and general market conditions.
Fair Value Hierarchy
Assets and liabilities recorded at fair value in the Consolidated Balance Sheets are measured and classified in accordance with a fair value hierarchy consisting of three “levels” based on the observability of valuation inputs:
Level 1: Fair value measurements based on quoted prices (unadjusted) in active markets that we have the ability to access for identical assets or liabilities. Market price data generally is obtained from exchange or dealer markets. We do not adjust the quoted price for such instruments.
Level 2: Fair value measurements based on inputs other than quoted prices included in Level 1 that are observable for the asset or liability, either directly or indirectly. Level 2 inputs include quoted prices for similar assets and liabilities in active markets, quoted prices for identical or similar assets or liabilities in markets that are not active, and inputs other than quoted prices that are observable for the asset or liability, such as interest rates and yield curves that are observable at commonly quoted intervals.
Level 3: Fair value measurements based on valuation techniques that use significant inputs that are unobservable. Both observable and unobservable inputs may be used to determine the fair values of positions classified in Level 3. The circumstances for using these measurements include those in which there is little, if any, market activity for the asset or liability. Therefore, we must make certain assumptions about the inputs a hypothetical market participant would use to value that asset or liability.
198 AIG | 2021 Form 10-K
In certain cases, the inputs used to measure fair value may fall into different levels of the fair value hierarchy. In such cases, the level in the fair value hierarchy within which the fair value measurement in its entirety falls is determined based on the lowest level input that is significant to the fair value measurement in its entirety.
The following is a description of the valuation methodologies used for instruments carried at fair value. These methodologies are applied to assets and liabilities across the levels discussed above, and it is the observability of the inputs used that determines the appropriate level in the fair value hierarchy for the respective asset or liability.
Valuation Methodologies of Financial Instruments Measured at Fair Value
Incorporation of Credit Risk in Fair Value Measurements
Our Own Credit Risk. Fair value measurements for certain liabilities incorporate our own credit risk by determining the explicit cost for each counterparty to protect against its net credit exposure to us at the balance sheet date by reference to observable AIG credit default swaps (CDS) or cash bond spreads. We calculate the effect of credit spread changes using discounted cash flow techniques that incorporate current market interest rates. A derivative counterparty’s net credit exposure to us is determined based on master netting agreements, when applicable, which take into consideration all derivative positions with us, as well as collateral we post with the counterparty at the balance sheet date. For a description of how we incorporate our own credit risk in the valuation of embedded derivatives related to certain annuity and life insurance products see – Embedded Derivatives within Policyholder Contract Deposits below.
Counterparty Credit Risk. Fair value measurements for freestanding derivatives incorporate counterparty credit by determining the explicit cost for us to protect against our net credit exposure to each counterparty at the balance sheet date by reference to observable counterparty CDS spreads, when available. When not available, other directly or indirectly observable credit spreads will be used to derive the best estimates of the counterparty spreads. Our net credit exposure to a counterparty is determined based on master netting agreements, which take into consideration all derivative positions with the counterparty, as well as collateral posted by the counterparty at the balance sheet date.
Fair values for fixed maturity securities based on observable market prices for identical or similar instruments implicitly incorporate counterparty credit risk. Fair values for fixed maturity securities based on internal models incorporate counterparty credit risk by using discount rates that take into consideration cash issuance spreads for similar instruments or other observable information.
For fair values measured based on internal models, the cost of credit protection is determined under a discounted present value approach considering the market levels for single name CDS spreads for each specific counterparty, the mid-market value of the net exposure (reflecting the amount of protection required) and the weighted average life of the net exposure. CDS spreads are provided to us by an independent third party. We utilize an interest rate based on the benchmark LIBOR curve to derive our discount rates.
While this approach does not explicitly consider all potential future behavior of the derivative transactions or potential future changes in valuation inputs, we believe this approach provides a reasonable estimate of the fair value of the assets and liabilities, including consideration of the impact of non-performance risk.
Fixed Maturity Securities
Whenever available, we obtain quoted prices in active markets for identical assets at the balance sheet date to measure fixed maturity securities at fair value. Market price data is generally obtained from dealer markets.
We employ independent third-party valuation service providers to gather, analyze, and interpret market information to derive fair value estimates for individual investments, based upon market-accepted methodologies and assumptions. The methodologies used by these independent third-party valuation service providers are reviewed and understood by management, through periodic discussion with and information provided by the independent third-party valuation service providers. In addition, as discussed further below, control processes are applied to the fair values received from independent third-party valuation service providers to ensure the accuracy of these values.
Valuation service providers typically obtain data about market transactions and other key valuation model inputs from multiple sources and, through the use of market-accepted valuation methodologies, which may utilize matrix pricing, financial models, accompanying model inputs and various assumptions, provide a single fair value measurement for individual securities. The inputs used by the valuation service providers include, but are not limited to, market prices from completed transactions for identical securities and transactions for comparable securities, benchmark yields, interest rate yield curves, credit spreads, prepayment rates, default rates, recovery assumptions, currency rates, quoted prices for similar securities and other market-observable information, as applicable. If fair value is determined using financial models, these models generally take into account, among other things, market observable information as of the measurement date as well as the specific attributes of the security being valued, including its term, interest rate, credit rating, industry sector, and when applicable, collateral quality and other security or issuer-specific information. When market
AIG | 2021 Form 10-K 199
transactions or other market observable data is limited, the extent to which judgment is applied in determining fair value is greatly increased.
We have control processes designed to ensure that the fair values received from independent third-party valuation service providers are accurately recorded, that their data inputs and valuation techniques are appropriate and consistently applied and that the assumptions used appear reasonable and consistent with the objective of determining fair value. We assess the reasonableness of individual security values received from independent third-party valuation service providers through various analytical techniques, and have procedures to escalate related questions internally and to the independent third-party valuation service providers for resolution. To assess the degree of pricing consensus among various valuation service providers for specific asset types, we conduct comparisons of prices received from available sources. We use these comparisons to establish a hierarchy for the fair values received from independent third-party valuation service providers to be used for particular security classes. We also validate prices for selected securities through reviews by members of management who have relevant expertise and who are independent of those charged with executing investing transactions.
When our independent third-party valuation service providers are unable to obtain sufficient market observable information upon which to estimate the fair value for a particular security, fair value is determined either by requesting brokers who are knowledgeable about these securities to provide a price quote, which is generally non-binding, or by employing market accepted valuation models. Broker prices may be based on an income approach, which converts expected future cash flows to a single present value amount, with specific consideration of inputs relevant to particular security types. For structured securities, such inputs may include ratings, collateral types, geographic concentrations, underlying loan vintages, loan delinquencies and defaults, loss severity assumptions, prepayments, and weighted average coupons and maturities. When the volume or level of market activity for a security is limited, certain inputs used to determine fair value may not be observable in the market. Broker prices may also be based on a market approach that considers recent transactions involving identical or similar securities. Fair values provided by brokers are subject to similar control processes to those noted above for fair values from independent third-party valuation service providers, including management reviews. For those corporate debt instruments (for example, private placements) that are not traded in active markets or that are subject to transfer restrictions, valuations reflect illiquidity and non-transferability, based on available market evidence. When observable price quotations are not available, fair value is determined based on discounted cash flow models using discount rates based on credit spreads, yields or price levels of comparable securities, adjusted for illiquidity and structure. Fair values determined internally are also subject to management review to ensure that valuation models and related inputs are reasonable.
The methodology above is relevant for all fixed maturity securities including residential mortgage backed securities (RMBS), commercial mortgage backed securities (CMBS), collateralized debt obligations (CDO), other asset-backed securities (ABS) and fixed maturity securities issued by government sponsored entities and corporate entities.
Equity Securities Traded in Active Markets
Whenever available, we obtain quoted prices in active markets for identical assets at the balance sheet date to measure equity securities at fair value. Market price data is generally obtained from exchange or dealer markets.
Mortgage and Other Loans Receivable
We estimate the fair value of mortgage and other loans receivable that are measured at fair value by using dealer quotations, discounted cash flow analyses and/or internal valuation models. The determination of fair value considers inputs such as interest rate, maturity, the borrower’s creditworthiness, collateral, subordination, guarantees, past-due status, yield curves, credit curves, prepayment rates, market pricing for comparable loans and other relevant factors.
Other Invested Assets
We initially estimate the fair value of investments in certain hedge funds, private equity funds and other investment partnerships by reference to the transaction price. Subsequently, we generally obtain the fair value of these investments from net asset value information provided by the general partner or manager of the investments, the financial statements of which are generally audited annually. We consider observable market data and perform certain control procedures to validate the appropriateness of using the net asset value as a fair value measurement. The fair values of other investments carried at fair value, such as direct private equity holdings, are initially determined based on transaction price and are subsequently estimated based on available evidence such as market transactions in similar instruments, other financing transactions of the issuer and other available financial information for the issuer, with adjustments made to reflect illiquidity as appropriate.
200 AIG | 2021 Form 10-K
Short-term Investments
For short-term investments that are measured at amortized cost, the carrying amounts of these assets approximate fair values because of the relatively short period of time between origination and expected realization, and their limited exposure to credit risk. Securities purchased under agreements to resell (reverse repurchase agreements) are generally treated as collateralized receivables. We report certain receivables arising from securities purchased under agreements to resell as Short-term investments in the Consolidated Balance Sheets. When these receivables are measured at fair value, we use market-observable interest rates to determine fair value.
Separate Account Assets
Separate account assets are composed primarily of registered and unregistered open-end mutual funds that generally trade daily and are measured at fair value in the manner discussed above for equity securities traded in active markets.
Freestanding Derivatives
Derivative assets and liabilities can be exchange-traded or traded over-the-counter (OTC). We generally value exchange-traded derivatives such as futures and options using quoted prices in active markets for identical derivatives at the balance sheet date.
OTC derivatives are valued using market transactions and other market evidence whenever possible, including market-based inputs to models, model calibration to market clearing transactions, broker or dealer quotations or alternative pricing sources with reasonable levels of price transparency. When models are used, the selection of a particular model to value an OTC derivative depends on the contractual terms of, and specific risks inherent in the instrument, as well as the availability of pricing information in the market. We generally use similar models to value similar instruments. Valuation models require a variety of inputs, including contractual terms, market prices and rates, yield curves, credit curves, measures of volatility, prepayment rates and correlations of such inputs. For OTC derivatives that trade in liquid markets, such as generic forwards, swaps and options, model inputs can generally be corroborated by observable market data by correlation or other means, and model selection does not involve significant management judgment.
For certain OTC derivatives that trade in less liquid markets, where we generally do not have corroborating market evidence to support significant model inputs and cannot verify the model to market transactions, the transaction price may provide the best estimate of fair value. Accordingly, when a pricing model is used to value such an instrument, the model is adjusted so the model value at inception equals the transaction price. We will update valuation inputs in these models only when corroborated by evidence such as similar market transactions, independent third-party valuation service providers and/or broker or dealer quotations, or other empirical market data. When appropriate, valuations are adjusted for various factors such as liquidity, bid/offer spreads and credit considerations. Such adjustments are generally based on available market evidence. In the absence of such evidence, management’s best estimate is used.
We value our super senior credit default swap portfolio using prices obtained from vendors and/or counterparties. The valuation of the super senior credit derivatives is complex because of the limited availability of market observable information due to the lack of trading and price transparency in certain structured finance markets. Our valuation methodologies for the super senior CDS portfolio have evolved over time in response to market conditions and the availability of market observable information. We have sought to calibrate the methodologies to available market information and to review the assumptions of the methodologies on a regular basis.
Embedded Derivatives within Policyholder Contract Deposits
Certain variable annuity and fixed index annuity and life contracts contain embedded derivatives that we bifurcate from the host contracts and account for separately at fair value, with changes in fair value recognized in earnings. These embedded derivatives are classified within Policyholder contract deposits. We have concluded these contracts contain either (i) a written option that guarantees a minimum accumulation value at maturity, (ii) a written option that guarantees annual withdrawals regardless of underlying market performance for a specific period or for life, or (iii) fixed index written options that meet the criteria of derivatives and must be bifurcated.
The fair value of embedded derivatives contained in certain variable annuity and fixed index annuity and life contracts is measured based on policyholder behavior and capital market assumptions related to projected cash flows over the expected lives of the contracts. These discounted cash flow projections primarily include benefits and related fees assessed, when applicable. In some instances, the projected cash flows from fees may exceed projected cash flows related to benefit payments and therefore, at a point in time, the carrying value of the embedded derivative may be in a net asset position. The projected cash flows incorporate best estimate assumptions for policyholder behavior (including mortality, lapses, withdrawals and benefit utilization), along with an explicit risk margin to reflect a market participant’s estimates of projected cash flows and policyholder behavior. Estimates of future policyholder behavior assumptions are subjective and based primarily on our historical experience.
AIG | 2021 Form 10-K 201
Because of the dynamic and complex nature of the projected cash flows with respect to embedded derivatives in our variable and certain fixed index annuity contracts, risk neutral valuations are used, which are calibrated to observable interest rate and equity option prices. Estimating the underlying cash flows for these products involves judgments regarding the capital market assumptions related to expected market rates of return, market volatility, credit spreads, correlations of certain market variables, fund performance and discount rates. Additionally, estimating the underlying cash flows for these products also involves judgments regarding policyholder behavior. The portion of fees attributable to the fair value of expected benefit payments are included within the fair value measurement of these embedded derivatives, and related fees are classified in net realized gain/loss as earned, consistent with other changes in the fair value of these embedded policy derivatives. Any portion of the fees not attributed to the embedded derivatives are excluded from the fair value measurement and classified in policy fees as earned.
With respect to embedded derivatives in our fixed index annuity and life contracts, option pricing models are used to estimate fair value, taking into account the capital market assumptions for future equity index growth rates, volatility of the equity index, future interest rates, and our ability to adjust the participation rate and the cap on fixed index credited rates in light of market conditions and policyholder behavior assumptions.
Projected cash flows are discounted using the interest rate swap curve (swap curve), which is commonly viewed as being consistent with the credit spreads for highly-rated financial institutions (S&P AA-rated or above). A swap curve shows the fixed-rate leg of a non-complex swap against the floating rate (for example, LIBOR) leg of a related tenor. We also incorporate our own risk of non-performance in the valuation of the embedded derivatives associated with variable annuity and fixed index annuity and life contracts. The non-performance risk adjustment (NPA) reflects a market participant’s view of our claims-paying ability by incorporating an additional spread to the swap curve used to discount projected benefit cash flows in the valuation of these embedded derivatives. The non-performance risk adjustment is calculated by constructing forward rates based on a weighted average of observable corporate credit indices to approximate the claims-paying ability rating of our Life and Retirement companies.
Fortitude Re funds withheld payable
The reinsurance transactions between AIG and Fortitude Re were structured as modified coinsurance (modco) and loss portfolio transfer arrangements with funds withheld (funds withheld). As a result of the deconsolidation resulting from the Majority Interest Fortitude Sale, AIG has established a funds withheld payable to Fortitude Re while simultaneously establishing a reinsurance asset representing reserves for the insurance coverage that Fortitude Re has assumed. The funds withheld payable contains an embedded derivative and changes in fair value of the embedded derivative related to the funds withheld payable are recognized in earnings through realized gains (losses). This embedded derivative is considered a total return swap with contractual returns that are attributable to various assets and liabilities associated with these reinsurance agreements.
Long-Term Debt
The fair value of non-structured liabilities is generally determined by using market prices from exchange or dealer markets, when available, or discounting expected cash flows using the appropriate discount rate for the applicable maturity. We determine the fair value of structured liabilities and hybrid financial instruments (where performance is linked to structured interest rates, inflation or currency risks) using the appropriate derivative valuation methodology (described above) given the nature of the embedded risk profile. In addition, adjustments are made to the valuations of both non-structured and structured liabilities to reflect our own creditworthiness based on the methodology described under the caption “Incorporation of Credit Risk in Fair Value Measurements – Our Own Credit Risk” above.
Borrowings under obligations of guaranteed investment agreements (GIAs), which are guaranteed by us, are recorded at fair value using discounted cash flow calculations based on interest rates currently being offered for similar contracts and our current market observable implicit credit spread rates with maturities consistent with those remaining for the contracts being valued. Obligations may be called at various times prior to maturity at the option of the counterparty. Interest rates on these borrowings are primarily fixed, vary by maturity and range up to
Other Liabilities
Other liabilities measured at fair value include certain securities sold under agreements to repurchase and certain securities sold but not yet purchased. Liabilities arising from securities sold under agreements to repurchase are generally treated as collateralized borrowings. We estimate the fair value of liabilities arising under these agreements by using market-observable interest rates. This methodology considers such factors as the coupon rate, yield curves and other relevant factors. Fair values for securities sold but not yet purchased are based on current market prices.
202 AIG | 2021 Form 10-K
Assets and Liabilities Measured at Fair Value on a Recurring Basis
The following table presents information about assets and liabilities measured at fair value on a recurring basis and indicates the level of the fair value measurement based on the observability of the inputs used:
December 31, 2021 |
|
|
|
|
|
| Counterparty | Cash |
| |||
(in millions) |
| Level 1 |
| Level 2 |
| Level 3 |
| Netting(a) | Collateral |
| Total | |
Assets: |
|
|
|
|
|
|
|
|
|
|
|
|
Bonds available for sale: |
|
|
|
|
|
|
|
|
|
|
|
|
U.S. government and government sponsored entities | $ | $ | $ | $ | - | $ | - | $ | ||||
Obligations of states, municipalities and political subdivisions |
|
|
|
| - |
| - |
| ||||
Non-U.S. governments |
|
|
|
| - |
| - |
| ||||
Corporate debt |
|
|
|
| - |
| - |
| ||||
RMBS |
|
|
|
| - |
| - |
| ||||
CMBS |
|
|
|
| - |
| - |
| ||||
CDO/ABS |
|
|
|
| - |
| - |
| ||||
Total bonds available for sale |
|
|
|
| - |
| - |
| ||||
Other bond securities: |
|
|
|
|
|
|
|
|
|
|
|
|
U.S. government and government sponsored entities |
|
|
|
| - |
| - |
| ||||
Obligations of states, municipalities and political subdivisions |
|
|
|
| - |
| - |
| ||||
Non-U.S. governments |
|
|
|
| - |
| - |
| ||||
Corporate debt |
|
|
|
| - |
| - |
| ||||
RMBS |
|
|
|
| - |
| - |
| ||||
CMBS |
|
|
|
| - |
| - |
| ||||
CDO/ABS |
|
|
|
| - |
| - |
| ||||
Total other bond securities |
|
|
|
| - |
| - |
| ||||
Equity securities |
|
|
|
| - |
| - |
| ||||
Other invested assets(b) |
|
|
|
| - |
| - |
| ||||
Derivative assets(c): |
|
|
|
|
|
|
|
|
|
|
|
|
Interest rate contracts |
|
|
|
| - |
| - |
| ||||
Foreign exchange contracts |
|
|
|
| - |
| - |
| ||||
Equity contracts |
|
|
|
| - |
| - |
| ||||
Commodity contracts |
|
|
|
| - |
| - |
| ||||
Credit contracts |
|
|
|
| - |
| - |
| ||||
Other contracts |
|
|
|
| - |
| - |
| ||||
Counterparty netting and cash collateral |
| - |
| - |
| - |
| ( |
| ( |
| ( |
Total derivative assets |
|
|
|
| ( |
| ( |
| ||||
Short-term investments |
|
|
|
| - |
| - |
| ||||
Other assets |
|
|
|
| - |
| - |
| ||||
Separate account assets |
|
|
|
| - |
| - |
| ||||
Total | $ | $ | $ | $ | ( | $ | ( | $ | ||||
Liabilities: |
|
|
|
|
|
|
|
|
|
|
|
|
Policyholder contract deposits | $ | $ | $ | $ | - | $ | - | $ | ||||
Derivative liabilities(c): |
|
|
|
|
|
|
|
|
|
|
|
|
Interest rate contracts |
|
|
|
| - |
| - |
| ||||
Foreign exchange contracts |
|
|
|
| - |
| - |
| ||||
Equity contracts |
|
|
|
| - |
| - |
| ||||
Credit contracts |
|
|
|
| - |
| - |
| ||||
Other contracts |
|
|
|
| - |
| - |
| ||||
Counterparty netting and cash collateral |
| - |
| - |
| - |
| ( |
| ( |
| ( |
Total derivative liabilities |
|
|
|
| ( |
| ( |
| ||||
Fortitude Re funds withheld payable |
|
|
|
| - |
| - |
| ||||
Other liabilities |
|
|
|
| - |
| - |
| ||||
Long-term debt |
|
|
|
| - |
| - |
| ||||
Total | $ | $ | $ | $ | ( | $ | ( | $ | ||||
AIG | 2021 Form 10-K 203
December 31, 2020 |
|
|
|
|
|
| Counterparty | Cash |
| |||
(in millions) |
| Level 1 |
| Level 2 |
| Level 3 |
| Netting(a) |
| Collateral |
| Total |
Assets: |
|
|
|
|
|
|
|
|
|
|
|
|
Bonds available for sale: |
|
|
|
|
|
|
|
|
|
|
|
|
U.S. government and government sponsored entities | $ | $ | $ | $ | - | $ | - | $ | ||||
Obligations of states, municipalities and political subdivisions |
|
|
|
| - |
| - |
| ||||
Non-U.S. governments |
|
|
|
| - |
| - |
| ||||
Corporate debt |
|
|
|
| - |
| - |
| ||||
RMBS |
|
|
|
| - |
| - |
| ||||
CMBS |
|
|
|
| - |
| - |
| ||||
CDO/ABS |
|
|
|
| - |
| - |
| ||||
Total bonds available for sale |
|
|
|
| - |
| - |
| ||||
Other bond securities: |
|
|
|
|
|
|
|
|
|
|
|
|
U.S. government and government sponsored entities |
|
|
|
| - |
| - |
| ||||
Non-U.S. governments |
|
|
|
| - |
| - |
| ||||
Corporate debt |
|
|
|
| - |
| - |
| ||||
RMBS |
|
|
|
| - |
| - |
| ||||
CMBS |
|
|
|
| - |
| - |
| ||||
CDO/ABS |
|
|
|
| - |
| - |
| ||||
Total other bond securities |
|
|
|
| - |
| - |
| ||||
Equity securities |
|
|
|
| - |
| - |
| ||||
Other invested assets(b) |
|
|
|
| - |
| - |
| ||||
Derivative assets(c): |
|
|
|
|
|
|
|
|
|
|
|
|
Interest rate contracts |
|
|
|
| - |
| - |
| ||||
Foreign exchange contracts |
|
|
|
| - |
| - |
| ||||
Equity contracts |
|
|
|
| - |
| - |
| ||||
Credit contracts |
|
|
|
| - |
| - |
| ||||
Other contracts |
|
|
|
| - |
| - |
| ||||
Counterparty netting and cash collateral |
| - |
| - |
| - |
| ( |
| ( |
| ( |
Total derivative assets |
|
|
|
| ( |
| ( |
| ||||
Short-term investments |
|
|
|
| - |
| - |
| ||||
Other assets |
|
|
|
| - |
| - |
| ||||
Separate account assets |
|
|
|
| - |
| - |
| ||||
Total | $ | $ | $ | $ | ( | $ | ( | $ | ||||
Liabilities: |
|
|
|
|
|
|
|
|
|
|
|
|
Policyholder contract deposits | $ | $ | $ | $ | - | $ | - | $ | ||||
Derivative liabilities(c): |
|
|
|
|
|
|
|
|
|
|
|
|
Interest rate contracts |
|
|
|
| - |
| - |
| ||||
Foreign exchange contracts |
|
|
|
| - |
| - |
| ||||
Equity contracts |
|
|
|
| - |
| - |
| ||||
Credit contracts |
|
|
|
| - |
| - |
| ||||
Other contracts |
|
|
|
| - |
| - |
| ||||
Counterparty netting and cash collateral |
| - |
| - |
| - |
| ( |
| ( |
| ( |
Total derivative liabilities |
|
|
|
| ( |
| ( |
| ||||
Fortitude Re funds withheld payable |
|
|
|
| - |
| - |
| ||||
Other liabilities |
|
|
|
| - |
| - |
| ||||
Long-term debt |
|
|
|
| - |
| - |
| ||||
Total | $ | $ | $ | $ | ( | $ | ( | $ | ||||
(b)
Excludes investments that are measured at fair value using the net asset value (NAV) per share (or its equivalent), which totaled $
(c) Presented as part of Other assets and Other liabilities on the Consolidated Balance Sheets.
204 AIG | 2021 Form 10-K
Changes in Level 3 Recurring Fair Value Measurements
The following tables present changes during the years ended December 31, 2021 and 2020 in Level 3 assets and liabilities measured at fair value on a recurring basis, and the realized and unrealized gains (losses) related to the Level 3 assets and liabilities in the Consolidated Balance Sheets at December 31, 2021 and 2020:
|
|
|
| Net |
|
|
|
|
|
|
|
|
|
|
|
|
|
|
| Changes in |
|
|
|
| Realized |
|
|
|
|
|
|
|
|
|
|
|
|
|
|
| Unrealized Gains |
|
|
|
| and |
|
|
| Purchases, |
|
|
|
|
|
|
|
|
| Changes in |
| (Losses) Included in |
|
|
| Unrealized |
|
|
| Sales, |
|
|
|
|
|
|
|
|
| Unrealized Gains | Other Comprehensive | ||
|
|
|
| Gains |
|
|
| Issuances |
|
|
|
|
|
|
|
|
| (Losses) Included |
| Income (Loss) for |
| Fair Value |
| (Losses) | Other |
| and |
| Gross |
| Gross |
|
| Fair Value |
| in Income on |
| Recurring Level 3 | |||
| Beginning | Included | Comprehensive |
| Settlements, | Transfers | Transfers |
|
|
| End |
| Instruments Held |
| Instruments Held | |||||
(in millions) | of Year | in Income | Income (Loss) |
| Net |
| In |
| Out |
| Other |
| of Year |
| at End of Year |
| at End of Year | |||
December 31, 2021 |
|
|
|
|
|
|
|
|
|
|
|
|
|
|
|
|
|
| ||
Assets: |
|
|
|
|
|
|
|
|
|
|
|
|
|
|
|
|
|
|
|
|
Bonds available for sale: |
|
|
|
|
|
|
|
|
|
|
|
|
|
|
|
|
|
|
|
|
Obligations of states, |
|
|
|
|
|
|
|
|
|
|
|
|
|
|
|
|
|
|
|
|
municipalities and |
|
|
|
|
|
|
|
|
|
|
|
|
|
|
|
|
|
|
|
|
political subdivisions | $ | $ | $ | ( | $ | ( | $ | $ | ( | $ | ( | $ | $ | $ | ||||||
Non-U.S. governments |
|
|
| ( |
|
|
| ( |
|
|
|
| ||||||||
Corporate debt |
|
| ( |
| ( |
|
|
| ( |
|
|
|
| ( | ||||||
RMBS |
|
|
| ( |
| ( |
|
| ( |
|
|
|
| |||||||
CMBS |
|
|
| ( |
|
|
| ( |
|
|
|
| ( | |||||||
CDO/ABS |
|
|
| ( |
|
|
| ( |
|
|
|
| ||||||||
Total bonds available for sale |
|
|
| ( |
|
|
| ( |
| ( |
|
|
| |||||||
Other bond securities: |
|
|
|
|
|
|
|
|
|
|
|
|
|
|
|
|
|
|
|
|
Corporate debt |
|
| ( |
|
|
|
|
|
|
| ( |
| ||||||||
RMBS |
|
|
|
|
|
|
|
|
| ( |
| |||||||||
CMBS |
|
| ( |
|
| ( |
|
|
|
|
|
| ||||||||
CDO/ABS |
|
|
|
| ( |
|
|
|
|
|
| |||||||||
Total other bond securities |
|
|
|
| ( |
|
|
|
|
|
| |||||||||
Equity securities |
|
|
|
| ( |
|
| ( |
|
|
|
| ||||||||
Other invested assets |
|
|
| ( |
| ( |
|
|
|
|
|
| ||||||||
Other assets |
|
|
|
|
|
|
|
|
|
| ||||||||||
Total | $ | $ | $ | ( | $ | ( | $ | $ | ( | $ | ( | $ | $ | $ | ||||||
|
|
|
| Net |
|
|
|
|
|
|
|
|
|
|
|
|
|
|
| Changes in |
|
|
|
| Realized |
|
|
|
|
|
|
|
|
|
|
|
|
|
|
| Unrealized Gains |
|
|
|
| and |
|
|
| Purchases, |
|
|
|
|
|
|
|
|
| Changes in |
| (Losses) Included in |
|
|
| Unrealized |
|
|
| Sales, |
|
|
|
|
|
|
|
|
| Unrealized Gains | Other Comprehensive | ||
|
|
|
| (Gains) |
|
|
| Issuances |
|
|
|
|
|
|
|
|
| (Losses) Included |
| Income (Loss) for |
|
| Fair Value |
| Losses |
| Other |
| and |
| Gross |
| Gross |
|
| Fair Value |
| in Income on |
| Recurring Level 3 | |
|
| Beginning | Included | Comprehensive |
| Settlements, | Transfers | Transfers |
|
|
| End |
| Instruments Held |
| Instruments Held | ||||
(in millions) |
| of Year | in Income | Income (Loss) |
| Net |
| In |
| Out | Other |
| of Year |
| at End of Year |
| at End of Year | |||
Liabilities: |
|
|
|
|
|
|
|
|
|
|
|
|
|
|
|
|
|
|
|
|
Policyholder contract deposits | $ | $ | ( | $ | $ | $ | $ | ( | $ | $ | $ | $ | ||||||||
Derivative liabilities, net: |
|
|
|
|
|
|
|
|
|
|
|
|
|
|
|
|
|
|
|
|
Interest rate contracts |
|
| ( |
|
|
|
|
|
|
|
| |||||||||
Foreign exchange contracts |
| ( |
|
|
|
|
|
|
| ( |
|
| ||||||||
Equity contracts |
| ( |
| ( |
|
| ( |
|
|
|
| ( |
|
| ||||||
Credit contracts |
|
|
|
| ( |
|
|
|
|
|
| |||||||||
Other contracts |
| ( |
| ( |
|
|
|
|
|
| ( |
|
| |||||||
Total derivative liabilities, net(a) |
| ( |
| ( |
|
| ( |
|
|
|
| ( |
|
| ||||||
Fortitude Re funds withheld payable |
|
|
|
| ( |
|
|
|
|
|
| |||||||||
Total | $ | $ | ( | $ | $ | ( | $ | $ | ( | $ | $ | $ | $ | |||||||
AIG | 2021 Form 10-K 205
|
|
|
| Net |
|
|
|
|
|
|
|
|
|
|
|
|
|
|
| Changes in |
|
|
|
| Realized |
|
|
|
|
|
|
|
|
|
|
|
|
|
|
| Unrealized Gains |
|
|
|
| and |
|
|
| Purchases, |
|
|
|
|
|
|
|
|
| Changes in |
| (Losses) Included in |
|
|
|
| Unrealized |
|
|
| Sales, |
|
|
|
|
|
|
|
|
| Unrealized Gains | Other Comprehensive | |
|
|
|
| Gains |
|
|
| Issuances |
|
|
|
|
|
|
|
|
| (Losses) Included |
| Income (Loss) for |
|
| Fair Value |
| (Losses) |
| Other |
| and |
| Gross |
| Gross |
|
|
| Fair Value |
| in Income on |
| Recurring Level 3 |
|
| Beginning |
| Included |
| Comprehensive |
| Settlements, |
| Transfers |
| Transfers |
| Divested |
| End |
| Instruments Held |
| Instruments Held |
(in millions) |
| of Year |
| in Income |
| Income (Loss) |
| Net |
| In |
| Out | Businesses |
| of Year |
| at End of Year |
| at End of Year | |
December 31, 2020 |
|
|
|
|
|
|
|
|
|
|
|
|
|
|
|
|
|
|
|
|
Assets: |
|
|
|
|
|
|
|
|
|
|
|
|
|
|
|
|
|
|
|
|
Bonds available for sale: |
|
|
|
|
|
|
|
|
|
|
|
|
|
|
|
|
|
|
|
|
Obligations of states, |
|
|
|
|
|
|
|
|
|
|
|
|
|
|
|
|
|
|
|
|
municipalities and |
|
|
|
|
|
|
|
|
|
|
|
|
|
|
|
|
|
|
|
|
political subdivisions | $ | $ | $ | $ | $ | $ | ( | $ | $ | $ | $ | |||||||||
Non-U.S. governments |
|
|
|
|
|
| ( |
|
|
|
| |||||||||
Corporate debt |
|
| ( |
|
|
|
| ( |
|
|
|
| ||||||||
RMBS |
|
|
| ( |
| ( |
|
| ( |
|
|
|
| ( | ||||||
CMBS |
|
|
|
| ( |
|
| ( |
|
|
|
| ||||||||
CDO/ABS |
|
|
|
|
|
| ( |
|
|
|
| |||||||||
Total bonds available for sale |
|
|
|
| ( |
|
| ( |
|
|
|
| ||||||||
Other bond securities: |
|
|
|
|
|
|
|
|
|
|
|
|
|
|
|
|
|
|
|
|
RMBS |
|
|
|
| ( |
|
|
|
|
|
| |||||||||
CMBS |
|
|
|
| ( |
|
|
|
|
| ( |
| ||||||||
CDO/ABS |
|
|
|
| ( |
|
|
|
|
|
| |||||||||
Total other bond securities |
|
|
|
| ( |
|
|
|
|
|
| |||||||||
Equity securities |
|
| ( |
|
|
|
| ( |
|
|
|
| ||||||||
Other invested assets |
|
|
| ( |
|
|
|
|
|
|
| |||||||||
Other assets |
|
|
|
|
|
|
| ( |
|
|
| |||||||||
Total | $ | $ | $ | $ | ( | $ | $ | ( | $ | ( | $ | $ | $ | |||||||
|
|
|
| Net |
|
|
|
|
|
|
|
|
|
|
|
|
|
|
| Changes in |
|
|
|
| Realized |
|
|
|
|
|
|
|
|
|
|
|
|
|
|
| Unrealized Gains |
|
|
|
| and |
|
|
| Purchases, |
|
|
|
|
|
|
|
|
| Changes in |
| (Losses) Included in |
|
|
|
| Unrealized |
|
|
| Sales, |
|
|
|
|
|
|
|
|
| Unrealized Gains | Other Comprehensive | |
|
|
|
| (Gains) |
|
|
| Issuances |
|
|
|
|
|
|
|
|
| (Losses) Included |
| Income (Loss) for |
|
| Fair Value |
| Losses |
| Other |
| and |
| Gross |
| Gross |
|
|
| Fair Value |
| in Income on |
| Recurring Level 3 |
|
| Beginning |
| Included |
| Comprehensive |
| Settlements, |
| Transfers |
| Transfers |
| Divested |
| End |
| Instruments Held |
| Instruments Held |
(in millions) |
| of |
| in Income |
| Income (Loss) |
| Net |
| In |
| Out | Businesses |
| of |
| at End of |
| at End of Year | |
Liabilities: |
|
|
|
|
|
|
|
|
|
|
|
|
|
|
|
|
|
|
|
|
Policyholder contract deposits | $ | $ | $ | $ | $ | $ | $ | $ | $ | ( | $ | |||||||||
Derivative liabilities, net: |
|
|
|
|
|
|
|
|
|
|
|
|
|
|
|
|
|
|
|
|
Interest rate contracts |
|
| ( |
|
|
|
|
|
|
|
| |||||||||
Foreign exchange contracts |
| ( |
|
|
|
|
|
|
| ( |
|
| ||||||||
Equity contracts |
| ( |
|
|
| ( |
| ( |
|
|
| ( |
| ( |
| |||||
Credit contracts |
|
| ( |
|
|
|
|
|
|
|
| |||||||||
Other contracts |
| ( |
| ( |
|
|
|
|
|
| ( |
|
| |||||||
Total derivative liabilities, net(a) |
| ( |
| ( |
|
|
| ( |
|
|
| ( |
|
| ||||||
Fortitude Re funds withheld payable |
|
|
|
| ( |
|
|
|
|
| ( |
| ||||||||
Total | $ | $ | $ | $ | $ | ( | $ | $ | $ | $ | ( | $ | ||||||||
206 AIG | 2021 Form 10-K
Net realized and unrealized gains and losses included in income related to Level 3 assets and liabilities shown above are reported in the Consolidated Statements of Income (Loss) as follows:
|
| Net |
|
|
|
|
|
|
|
| Investment |
| Net Realized |
| Other |
|
|
(in millions) |
| Income | Gains (Losses) |
| Income |
| Total | |
December 31, 2021 |
|
|
|
|
|
|
|
|
Assets: |
|
|
|
|
|
|
|
|
Bonds available for sale | $ | $ | ( | $ | $ | |||
Other bond securities |
|
|
|
| ||||
Equity securities |
|
|
|
| ||||
Other invested assets |
|
|
|
| ||||
December 31, 2020 |
|
|
|
|
|
|
|
|
Assets: |
|
|
|
|
|
|
|
|
Bonds available for sale | $ | $ | ( | $ | $ | |||
Other bond securities |
|
|
|
| ||||
Equity securities |
|
| ( |
|
| ( | ||
Other invested assets |
|
|
|
| ||||
|
|
|
|
|
|
|
|
|
|
| Net |
|
|
|
|
|
|
|
| Investment |
| Net Realized |
| Other |
|
|
(in millions) |
| Income | (Gains) Losses |
| Income |
| Total | |
December 31, 2021 |
|
|
|
|
|
|
|
|
Liabilities: |
|
|
|
|
|
|
|
|
Policyholder contract deposits* | $ | $ | ( | $ | $ | ( | ||
Derivative liabilities, net |
|
| ( |
| ( |
| ( | |
Fortitude Re funds withheld payable |
|
|
|
| ||||
December 31, 2020 |
|
|
|
|
|
|
|
|
Liabilities: |
|
|
|
|
|
|
|
|
Policyholder contract deposits* | $ | $ | $ | $ | ||||
Derivative liabilities, net |
|
| ( |
| ( |
| ( | |
Fortitude Re funds withheld payable |
|
|
|
| ||||
* Primarily embedded derivatives.
AIG | 2021 Form 10-K 207
The following table presents the gross components of purchases, sales, issuances and settlements, net, shown above, for years ended December 31, 2021 and 2020 related to Level 3 assets and liabilities in the Consolidated Balance Sheets:
|
|
|
|
|
| Issuances |
| Purchases, Sales, |
|
|
|
|
|
| and |
| Issuances and |
(in millions) |
| Purchases |
| Sales |
| Settlements(a) |
| Settlements, Net(a) |
December 31, 2021 |
|
|
|
|
|
|
|
|
Assets: |
|
|
|
|
|
|
|
|
Bonds available for sale: |
|
|
|
|
|
|
|
|
Obligations of states, municipalities and political subdivisions | $ | $ | ( | $ | ( | $ | ( | |
Non-U.S. governments |
|
|
|
| ||||
Corporate debt |
|
| ( |
| ( |
| ||
RMBS |
|
| ( |
| ( |
| ( | |
CMBS |
|
| ( |
| ( |
| ||
CDO/ABS |
|
|
| ( |
| |||
Total bonds available for sale |
|
| ( |
| ( |
| ||
Other bond securities: |
|
|
|
|
|
|
|
|
Corporate debt |
|
|
|
| ||||
RMBS |
|
| ( |
|
| |||
CMBS |
|
| ( |
|
| ( | ||
CDO/ABS |
|
| ( |
| ( |
| ( | |
Total other bond securities |
|
| ( |
| ( |
| ( | |
Equity securities |
|
| ( |
| ( |
| ( | |
Other invested assets |
|
|
| ( |
| ( | ||
Other assets |
|
|
|
| ||||
Total | $ | $ | ( | $ | ( | $ | ( | |
Liabilities: |
|
|
|
|
|
|
|
|
Policyholder contract deposits | $ | $ | $ | ( | $ | |||
Derivative liabilities, net |
| ( |
|
|
| ( | ||
Fortitude Re funds withheld payable |
|
|
| ( |
| ( | ||
Total | $ | ( | $ | $ | ( | $ | ( | |
December 31, 2020 |
|
|
|
|
|
|
|
|
Assets: |
|
|
|
|
|
|
|
|
Bonds available for sale: |
|
|
|
|
|
|
|
|
Obligations of states, municipalities and political subdivisions | $ | $ | ( | $ | ( | $ | ||
Non-U.S. governments |
|
| ( |
| ( |
| ||
Corporate debt |
|
| ( |
| ( |
| ||
RMBS |
|
| ( |
| ( |
| ( | |
CMBS |
|
| ( |
| ( |
| ( | |
CDO/ABS |
|
| ( |
| ( |
| ||
Total bonds available for sale |
|
| ( |
| ( |
| ( | |
Other bond securities: |
|
|
|
|
|
|
|
|
RMBS |
|
| ( |
| ( |
| ( | |
CMBS |
|
|
| ( |
| ( | ||
CDO/ABS |
|
| ( |
| ( |
| ( | |
Total other bond securities |
|
| ( |
| ( |
| ( | |
Equity securities |
|
| ( |
|
| |||
Other invested assets |
|
|
| ( |
| |||
Other assets |
|
|
|
| ||||
Total | $ | $ | ( | $ | ( | $ | ( | |
Liabilities: |
|
|
|
|
|
|
|
|
Policyholder contract deposits | $ | $ | $ | ( | $ | |||
Derivative liabilities, net |
| ( |
|
|
| |||
Fortitude Re funds withheld payable |
|
|
| ( |
| ( | ||
Total | $ | ( | $ | $ | ( | $ |
208 AIG | 2021 Form 10-K
Both observable and unobservable inputs may be used to determine the fair values of positions classified in Level 3 in the tables above. As a result, the unrealized gains (losses) on instruments held at December 31, 2021 and 2020 may include changes in fair value that were attributable to both observable (e.g., changes in market interest rates) and unobservable inputs (e.g., changes in unobservable long-dated volatilities).
Transfers of Level 3 Assets and Liabilities
The Net realized and unrealized gains (losses) included in income (loss) or Other comprehensive income (loss) as shown in the table above excludes $
Transfers of Level 3 Assets
During the years ended December 31, 2021 and 2020, transfers into Level 3 assets primarily included certain investments in private placement corporate debt, RMBS, CMBS and CDO/ABS. Transfers of private placement corporate debt and certain ABS into Level 3 assets were primarily the result of limited market pricing information that required us to determine fair value for these securities based on inputs that are adjusted to better reflect our own assumptions regarding the characteristics of a specific security or associated market liquidity. The transfers of investments in RMBS, CMBS and CDO and certain ABS into Level 3 assets were due to diminished market transparency and liquidity for individual security types.
During the years ended December 31, 2021 and 2020, transfers out of Level 3 assets primarily included private placement and other corporate debt, CMBS, RMBS, CDO/ABS and certain investments in municipal securities. Transfers of corporate debt, RMBS, CMBS, CDO/ABS and certain investments in municipal securities out of Level 3 assets were based on consideration of market liquidity as well as related transparency of pricing and associated observable inputs for these investments. Transfers of certain investments in private placement corporate debt and certain ABS out of Level 3 assets were primarily the result of using observable pricing information that reflects the fair value of those securities without the need for adjustment based on our own assumptions regarding the characteristics of a specific security or the current liquidity in the market.
Transfers of Level 3 Liabilities
There were no significant transfers of derivative or other liabilities into or out of Level 3 for the years ended December 31, 2021 and 2020.
Divested Businesses
The Level 3 liabilities at December 31, 2020 includes an embedded derivative associated with the funds withheld payable to Fortitude Re that was established as a result of the Majority Interest Fortitude Sale.
AIG | 2021 Form 10-K 209
Quantitative Information about Level 3 Fair Value Measurements
The table below presents information about the significant unobservable inputs used for recurring fair value measurements for certain Level 3 instruments, and includes only those instruments for which information about the inputs is reasonably available to us, such as data from independent third-party valuation service providers. Because input information from third-parties with respect to certain Level 3 instruments (primarily CDO/ABS) may not be reasonably available to us, balances shown below may not equal total amounts reported for such Level 3 assets and liabilities:
|
| Fair Value at |
|
|
|
|
| December 31, | Valuation |
| Range |
(in millions) |
| 2021 | Technique | Unobservable Input(b) | (Weighted Average)(c) |
Assets: |
|
|
|
|
|
|
|
|
|
|
|
Obligations of states, municipalities |
|
|
|
|
|
and political subdivisions | $ | Discounted cash flow | Yield | ||
|
|
|
|
|
|
Corporate debt |
| Discounted cash flow | Yield | ||
|
|
|
|
|
|
RMBS(a) |
| Discounted cash flow | Constant prepayment rate | ||
|
|
|
| Loss severity | |
|
|
|
| Constant default rate | |
|
|
|
| Yield | |
|
|
|
|
|
|
CDO/ABS(a) |
| Discounted cash flow | Yield | ||
|
|
|
|
|
|
CMBS |
| Discounted cash flow | Yield | ||
|
|
|
|
|
|
Liabilities:(d): |
|
|
|
|
|
|
|
|
|
|
|
Embedded derivatives within |
|
|
|
|
|
Policyholder contract deposits: |
|
|
|
|
|
|
|
|
|
|
|
Variable annuity guaranteed |
|
|
|
|
|
minimum withdrawal benefits |
|
|
|
|
|
(GMWB) |
| Discounted cash flow | Equity volatility | ||
|
|
|
| Base lapse rate | |
|
|
|
| Dynamic lapse multiplier | |
|
|
|
| Mortality multiplier(e) | |
|
|
|
| Utilization | |
|
|
|
| Equity / interest rate correlation | |
|
|
|
| NPA(f) | |
|
|
|
|
|
|
Index annuities including certain |
|
|
|
|
|
GMWB |
| Discounted cash flow | Base lapse rate | ||
|
|
|
| Dynamic lapse multiplier | |
|
|
|
| Mortality multiplier(e) | |
|
|
|
| Utilization(g) | |
|
|
|
| Option budget | |
|
|
|
| NPA(f) | |
|
|
|
|
|
|
Indexed life |
| Discounted cash flow | Base lapse rate | ||
|
|
|
| Mortality rate | |
|
|
|
| NPA(f) | |
|
|
|
|
|
|
210 AIG | 2021 Form 10-K
|
|
|
|
|
|
|
| Fair Value at |
|
|
|
|
| December 31, | Valuation |
| Range |
(in millions) |
| 2020 | Technique | Unobservable Input(b) | (Weighted Average)(c) |
Assets: |
|
|
|
|
|
|
|
|
|
|
|
Obligations of states, municipalities |
|
|
|
|
|
and political subdivisions | $ | Discounted cash flow | Yield | ||
|
|
|
|
|
|
Corporate debt |
| Discounted cash flow | Yield | ||
|
|
|
|
|
|
RMBS(a) |
| Discounted cash flow | Constant prepayment rate | ||
|
|
|
| Loss severity | |
|
|
|
| Constant default rate | |
|
|
|
| Yield | |
|
|
|
|
|
|
CDO/ABS(a) |
| Discounted cash flow | Yield | ||
|
|
|
|
|
|
CMBS |
| Discounted cash flow | Yield | ||
|
|
|
|
|
|
Liabilities(d): |
|
|
|
|
|
|
|
|
|
|
|
Embedded derivatives within |
|
|
|
|
|
Policyholder contract deposits: |
|
|
|
|
|
|
|
|
|
|
|
GMWB |
| Discounted cash flow | Equity volatility | ||
|
|
|
| Base lapse rate | |
|
|
|
| Dynamic lapse multiplier | |
|
|
|
| Mortality multiplier(e) | |
|
|
|
| Utilization | |
|
|
|
| Equity / interest rate correlation | |
|
|
|
| NPA(f) | |
|
|
|
|
|
|
Index annuities including certain |
| Discounted cash flow | Base lapse rate | ||
GMWB |
|
|
| Dynamic lapse multiplier | |
|
|
|
| Mortality multiplier(e) | |
|
|
|
| Utilization(g) | |
|
|
|
| Option budget | |
|
|
|
| NPA(f) | |
|
|
|
|
|
|
Indexed life |
| Discounted cash flow | Base lapse rate | ||
|
|
|
| Mortality rate | |
|
|
|
| NPA(f) | |
|
|
|
|
|
|
(a) Information received from third-party valuation service providers. The ranges of the unobservable inputs for constant prepayment rate, loss severity and constant default rate relate to each of the individual underlying mortgage loans that comprise the entire portfolio of securities in the RMBS and CDO securitization vehicles and not necessarily to the securitization vehicle bonds (tranches) purchased by us. The ranges of these inputs do not directly correlate to changes in the fair values of the tranches purchased by us, because there are other factors relevant to the fair values of specific tranches owned by us including, but not limited to, purchase price, position in the waterfall, senior versus subordinated position and attachment points.
(b) Represents discount rates, estimates and assumptions that we believe would be used by market participants when valuing these assets and liabilities.
(c) The weighted averaging for fixed maturity securities is based on the estimated fair value of the securities. Because the valuation methodology for embedded derivatives within Policyholder contract deposits uses a range of inputs that vary at the contract level over the cash flow projection period, management believes that presenting a range, rather than weighted average, is a more meaningful representation of the unobservable inputs used in the valuation.
(d) The Fortitude Re funds withheld payable has been excluded from the above table. As discussed in Note 7, the Fortitude Re funds withheld payable is created through modco and funds withheld reinsurance arrangements where the investments supporting the reinsurance agreements are withheld by, and continue to reside on AIG’s balance sheet. This embedded derivative is valued as a total return swap with reference to the fair value of the invested assets held by AIG. Accordingly, the unobservable inputs utilized in the valuation of the embedded derivative are a component of the invested assets supporting the reinsurance agreements that are held on AIG’s balance sheet.
(e) Mortality inputs are shown as multipliers of the 2012 Individual Annuity Mortality Basic table.
(f) The NPA applied as a spread over risk-free curve for discounting.
(g)
The partial withdrawal utilization unobservable input range shown applies only to policies with guaranteed minimum withdrawal benefit riders that are accounted for as an embedded derivative. The total embedded derivative liability at December 31, 2021 and 2020 was approximately $
AIG | 2021 Form 10-K 211
The ranges of reported inputs for Obligations of states, municipalities and political subdivisions, Corporate debt, RMBS, CDO/ABS, and CMBS valued using a discounted cash flow technique consist of one standard deviation in either direction from the value-weighted average. The preceding table does not give effect to our risk management practices that might offset risks inherent in these Level 3 assets and liabilities.
Interrelationships between Unobservable Inputs
We consider unobservable inputs to be those for which market data is not available and that are developed using the best information available to us about the assumptions that market participants would use when pricing the asset or liability. Relevant inputs vary depending on the nature of the instrument being measured at fair value. The following paragraphs provide a general description of significant unobservable inputs along with interrelationships between and among the significant unobservable inputs and their impact on the fair value measurements. In practice, simultaneous changes in assumptions may not always have a linear effect on the inputs discussed below. Interrelationships may also exist between observable and unobservable inputs. Such relationships have not been included in the discussion below. For each of the individual relationships described below, the inverse relationship would also generally apply.
Fixed Maturity Securities
The significant unobservable input used in the fair value measurement of fixed maturity securities is yield. The yield is affected by the market movements in credit spreads and U.S. Treasury yields. The yield may be affected by other factors including constant prepayment rates, loss severity, and constant default rates. In general, increases in the yield would decrease the fair value of investments, and conversely, decreases in the yield would increase the fair value of investments.
Embedded derivatives within Policyholder contract deposits
Embedded derivatives reported within Policyholder contract deposits include interest crediting rates based on market indices within index annuities, indexed life, and GICs as well as GMWB within variable annuity and certain index annuity products. For any given contract, assumptions for unobservable inputs vary throughout the period over which cash flows are projected for purposes of valuing the embedded derivative. The following unobservable inputs are used for valuing embedded derivatives measured at fair value:
Long-term equity volatilities represent equity volatility beyond the period for which observable equity volatilities are available. Increases in assumed volatility will generally increase the fair value of both the projected cash flows from rider fees as well as the projected cash flows related to benefit payments. Therefore, the net change in the fair value of the liability may be either a decrease or an increase, depending on the relative changes in projected rider fees and projected benefit payments.
Equity / interest rate correlation estimates the relationship between changes in equity returns and interest rates in the economic scenario generator used to value our GMWB embedded derivatives. In general, a higher positive correlation assumes that equity markets and interest rates move in a more correlated fashion, which generally increases the fair value of the liability.
Base lapse rate assumptions are determined by company experience and are adjusted at the contract level using a dynamic lapse function, which reduces the base lapse rate when the contract is in-the-money (when the contract holder’s guaranteed value, as estimated by the company, is worth more than their underlying account value). Lapse rates are also generally assumed to be lower in periods when a surrender charge applies. Increases in assumed lapse rates will generally decrease the fair value of the liability, as fewer policyholders would persist to collect guaranteed withdrawal amounts.
Mortality rate assumptions, which vary by age and gender, are based on company experience and include a mortality improvement assumption. Increases in assumed mortality rates will decrease the fair value of the liability, while lower mortality rate assumptions will generally increase the fair value of the liability, because guaranteed payments will be made for a longer period of time.
Utilization assumptions estimate the timing when policyholders with a GMWB will elect to utilize their benefit and begin taking withdrawals. The assumptions may vary by the type of guarantee, tax-qualified status, the contract’s withdrawal history and the age of the policyholder. Utilization assumptions are based on company experience and other factors, which includes partial withdrawal behavior. Increases in assumed utilization rates will generally increase the fair value of the liability.
Option budget estimates the expected long-term cost of options used to hedge exposures associated with equity price changes. The level of option budgets determines future costs of the options, which impacts the growth in account value and the valuation of embedded derivatives.
Non-performance or “own credit” risk adjustment used in the valuation of embedded derivatives, which reflects a market participant’s view of our claims-paying ability by incorporating a different spread (the NPA spread) to the curve used to discount projected benefit cash flows. When corporate credit spreads widen, the change in the NPA spread generally reduces the fair value of the embedded derivative liabilities, resulting in a gain, and when corporate credit spreads narrow or tighten, the change in the NPA spread generally increases the fair value of the embedded derivative liabilities, resulting in a loss. In addition to changes
212 AIG | 2021 Form 10-K
driven by credit market-related movements in the NPA spread, the NPA balance also reflects changes in business activity and in the net amount at risk from the underlying guaranteed living benefits offered by variable and certain fixed index annuities.
Embedded derivatives within reinsurance contracts
The fair value of embedded derivatives associated with funds withheld reinsurance contracts is determined based upon a total return swap technique with reference to the fair value of the investments held by AIG related to AIG’s funds withheld payable. The fair value of the underlying assets is generally based on market observable inputs using industry standard valuation techniques. The valuation also requires certain significant inputs, which are generally not observable and accordingly, the valuation is considered Level 3 in the fair value hierarchy.
Investments in Certain Entities Carried at Fair Value Using Net Asset Value Per Share
The following table includes information related to our investments in certain other invested assets, including private equity funds, hedge funds and other alternative investments that calculate net asset value per share (or its equivalent). For these investments, which are measured at fair value on a recurring basis, we use the net asset value per share to measure fair value.
|
| December 31, 2021 |
| December 31, 2020 | ||||||
|
|
| Fair Value |
|
|
|
| Fair Value |
|
|
|
|
| Using NAV |
|
|
|
| Using NAV |
|
|
|
|
| Per Share (or |
| Unfunded |
|
| Per Share (or |
| Unfunded |
(in millions) | Investment Category Includes |
| its equivalent) |
| Commitments |
|
| its equivalent) |
| Commitments |
Investment Category |
|
|
|
|
|
|
|
|
|
|
Private equity funds: |
|
|
|
|
|
|
|
|
|
|
Leveraged buyout | Debt and/or equity investments made as part of a transaction in which assets of mature companies are acquired from the current shareholders, typically with the use of financial leverage | $ | $ |
| $ | $ | ||||
|
|
|
|
|
|
|
|
|
|
|
Real assets | Investments in real estate properties, agricultural and infrastructure assets, including power plants and other energy producing assets |
|
|
|
|
| ||||
|
|
|
|
|
|
|
|
|
|
|
Venture capital | Early-stage, high-potential, growth companies expected to generate a return through an eventual realization event, such as an initial public offering or sale of the company |
|
|
|
|
| ||||
|
|
|
|
|
|
|
|
|
|
|
Growth equity | Funds that make investments in established companies for the purpose of growing their businesses |
|
|
|
|
| ||||
|
|
|
|
|
|
|
|
|
|
|
Mezzanine | Funds that make investments in the junior debt and equity securities of leveraged companies |
|
|
|
|
| ||||
|
|
|
|
|
|
|
|
|
|
|
Other | Includes distressed funds that invest in securities of companies that are in default or under bankruptcy protection, as well as funds that have multi-strategy, and other strategies |
|
|
|
|
| ||||
Total private equity funds |
|
|
|
|
| |||||
Hedge funds: |
|
|
|
|
|
|
|
|
|
|
Event-driven | Securities of companies undergoing material structural changes, including mergers, acquisitions and other reorganizations |
|
|
|
|
| ||||
|
|
|
|
|
|
|
|
|
|
|
Long-short | Securities that the manager believes are undervalued, with corresponding short positions to hedge market risk |
|
|
|
|
| ||||
|
|
|
|
|
|
|
|
|
|
|
Macro | Investments that take long and short positions in financial instruments based on a top-down view of certain economic and capital market conditions |
|
|
|
|
| ||||
|
|
|
|
|
|
|
|
|
|
|
Other | Includes investments held in funds that are less liquid, as well as other strategies which allow for broader allocation between public and private investments |
|
|
|
|
| ||||
Total hedge funds |
|
|
|
|
|
| ||||
Total |
| $ | $ |
| $ | $ | ||||
AIG | 2021 Form 10-K 213
Private equity fund investments included above are not redeemable, because distributions from the funds will be received when underlying investments of the funds are liquidated. Private equity funds are generally expected to have
The hedge fund investments included above, which are carried at fair value, are generally redeemable subject to the redemption notices period. The majority of our hedge fund investments are redeemable monthly or quarterly.
Fair Value Option
Under the fair value option, we may elect to measure at fair value financial assets and financial liabilities that are not otherwise required to be carried at fair value. Subsequent changes in fair value for designated items are reported in earnings. We elect the fair value option for certain hybrid securities given the complexity of bifurcating the economic components associated with the embedded derivatives.
For additional information related to embedded derivatives refer to Note 10 herein.
Additionally, we elect the fair value option for certain alternative investments when such investments are eligible for this election. We believe this measurement basis is consistent with the applicable accounting guidance used by the respective investment company funds themselves.
For additional information on securities and other invested assets for which we have elected the fair value option refer to Note 5 herein.
The following table presents the gains or losses recorded related to the eligible instruments for which we elected the fair value option:
Years Ended December 31, | Gain (Loss) | |||||
(in millions) |
| 2021 |
| 2020 |
| 2019 |
Assets: |
|
|
|
|
|
|
Other bond securities | $ | ( | $ | $ | ||
Alternative investments(a) |
|
|
| |||
Liabilities: |
|
|
|
|
|
|
Long-term debt(b) |
|
| ( |
| ( | |
Total gain | $ | $ | $ | |||
(a) Includes certain hedge funds, private equity funds and other investment partnerships.
(b) Includes GIAs, notes, bonds and mortgages payable.
Interest income and dividend income on assets measured under the fair value option are recognized and included in Net investment income in the Consolidated Statements of Income. Interest expense on liabilities measured under the fair value option is reported in Other Income in the Consolidated Statements of Income.
For additional information about our policies for recognition, measurement, and disclosure of interest and dividend income see Note 5 herein.
We calculate the effect of these credit spread changes using discounted cash flow techniques that incorporate current market interest rates, our observable credit spreads on these liabilities and other factors that mitigate the risk of nonperformance such as cash collateral posted.
The following table presents the difference between fair value and the aggregate contractual principal amount of long-term debt for which the fair value option was elected:
| December 31, 2021 |
| December 31, 2020 | ||||||||||
|
|
| Outstanding |
|
|
|
|
| Outstanding |
|
| ||
(in millions) | Fair Value | Principal Amount | Difference |
| Fair Value | Principal Amount | Difference | ||||||
Liabilities: |
|
|
|
|
|
|
|
|
|
|
|
|
|
Long-term debt* | $ | $ | $ |
| $ | $ | $ | ||||||
214 AIG | 2021 Form 10-K
FAIR VALUE MEASUREMENTS ON A NON-RECURRING BASIS
We measure the fair value of certain assets on a non-recurring basis, generally quarterly, annually or when events or changes in circumstances indicate that the carrying amount of the assets may not be recoverable. These assets include cost and equity-method investments, commercial mortgage loans and commercial loans, investments in real estate and other fixed assets, goodwill and other intangible assets.
For additional information about how we test various asset classes for impairment see Notes 5 and 6 herein.
Information regarding the estimation of fair value for financial instruments measured at fair value on a non-recurring basis is discussed below.
Impairments for Other investments primarily relate to real estate investments as well as commercial loans and commercial mortgage loans, the fair value determination for which is discussed above under the heading Valuation Methodologies of Financial Instruments Measured at Fair Value.
The following table presents assets measured at fair value on a non-recurring basis at the time of impairment and the related impairment charges recorded during the periods presented:
|
| Assets at Fair Value |
| Impairment Charges | |||||||||||
|
| Non-Recurring Basis |
| December 31, | |||||||||||
(in millions) |
| Level 1 |
| Level 2 |
| Level 3 |
| Total |
|
| 2021 |
| 2020 |
| 2019 |
December 31, 2021 |
|
|
|
|
|
|
|
|
|
|
|
|
|
|
|
Other investments | $ | $ | $ | $ |
| $ | $ | $ | |||||||
Other assets |
|
|
|
|
|
|
|
| |||||||
Total | $ | $ | $ | $ |
| $ | $ | $ | |||||||
December 31, 2020 |
|
|
|
|
|
|
|
|
|
|
|
|
|
|
|
Other investments | $ | $ | $ | $ |
|
|
|
|
|
|
| ||||
Other assets |
|
|
|
|
|
|
|
|
|
|
| ||||
Total | $ | $ | $ | $ |
|
|
|
|
|
|
| ||||
FAIR VALUE INFORMATION ABOUT FINANCIAL INSTRUMENTS NOT MEASURED AT FAIR VALUE
Information regarding the estimation of fair value for financial instruments not carried at fair value (excluding insurance contracts and lease contracts) is discussed below:
Mortgage and other loans receivable: Fair values of loans on commercial real estate and other loans receivable are estimated for disclosure purposes using discounted cash flow calculations based on discount rates that we believe market participants would use in determining the price that they would pay for such assets. For certain loans, our current incremental lending rates for similar types of loans are used as the discount rates, because we believe this rate approximates the rates market participants would use. Fair values of residential mortgage loans are generally determined based on market prices, using market based adjustments for credit and servicing as appropriate. The fair values of policy loans are generally estimated based on unpaid principal amount as of each reporting date. No consideration is given to credit risk because policy loans are effectively collateralized by the cash surrender value of the policies.
Other invested assets: The majority of the Other invested assets that are not measured at fair value represent time deposits with the original maturity at purchase greater than one year. The fair value of long-term time deposits is determined using the expected discounted future cash flow.
Cash and short-term investments: The carrying amounts of these assets approximate fair values because of the relatively short period of time between origination and expected realization, and their limited exposure to credit risk.
Policyholder contract deposits associated with investment-type contracts: Fair values for policyholder contract deposits associated with investment-type contracts not accounted for at fair value are estimated using discounted cash flow calculations based on interest rates currently being offered for similar contracts with maturities consistent with those of the contracts being valued. When no similar contracts are being offered, the discount rate is the appropriate swap rate (if available) or current risk-free interest rate consistent with the currency in which the cash flows are denominated. To determine fair value, other factors include current policyholder account values and related surrender charges and other assumptions include expectations about policyholder behavior and an appropriate risk margin.
Other liabilities: The majority of Other liabilities that are financial instruments not measured at fair value represent secured financing arrangements, including repurchase agreements. The carrying amounts of these liabilities approximate fair value, because the financing arrangements are short-term and are secured by cash or other liquid collateral.
AIG | 2021 Form 10-K 215
Fortitude Re funds withheld payable: The funds withheld payable contains an embedded derivative and the changes in its fair value are recognized in earnings each period. The difference between the total Fortitude Re funds withheld payable and the embedded derivative represents the host contract.
Long-term debt and Debt of consolidated investment entities: Fair values of these obligations were determined by reference to quoted market prices, when available and appropriate, or discounted cash flow calculations based upon our current market-observable implicit-credit-spread rates for similar types of borrowings with maturities consistent with those remaining for the debt being valued.
Separate Account Liabilities – Investment Contracts: Only the portion of separate account liabilities related to products that are investment contracts are reflected in the table below. Separate account liabilities are recorded at the amount credited to the contract holder, which reflects the change in fair value of the corresponding separate account assets including contract holder deposits less withdrawals and fees; therefore, carrying value approximates fair value.
The following table presents the carrying amounts and estimated fair values of our financial instruments not measured at fair value and indicates the level in the fair value hierarchy of the estimated fair value measurement based on the observability of the inputs used:
| Estimated Fair Value |
| Carrying | |||||||
(in millions) |
| Level 1 |
| Level 2 |
| Level 3 |
| Total |
| Value |
December 31, 2021 |
|
|
|
|
|
|
|
|
|
|
Assets: |
|
|
|
|
|
|
|
|
|
|
Mortgage and other loans receivable | $ | $ | $ | $ | $ | |||||
Other invested assets |
|
|
|
|
| |||||
Short-term investments |
|
|
|
|
| |||||
Cash |
|
|
|
|
| |||||
Other assets |
|
|
|
|
| |||||
Liabilities: |
|
|
|
|
|
|
|
|
|
|
Policyholder contract deposits associated |
|
|
|
|
|
|
|
|
|
|
with investment-type contracts |
|
|
|
|
| |||||
Fortitude Re funds withheld payable |
|
|
|
|
| |||||
Other liabilities |
|
|
|
|
| |||||
Long-term debt |
|
|
|
|
| |||||
Debt of consolidated investment entities |
|
|
|
|
| |||||
Separate account liabilities - investment contracts |
|
|
|
|
| |||||
December 31, 2020 |
|
|
|
|
|
|
|
|
|
|
Assets: |
|
|
|
|
|
|
|
|
|
|
Mortgage and other loans receivable | $ | $ | $ | $ | $ | |||||
Other invested assets |
|
|
|
|
| |||||
Short-term investments |
|
|
|
|
| |||||
Cash |
|
|
|
|
| |||||
Other assets |
|
|
|
|
| |||||
Liabilities: |
|
|
|
|
|
|
|
|
|
|
Policyholder contract deposits associated |
|
|
|
|
|
|
|
|
|
|
with investment-type contracts |
|
|
|
|
| |||||
Fortitude Re funds withheld payable |
|
|
|
|
| |||||
Other liabilities |
|
|
|
|
| |||||
Long-term debt |
|
|
|
|
| |||||
Debt of consolidated investment entities |
|
|
|
|
| |||||
Separate account liabilities - investment contracts |
|
|
|
|
| |||||
216 AIG | 2021 Form 10-K
5. Investments
Fixed Maturity Securities
Bonds held to maturity are carried at amortized cost when we have the ability and positive intent to hold these securities until maturity. When we do not have the ability or positive intent to hold bonds until maturity, these securities are classified as available for sale or are measured at fair value at our election. None of our fixed maturity securities met the criteria for held to maturity classification at December 31, 2021 or 2020.
Unrealized gains and losses from available for sale investments in fixed maturity securities carried at fair value were reported as a separate component of AOCI, net of policy related amounts and deferred income taxes, in shareholders’ equity. Realized and unrealized gains and losses from fixed maturity securities measured at fair value at our election are reflected in Net investment income. Investments in fixed maturity securities are recorded on a trade-date basis.
Interest income is recognized using the effective yield method and reflects amortization of premium and accretion of discount. Premiums and discounts arising from the purchase of bonds classified as available for sale are treated as yield adjustments over their estimated holding periods, until maturity, or call date, if applicable. For investments in certain structured securities, recognized yields are updated based on current information regarding the timing and amount of expected undiscounted future cash flows. For high credit quality structured securities, effective yields are recalculated based on actual payments received and updated prepayment expectations, and the amortized cost is adjusted to the amount that would have existed had the new effective yield been applied since acquisition with a corresponding charge or credit to net investment income. For structured securities that are not high credit quality, the structured securities yields are based on expected cash flows which take into account both expected credit losses and prepayments.
An allowance for credit losses is not established upon initial recognition of the asset (unless the security is determined to be a purchased credit deteriorated (PCD) asset which is discussed in more detail below). Subsequently, differences between actual and expected cash flows and changes in expected cash flows are recognized as adjustments to the allowance for credit losses. Changes that cannot be reflected as adjustments to the allowance for credit losses are accounted for as prospective adjustments to yield.
AIG | 2021 Form 10-K 217
Securities Available for Sale
The following table presents the amortized cost or cost and fair value of our available for sale securities:
December 31, 2021 |
|
|
| Allowance |
| Gross |
| Gross |
|
|
|
| Amortized |
| for Credit |
| Unrealized |
| Unrealized |
| Fair |
(in millions) |
| Cost |
| Losses(a) |
| Gains |
| Losses |
| Value |
Bonds available for sale: |
|
|
|
|
|
|
|
|
|
|
U.S. government and government sponsored entities | $ | $ | $ | $ | ( | $ | ||||
Obligations of states, municipalities and political subdivisions |
|
|
|
| ( |
| ||||
Non-U.S. governments |
|
|
|
| ( |
| ||||
Corporate debt |
|
| ( |
|
| ( |
| |||
Mortgage-backed, asset-backed and collateralized: |
|
|
|
|
|
|
|
|
|
|
RMBS |
|
| ( |
|
| ( |
| |||
CMBS |
|
|
|
| ( |
| ||||
CDO/ABS |
|
|
|
| ( |
| ||||
Total mortgage-backed, asset-backed and collateralized |
|
| ( |
|
| ( |
| |||
Total bonds available for sale(b) | $ | $ | ( | $ | $ | ( | $ | |||
December 31, 2020 |
|
|
|
|
|
|
|
|
|
|
Bonds available for sale: |
|
|
|
|
|
|
|
|
|
|
U.S. government and government sponsored entities | $ | $ | $ | $ | ( | $ | ||||
Obligations of states, municipalities and political subdivisions |
|
|
|
| ( |
| ||||
Non-U.S. governments |
|
| ( |
|
| ( |
| |||
Corporate debt |
|
| ( |
|
| ( |
| |||
Mortgage-backed, asset-backed and collateralized: |
|
|
|
|
|
|
|
|
|
|
RMBS |
|
| ( |
|
| ( |
| |||
CMBS |
|
| ( |
|
| ( |
| |||
CDO/ABS |
|
| ( |
|
| ( |
| |||
Total mortgage-backed, asset-backed and collateralized |
|
| ( |
|
| ( |
| |||
Total bonds available for sale(b) | $ | $ | ( | $ | $ | ( | $ |
Securities Available for Sale in a Loss Position for Which No Allowance for Credit Loss Has Been Recorded
The following table summarizes the fair value and gross unrealized losses on our available for sale securities, aggregated by major investment category and length of time that individual securities have been in a continuous unrealized loss position for which no allowance for credit loss has been recorded:
| Less than 12 Months |
| 12 Months or More |
| Total | |||||||||
|
|
|
| Gross |
|
|
|
| Gross |
|
|
|
| Gross |
|
| Fair |
| Unrealized |
|
| Fair |
| Unrealized |
|
| Fair |
| Unrealized |
(in millions) |
| Value |
| Losses |
|
| Value |
| Losses |
|
| Value |
| Losses |
December 31, 2,021.0 |
|
|
|
|
|
|
|
|
|
|
|
|
|
|
Bonds available for sale: |
|
|
|
|
|
|
|
|
|
|
|
|
|
|
U.S. government and government sponsored entities | $ | $ |
| $ | $ |
| $ | $ | ||||||
Obligations of states, municipalities and political |
|
|
|
|
|
|
|
|
|
|
|
|
|
|
subdivisions |
|
|
|
|
|
|
|
| ||||||
Non-U.S. governments |
|
|
|
|
|
|
|
| ||||||
Corporate debt |
|
|
|
|
|
|
|
| ||||||
RMBS |
|
|
|
|
|
|
|
| ||||||
CMBS |
|
|
|
|
|
|
|
| ||||||
CDO/ABS |
|
|
|
|
|
|
|
| ||||||
Total bonds available for sale | $ | $ |
| $ | $ |
| $ | $ | ||||||
218 AIG | 2021 Form 10-K
December 31, 2020 |
|
|
|
|
|
|
|
|
|
|
|
|
|
|
Bonds available for sale: |
|
|
|
|
|
|
|
|
|
|
|
|
|
|
U.S. government and government sponsored entities | $ | $ |
| $ | $ |
| $ | $ | ||||||
Obligations of states, municipalities and political |
|
|
|
|
|
|
|
|
|
|
|
|
|
|
subdivisions |
|
|
|
|
|
|
|
| ||||||
Non-U.S. governments |
|
|
|
|
|
|
|
| ||||||
Corporate debt |
|
|
|
|
|
|
|
| ||||||
RMBS |
|
|
|
|
|
|
|
| ||||||
CMBS |
|
|
|
|
|
|
|
| ||||||
CDO/ABS |
|
|
|
|
|
|
|
| ||||||
Total bonds available for sale | $ | $ |
| $ | $ |
| $ | $ |
At December 31, 2021, we held
Contractual Maturities of Fixed Maturity Securities Available for Sale
The following table presents the amortized cost and fair value of fixed maturity securities available for sale by contractual maturity:
| Total Fixed Maturity Securities | |||
| Available for Sale | |||
|
| Amortized Cost, |
|
|
(in millions) |
| Net of Allowance |
| Fair Value |
December 31, 2021 |
|
|
|
|
Due in one year or less | $ | $ | ||
Due after one year through five years |
|
| ||
Due after five years through ten years |
|
| ||
Due after ten years |
|
| ||
Mortgage-backed, asset-backed and collateralized |
|
| ||
Total | $ | $ | ||
| Years Ended December 31, | |||||||||||
|
| 2021 |
| 2020 |
| 2019 | ||||||
|
| Gross |
| Gross |
| Gross |
| Gross | Gross | Gross | ||
| Realized | Realized | Realized | Realized | Realized | Realized | ||||||
(in millions) |
| Gains |
| Losses |
| Gains |
| Losses | Gains | Losses | ||
Fixed maturity securities | $ | $ | $ | $ | $ | $ | ||||||
For the years ended December 31, 2021 and 2020, the aggregate fair value of available for sale securities sold was $
AIG | 2021 Form 10-K 219
For the year ended December 31, 2019, the aggregate fair value of available for sale securities sold was $
Other Securities Measured at Fair Value
The following table presents the fair value of fixed maturity securities measured at fair value based on our election of the fair value option, which are reported in the other bond securities caption in the financial statements, and equity securities measured at fair value:
|
| December 31, 2021 |
|
|
| December 31, 2020 |
| ||
|
| Fair | Percent |
|
|
| Fair | Percent |
|
(in millions) |
| Value | of Total |
|
|
| Value | of Total |
|
Fixed maturity securities: |
|
|
|
|
|
|
|
|
|
U.S. government and government sponsored entities | $ | % |
| $ | % | ||||
Obligations of states, municipalities and political subdivisions |
|
|
|
|
| ||||
Non-U.S. governments |
|
|
|
|
| ||||
Corporate debt |
|
|
|
|
| ||||
Mortgage-backed, asset-backed and collateralized: |
|
|
|
|
|
|
|
|
|
RMBS |
|
|
|
|
| ||||
CMBS |
|
|
|
|
| ||||
CDO/ABS and other collateralized |
|
|
|
|
| ||||
Total mortgage-backed, asset-backed and collateralized |
|
|
|
|
| ||||
Total fixed maturity securities |
|
|
|
|
| ||||
Equity securities |
|
|
|
|
| ||||
Total | $ | % |
| $ | % | ||||
Other Invested Assets
The following table summarizes the carrying amounts of other invested assets:
|
| December 31, |
| December 31, |
(in millions) |
| 2021 |
| 2020 |
Alternative investments(a) (b) | $ | $ | ||
Investment real estate(c) |
|
| ||
All other investments(d) |
|
| ||
Total | $ | $ |
(b)
At December 31, 2021, approximately
(c)
Represents values net of accumulated depreciation. At December 31, 2021 and 2020, the accumulated depreciation was $
(d)
Includes AIG’s
Other Invested Assets Carried at Fair Value
Certain hedge funds, private equity funds, and other investment partnerships for which we have elected the fair value option are reported at fair value with changes in fair value recognized in Net investment income.
220 AIG | 2021 Form 10-K
Other Invested Assets – Equity Method Investments
We account for hedge funds, private equity funds, affordable housing partnerships and other investment partnerships using the equity method of accounting unless our interest is so minor that we may have virtually no influence over partnership operating and financial policies, or we have elected the fair value option. Under the equity method of accounting, our carrying amount generally is our share of the net asset value of the funds or the partnerships, and changes in our share of the net asset values are recorded in Net investment income. In applying the equity method of accounting, we consistently use the most recently available financial information provided by the general partner or manager of each of these investments. Hedge funds are reported as of the balance sheet date. Private equity funds are generally reported on a one-quarter lag. The financial statements of these investees are generally audited annually.
Summarized Financial Information of Equity Method Investees
The following is the aggregated summarized financial information of our equity method investees, including those for which the fair value option has been elected:
Years Ended December 31, |
|
|
|
|
|
|
|
(in millions) |
|
| 2021 |
| 2020 |
| 2019 |
Operating results: |
|
|
|
|
|
|
|
Total revenues |
| $ | $ | $ | |||
Total expenses |
|
| ( |
| ( |
| ( |
Net income |
| $ | $ | $ | |||
At December 31, |
|
|
|
|
|
|
|
(in millions) |
|
|
|
| 2021 |
| 2020 |
Balance sheet: |
|
|
|
|
|
|
|
Total assets |
|
|
| $ | $ | ||
Total liabilities |
|
|
| $ | ( | $ | ( |
|
| 2021 |
|
| 2020 |
| ||||
|
| Carrying |
| Ownership |
|
| Carrying |
| Ownership |
|
(in millions) |
| Value |
| Percentage |
|
| Value |
| Percentage |
|
Equity method investments | $ |
| Various |
| $ |
| Various |
| ||
Summarized financial information for these equity method investees may be presented on a lag, due to the unavailability of information for the investees at our respective balance sheet dates, and is included for the periods in which we held an equity method ownership interest.
Other Investments
Also included in Other invested assets are real estate held for investment. These investments are reported at cost, less depreciation and are subject to impairment review, as discussed below.
Net Investment Income
Net investment income represents income primarily from the following sources:
Interest income and related expenses, including amortization of premiums and accretion of discounts with changes in the timing and the amount of expected principal and interest cash flows reflected in yield, as applicable.
Dividend income from common and preferred stocks.
Realized and unrealized gains and losses from investments in other securities and investments for which we elected the fair value option.
Earnings from alternative investments.
Prepayment premiums.
AIG | 2021 Form 10-K 221
The following table presents the components of Net investment income:
Years Ended December 31, | 2021 |
| 2020 |
| 2019 | |||||||||||
|
| Excluding | Fortitude Re |
|
|
| Excluding | Fortitude Re |
|
|
|
|
| |||
| Fortitude | Funds |
|
|
| Fortitude | Funds |
|
|
|
|
| ||||
| Re Funds | Withheld |
|
|
| Re Funds | Withheld |
|
|
| ||||||
(in millions) | Withheld Assets | Assets | Total |
| Withheld Assets | Assets | Total |
| Total | |||||||
Available for sale fixed maturity securities, |
|
|
|
|
|
|
|
|
|
|
|
|
|
|
|
|
including short-term investments | $ | $ | $ |
| $ | $ | $ |
| $ | |||||||
Other fixed maturity securities(a) |
| ( |
|
| ( |
|
|
|
|
|
| |||||
Equity securities |
| ( |
|
| ( |
|
|
|
|
|
| |||||
Interest on mortgage and other loans |
|
|
|
|
|
|
|
|
| |||||||
Alternative investments(b) |
|
|
|
|
|
|
|
|
| |||||||
Real estate |
|
|
|
|
|
|
|
|
| |||||||
Other investments(c) |
|
|
|
|
| ( |
|
| ( |
|
| ( | ||||
Total investment income |
|
|
|
|
|
|
|
|
| |||||||
Investment expenses |
|
|
|
|
|
|
|
|
| |||||||
Net investment income | $ | $ | $ |
| $ | $ | $ |
| $ | |||||||
(b) Included income from hedge funds, private equity funds and affordable housing partnerships. Hedge funds are recorded as of the balance sheet date. Private equity funds are generally reported on a one-quarter lag.
(c)
Included in the years ended December 31, 2021, 2020 and 2019 was income (loss) of $
Net Realized Gains and Losses
Net realized gains and losses are determined by specific identification. The net realized gains and losses are generated primarily from the following sources:
Sales of available for sale fixed maturity securities, real estate and other alternative investments.
Reductions to the amortized cost basis of available for sale fixed maturity securities that have been written down due to our intent to sell them or it being more likely than not that we will be required to sell them.
Changes in the allowance for credit losses on bonds available for sale, mortgage and other loans receivable, and loans commitments.
Changes in fair value of free standing and embedded derivatives, including changes in the non-performance adjustment, except for those instruments that are designated as hedging instruments when the change in the fair value of the hedged item is not reported in Net realized gains (losses).
Foreign exchange gains and losses resulting from foreign currency transactions.
Changes in fair value of the embedded derivative related to the Fortitude Re funds withheld assets.
222 AIG | 2021 Form 10-K
The following table presents the components of Net realized gains (losses):
Years Ended December 31, | 2021 |
| 2020 |
| 2019 | |||||||||||
| Excluding | Fortitude Re |
|
|
| Excluding | Fortitude Re |
|
|
|
|
| ||||
| Fortitude Re | Funds |
|
|
| Fortitude Re |
| Funds |
|
|
|
|
| |||
| Funds | Withheld |
|
|
| Funds | Withheld |
|
|
|
|
| ||||
(in millions) | Withheld Assets | Assets |
| Total |
| Withheld Assets |
| Assets |
| Total |
|
| Total | |||
Sales of fixed maturity securities | $ | $ | $ |
| $ | $ | $ |
| $ | |||||||
Other-than-temporary impairments |
|
|
|
|
|
|
|
|
| ( | ||||||
Intent to sell(a) |
|
|
|
|
| ( |
|
| ( |
|
| |||||
Change in allowance for credit losses on |
|
|
|
|
|
|
|
|
|
|
|
|
|
|
|
|
fixed maturity securities |
|
|
|
|
| ( |
| ( |
| ( |
|
| ||||
Change in allowance for credit losses on |
|
|
|
|
|
|
|
|
|
|
|
|
|
|
|
|
loans |
|
|
|
|
| ( |
|
| ( |
|
| ( | ||||
Foreign exchange transactions |
|
| ( |
|
|
|
|
|
|
| ||||||
Variable annuity embedded derivatives, |
|
|
|
|
|
|
|
|
|
|
|
|
|
|
|
|
net of related hedges |
| ( |
|
| ( |
|
|
|
|
|
| ( | ||||
All other derivatives and hedge accounting |
|
|
|
|
| ( |
| ( |
| ( |
|
| ( | |||
Other(b) |
|
|
|
|
|
|
|
|
| |||||||
Net realized gains – excluding |
|
|
|
|
|
|
|
|
|
|
|
|
|
|
|
|
Fortitude Re funds withheld |
|
|
|
|
|
|
|
|
|
|
|
|
|
|
|
|
embedded derivative |
|
|
|
|
| ( |
|
|
|
| ||||||
Net realized gains (losses) on Fortitude Re |
|
|
|
|
|
|
|
|
|
|
|
|
|
|
|
|
funds withheld embedded derivative |
|
| ( |
| ( |
|
|
| ( |
| ( |
|
| |||
Net realized gains (losses) | $ | $ | $ |
| $ | ( | $ | ( | $ | ( |
| $ | ||||
Change in Unrealized Appreciation (Depreciation) of Investments
The following table presents the increase (decrease) in unrealized appreciation (depreciation) of our available for sale securities and other investments:
Years Ended December 31, |
|
|
|
|
(in millions) |
| 2021 |
| 2020 |
Increase (decrease) in unrealized appreciation (depreciation) of investments: |
|
|
|
|
Fixed maturity securities | $ | ( | $ | |
Other investments |
|
| ||
Total increase (decrease) in unrealized appreciation (depreciation) of investments | $ | ( | $ |
Years Ended December 31, | 2021 |
| 2020 | ||||||||||
|
|
|
| Other |
|
|
|
|
|
| Other |
|
|
|
|
| Invested |
|
|
|
|
| Invested |
|
| ||
(in millions) | Equities |
| Assets |
| Total |
| Equities |
| Assets |
| Total | ||
Net gains (losses) recognized during the period on equity securities and other |
|
|
|
|
|
|
|
|
|
|
|
|
|
investments | $ | ( | $ | $ |
| $ | $ | $ | |||||
Less: Net gains (losses) recognized during the period on equity securities and |
|
|
|
|
|
|
|
|
|
|
|
|
|
other investments sold during the year |
| ( |
|
| ( |
|
| ( |
|
| |||
Unrealized gains (losses) recognized during the reporting period on |
|
|
|
|
|
|
|
|
|
|
|
|
|
equity securities and other investments still held at the reporting date | $ | ( | $ | $ |
| $ | $ | $ | |||||
AIG | 2021 Form 10-K 223
Evaluating Investments for AN ALLOWANCE FOR CREDIT LOSSES/OTHER-than-TEMPORARY IMPAIRMENTS
Fixed Maturity Securities
Subsequent to the adoption of the Financial Instruments Credit Losses Standard on January 1, 2020
If we intend to sell a fixed maturity security or it is more likely than not that we will be required to sell a fixed maturity security before recovery of its amortized cost basis and if the fair value of the security is below amortized cost, an impairment has occurred and the amortized cost is written down to current fair value, with a corresponding charge to Net realized gains (losses). No allowance is established in these situations and any previously recorded allowance is reversed. The new cost basis is not adjusted for subsequent increases in estimated fair value. When assessing our intent to sell a fixed maturity security, or whether it is more likely than not that we will be required to sell a fixed maturity security before recovery of its amortized cost basis, management evaluates relevant facts and circumstances including, but not limited to, decisions to reposition our investment portfolio, sales of securities to meet cash flow needs and sales of securities to take advantage of favorable pricing.
For fixed maturity securities for which a decline in the fair value below the amortized cost is due to credit related factors, an allowance is established for the difference between the estimated recoverable value and amortized cost with a corresponding charge to Net realized gains (losses). The allowance for credit losses is limited to the difference between amortized cost and fair value. The estimated recoverable value is the present value of cash flows expected to be collected, as determined by management. The difference between fair value and amortized cost that is not associated with credit related factors is presented in unrealized appreciation (depreciation) of fixed maturity securities on which an allowance for credit losses was previously recognized (a separate component of AOCI). Accrued interest is excluded from the measurement of the allowance for credit losses.
When estimating future cash flows for structured fixed maturity securities (e.g., RMBS, CMBS, CDO, ABS) management considers the historical performance of underlying assets and available market information as well as bond-specific structural considerations, such as credit enhancement and the priority of payment structure of the security. In addition, the process of estimating future cash flows includes, but is not limited to, the following critical inputs, which vary by asset class:
Current delinquency rates;
Expected default rates and the timing of such defaults;
Loss severity and the timing of any recovery; and
Expected prepayment speeds.
When estimating future cash flows for corporate, municipal and sovereign fixed maturity securities determined to be credit impaired, management considers:
Expected default rates and the timing of such defaults;
Loss severity and the timing of any recovery; and
Scenarios specific to the issuer and the security, which may also include estimates of outcomes of corporate restructurings, political and macroeconomic factors, stability and financial strength of the issuer, the value of any secondary sources of repayment and the disposition of assets.
We consider severe price declines in our assessment of potential credit impairments. We may also modify our model inputs when we determine that price movements in certain sectors are indicative of factors not captured by the cash flow models.
Under the current expected credit loss (CECL) model, credit losses are reassessed each period. The allowance for credit losses and the corresponding charge to Net realized gains (losses) can be reversed if conditions change, however, the allowance for credit losses will never be reduced below zero. When we determine that all or a portion of a fixed maturity security is uncollectable, the uncollectable amortized cost amount is written off with a corresponding reduction to the allowance for credit losses. If we collect cash flows that were previously written off, the recovery is recognized by recording a gain in Net realized gains (losses).
Prior to the adoption of the Financial Instruments Credit Losses Standard on January 1, 2020
If we intend to sell a fixed maturity security or it is more likely than not that we will be required to sell a fixed maturity security before recovery of its amortized cost basis and the fair value of the security is below amortized cost, an other-than-temporary impairment has occurred and the amortized cost is written down to current fair value, with a corresponding charge to realized losses. When assessing our intent to sell a fixed maturity security, or whether it is more likely than not that we will be required to sell a fixed maturity security before recovery of its amortized cost basis, management evaluates relevant facts and circumstances including, but not limited to,
224 AIG | 2021 Form 10-K
decisions to reposition our investment portfolio, sales of securities to meet cash flow needs and sales of securities to take advantage of favorable pricing.
For fixed maturity securities for which a credit impairment has occurred, the amortized cost is written down to the estimated recoverable value with a corresponding charge to realized losses. The estimated recoverable value is the present value of cash flows expected to be collected, as determined by management. The difference between fair value and amortized cost that is not related to a credit impairment is presented in unrealized appreciation (depreciation) of fixed maturity securities on which other-than-temporary credit impairments were recognized (a separate component of accumulated other comprehensive income).
We consider severe price declines in our assessment of potential credit impairments. We may also modify our model inputs when we determine that price movements in certain sectors are indicative of factors not captured by the cash flow models.
In periods subsequent to the recognition of an other-than-temporary impairment charge for available for sale fixed maturity securities that is not foreign exchange related, we prospectively accrete into earnings the difference between the new amortized cost and the expected undiscounted recoverable value over the remaining expected holding period of the security.
Credit Impairments
The following table presents a rollforward of the changes in allowance for credit losses on available for sale fixed maturity securities by major investment category:
Years Ended December 31, | 2021 |
| 2020 | ||||||||||
|
|
|
| Non- |
|
|
|
|
|
| Non- |
|
|
(in millions) | Structured | Structured |
| Total |
| Structured | Structured |
| Total | ||||
Balance, beginning of year* | $ | $ | $ |
| $ | $ | $ | ||||||
Additions: |
|
|
|
|
|
|
|
|
|
|
|
|
|
Securities for which allowance for credit losses were not previously recorded |
|
|
|
|
|
|
| ||||||
Purchases of available for sale debt securities accounted for as purchased |
|
|
|
|
|
|
|
|
|
|
|
|
|
credit deteriorated assets |
|
|
|
|
|
|
| ||||||
Accretion of available for sale debt securities accounted for as purchased |
|
|
|
|
|
|
|
|
|
|
|
|
|
credit deteriorated assets |
|
|
|
|
|
|
| ||||||
Reductions: |
|
|
|
|
|
|
|
|
|
|
|
|
|
Securities sold during the period |
| ( |
| ( |
| ( |
|
| ( |
| ( |
| ( |
Addition to (release of) the allowance for credit losses on securities that |
|
|
|
|
|
|
|
|
|
|
|
|
|
had an allowance recorded in a previous period, for which there was |
|
|
|
|
|
|
|
|
|
|
|
|
|
no intent to sell before recovery of amortized cost basis |
| ( |
| ( |
| ( |
|
| ( |
|
| ( | |
Write-offs charged against the allowance |
|
| ( |
| ( |
|
|
| ( |
| ( | ||
Balance, end of year | $ | $ | $ |
| $ | $ | $ | ||||||
The following table presents a rollforward of the cumulative credit losses in other-than-temporary impairments recognized in earnings for available for sale fixed maturity securities:
Year Ended December 31, |
|
|
|
|
(in millions) |
|
|
| 2019 |
Balance, beginning of year |
|
| $ | |
Increases due to: |
|
|
|
|
Credit impairments on new securities subject to impairment losses |
|
|
| |
Additional credit impairments on previously impaired securities |
|
|
| |
Reductions due to: |
|
|
|
|
Credit impaired securities fully disposed for which there was no prior intent or requirement to sell |
|
|
| ( |
Accretion on securities previously impaired due to credit* |
|
|
| ( |
Balance, end of year |
|
| $ |
AIG | 2021 Form 10-K 225
Other Invested Assets
Our equity method investments in private equity funds, hedge funds and other entities are evaluated for impairment each reporting period. Such evaluation considers market conditions, events and volatility that may impact the recoverability of the underlying investments within these private equity funds and hedge funds and is based on the nature of the underlying investments and specific inherent risks. Such risks may evolve based on the nature of the underlying investments.
Our investments in real estate are periodically evaluated for recoverability whenever changes in circumstances indicate the carrying amount of an asset may be impaired. When impairment indicators are present, we compare expected investment cash flows to carrying amount. When the expected cash flows are less than the carrying amount, the investments are written down to fair value with a corresponding charge to earnings.
Purchased Credit Deteriorated Securities
We purchase certain RMBS securities that have experienced more-than-insignificant deterioration in credit quality since origination. These are referred to as PCD assets. At the time of purchase an allowance is recognized for these PCD assets by adding it to the purchase price to arrive at the initial amortized cost. There is no credit loss expense recognized upon acquisition of a PCD asset. When determining the initial allowance for credit losses, management considers the historical performance of underlying assets and available market information as well as bond-specific structural considerations, such as credit enhancement and the priority of payment structure of the security. In addition, the process of estimating future cash flows includes, but is not limited to, the following critical inputs:
Current delinquency rates;
Expected default rates and the timing of such defaults;
Loss severity and the timing of any recovery; and
Expected prepayment speeds.
Subsequent to the acquisition date, the PCD assets follow the same accounting as other structured securities that are not high credit quality.
We did not purchase securities with more than insignificant credit deterioration since their origination during 2021. During the twelve-month period ended December 31, 2020, we purchased certain securities which had more than insignificant credit deterioration since their origination. These PCD securities are held in the portfolio of bonds available for sale in their natural classes at December 31, 2020.
The following table presents a reconciliation of the purchase price to the unpaid principal balance at the acquisition date of the PCD securities that were purchased with credit deterioration:
Years Ended December 31, |
|
|
|
|
(in millions) |
| 2021 |
| 2020 |
Unpaid principal balance | $ | $ | ||
Allowance for expected credit losses at acquisition |
|
| ( | |
Purchase (discount) premium |
|
| ( | |
Purchase price | $ | $ |
Pledged Investments
Secured Financing and Similar Arrangements
We enter into secured financing transactions whereby certain securities are sold under agreements to repurchase (repurchase agreements), in which we transfer securities in exchange for cash, with an agreement by us to repurchase the same or substantially similar securities. Our secured financing transactions also include those that involve the transfer of securities to financial institutions in exchange for cash (securities lending agreements). In all of these secured financing transactions, the securities transferred by us (pledged collateral) may be sold or repledged by the counterparties. These agreements are recorded at their contracted amounts plus accrued interest, other than those that are accounted for at fair value.
226 AIG | 2021 Form 10-K
Pledged collateral levels are monitored daily and are generally maintained at an agreed-upon percentage of the fair value of the amounts borrowed during the life of the transactions. In the event of a decline in the fair value of the pledged collateral under these secured financing transactions, we may be required to transfer cash or additional securities as pledged collateral under these agreements. At the termination of the transactions, we and our counterparties are obligated to return the amounts borrowed and the securities transferred, respectively.
The following table presents the fair value of securities pledged to counterparties under secured financing transactions, including repurchase and securities lending agreements:
(in millions) |
| December 31, 2021 |
| December 31, 2020 |
Fixed maturity securities available for sale | $ | $ |
At December 31, 2021 and 2020, amounts borrowed under repurchase and securities lending agreements totaled $
The following table presents the fair value of securities pledged under our repurchase agreements by collateral type and by remaining contractual maturity:
| Remaining Contractual Maturity of the Agreements | |||||||||||
|
| Overnight |
| up to |
|
|
|
|
|
|
|
|
|
| and |
| 30 |
| 31 - 90 |
| 91 - 364 |
| 365 days |
|
|
(in millions) |
| Continuous |
| days |
| days |
| days |
| or greater |
| Total |
December 31, 2021 |
|
|
|
|
|
|
|
|
|
|
|
|
Bonds available for sale: |
|
|
|
|
|
|
|
|
|
|
|
|
Non-U.S. governments | $ | $ | $ | $ | $ | $ | ||||||
Corporate debt |
|
|
|
|
|
| ||||||
Total | $ | $ | $ | $ | $ | $ | ||||||
December 31, 2020 |
|
|
|
|
|
|
|
|
|
|
|
|
Bonds available for sale: |
|
|
|
|
|
|
|
|
|
|
|
|
Non-U.S. governments | $ | $ | $ | $ | $ | $ | ||||||
Corporate debt |
|
|
|
|
|
| ||||||
Total | $ | $ | $ | $ | $ | $ | ||||||
| Remaining Contractual Maturity of the Agreements | |||||||||||
|
| Overnight |
| up to |
|
|
|
|
|
|
|
|
|
| and |
| 30 |
| 31 - 90 |
| 91 - 364 |
| 365 days |
|
|
(in millions) |
| Continuous |
| days |
| days |
| days |
| or greater |
| Total |
December 31, 2021 |
|
|
|
|
|
|
|
|
|
|
|
|
Bonds available for sale: |
|
|
|
|
|
|
|
|
|
|
|
|
Obligations of states, municipalities and political |
|
|
|
|
|
|
|
|
|
|
|
|
subdivisions | $ | $ | $ | $ | $ | $ | ||||||
Non-U.S. governments |
|
|
|
|
|
| ||||||
Corporate debt |
|
|
|
|
|
| ||||||
Total | $ | $ | $ | $ | $ | $ | ||||||
|
|
|
|
|
|
|
|
|
|
|
|
|
December 31, 2020 |
|
|
|
|
|
|
|
|
|
|
|
|
Bonds available for sale: |
|
|
|
|
|
|
|
|
|
|
|
|
Obligations of states, municipalities and political |
|
|
|
|
|
|
|
|
|
|
|
|
subdivisions | $ | $ | $ | $ | $ | $ | ||||||
Corporate debt |
|
|
|
|
|
| ||||||
Total | $ | $ | $ | $ | $ | $ | ||||||
AIG | 2021 Form 10-K 227
The following table presents information on the fair value of securities pledged to us under reverse repurchase agreements:
(in millions) |
| December 31, 2021 |
| December 31, 2020 |
Securities collateral pledged to us | $ | $ |
At December 31, 2021 and December 31, 2020, the carrying value of reverse repurchase agreements totaled $
We do not currently offset any secured financing transactions. All such transactions are collateralized and margined on a daily basis consistent with market standards and subject to enforceable master netting arrangements with rights of set off.
Insurance – Statutory and Other Deposits
The total carrying value of cash and securities deposited by our insurance subsidiaries under requirements of regulatory authorities or other insurance-related arrangements, including certain annuity-related obligations and certain reinsurance contracts, was $
Other Pledges and Restrictions
Certain of our subsidiaries are members of Federal Home Loan Banks (FHLBs) and such membership requires the members to own stock in these FHLBs. We owned an aggregate of $
Certain GIAs have provisions that require collateral to be posted or payments to be made by us upon a downgrade of our long-term debt ratings. The actual amount of collateral required to be posted to the counterparties in the event of such downgrades, and the aggregate amount of payments that we could be required to make, depend on market conditions, the fair value of outstanding affected transactions and other factors prevailing at and after the time of the downgrade. The fair value of securities pledged as collateral with respect to these obligations was approximately $
Investments held in escrow accounts or otherwise subject to restriction as to their use were $
Reinsurance transactions between AIG and Fortitude Re were structured as modco and loss portfolio transfer arrangements with funds withheld. Following closing of the Majority Interest Fortitude Sale, a portion of the proceeds were contributed to AIG subsidiaries.
For additional information on the sale of Fortitude Holdings see Note 1 and Note 7.
6. Lending Activities
Direct costs of originating commercial mortgages, commercial loans, and other loans and notes receivable, net of nonrefundable points and fees, are deferred and included in the carrying amount of the related receivables. The amount deferred is amortized to income as an adjustment to earnings using the interest method. Premiums and discounts on purchased residential mortgages are also amortized to income as an adjustment to earnings using the interest method.
228 AIG | 2021 Form 10-K
Life insurance policy loans are carried at unpaid principal balances. There is no allowance for policy loans because these loans serve to reduce the death benefit paid when the death claim is made and the balances are effectively collateralized by the cash surrender value of the policy.
The following table presents the composition of Mortgage and other loans receivable, net:
| December 31, |
| December 31, | |
(in millions) |
| 2021 |
| 2020 |
Commercial mortgages(a) | $ | $ | ||
Residential mortgages |
|
| ||
Life insurance policy loans |
|
| ||
Commercial loans, other loans and notes receivable(b) |
|
| ||
Total mortgage and other loans receivable |
|
| ||
Allowance for credit losses(c) |
| ( |
| ( |
Mortgage and other loans receivable, net | $ | $ | ||
(a)
Commercial mortgages primarily represent loans for apartments, offices and retail properties, with exposures in New York and California representing the largest geographic concentrations (aggregating approximately
(b)
Includes loans held for sale which are carried at lower of cost or market and are collateralized primarily by hotels. As of December 31, 2021, the net carrying value of these loans was $
(c)
Does not include allowance for credit losses of $
Interest income is not accrued when payment of contractual principal and interest is not expected. Any cash received on impaired loans is generally recorded as a reduction of the current carrying amount of the loan. Accrual of interest income is generally resumed when delinquent contractual principal and interest is repaid or when a portion of the delinquent contractual payments are made and the ongoing required contractual payments have been made for an appropriate period. As of December 31, 2021, $
Accrued interest is presented separately and is included in Other assets on the Consolidated Balance Sheets. As of December 31, 2021, accrued interest receivable was $
A significant majority of commercial mortgages in the portfolio are non-recourse loans and, accordingly, the only guarantees are for specific items that are exceptions to the non-recourse provisions. It is therefore extremely rare for us to have cause to enforce the provisions of a guarantee on a commercial real estate or mortgage loan.
Nonperforming loans are generally those loans where payment of contractual principal or interest is more than 90 days past due. Nonperforming loans were not significant for any of the periods presented.
Credit Quality of Commercial Mortgages
The following table presents debt service coverage ratios(a) for commercial mortgages by year of vintage:
December 31, 2021 |
|
|
|
|
|
|
|
|
|
|
|
|
|
|
(in millions) |
| 2021 |
| 2020 |
| 2019 |
| 2018 |
| 2017 |
| Prior |
| Total |
>1.2X | $ | $ | $ | $ | $ | $ | $ | |||||||
1.00 - 1.20X |
|
|
|
|
|
|
| |||||||
<1.00X |
|
|
|
|
|
|
| |||||||
Total commercial mortgages | $ | $ | $ | $ | $ | $ | $ | |||||||
|
|
|
|
|
|
|
|
|
|
|
|
|
|
|
December 31, 2020 |
|
|
|
|
|
|
|
|
|
|
|
|
|
|
(in millions) |
| 2020 |
| 2019 |
| 2018 |
| 2017 |
| 2016 |
| Prior |
| Total |
>1.2X | $ | $ | $ | $ | $ | $ | $ | |||||||
1.00 - 1.20X |
|
|
|
|
|
|
| |||||||
<1.00X |
|
|
|
|
|
|
| |||||||
Total commercial mortgages | $ | $ | $ | $ | $ | $ | $ |
AIG | 2021 Form 10-K 229
December 31, 2021 |
|
|
|
|
|
|
|
|
|
|
|
|
|
|
(in millions) |
| 2021 |
| 2020 |
| 2019 |
| 2018 |
| 2017 |
| Prior |
| Total |
Less than 65% | $ | $ | $ | $ | $ | $ | $ | |||||||
65% to 75% |
|
|
|
|
|
|
| |||||||
76% to 80% |
|
|
|
|
|
|
| |||||||
Greater than 80% |
|
|
|
|
|
|
| |||||||
Total commercial mortgages | $ | $ | $ | $ | $ | $ | $ | |||||||
|
|
|
|
|
|
|
|
|
|
|
|
|
|
|
December 31, 2020 |
|
|
|
|
|
|
|
|
|
|
|
|
|
|
(in millions) |
| 2020 |
| 2019 |
| 2018 |
| 2017 |
| 2016 |
| Prior |
| Total |
Less than 65% | $ | $ | $ | $ | $ | $ | $ | |||||||
65% to 75% |
|
|
|
|
|
|
| |||||||
76% to 80% |
|
|
|
|
|
|
| |||||||
Greater than 80% |
|
|
|
|
|
|
| |||||||
Total commercial mortgages | $ | $ | $ | $ | $ | $ | $ |
(a)
The debt service coverage ratio compares a property’s net operating income to its debt service payments, including principal and interest. Our weighted average debt service coverage ratio was
(b)
The loan-to-value ratio compares the current unpaid principal balance of the loan to the estimated fair value of the underlying property collateralizing the loan. Our weighted average loan-to-value ratio was
The following table presents the credit quality performance indicators for commercial mortgages:
| Number |
|
|
|
|
|
|
|
|
|
|
|
|
|
|
| Percent |
|
| of |
| Class |
|
| of |
| |||||||||||
(dollars in millions) | Loans |
| Apartments |
| Offices |
| Retail | Industrial |
| Hotel |
| Others |
| Total | Total $ |
| ||
December 31, 2021 |
|
|
|
|
|
|
|
|
|
|
|
|
|
|
|
|
|
|
Credit Quality Performance |
|
|
|
|
|
|
|
|
|
|
|
|
|
|
|
|
|
|
Indicator: |
|
|
|
|
|
|
|
|
|
|
|
|
|
|
|
|
|
|
In good standing |
| $ | $ | $ | $ | $ | $ | $ | % | |||||||||
Restructured(a) |
|
|
|
|
|
|
|
|
| |||||||||
90 days or less delinquent |
|
|
|
|
|
|
|
|
| |||||||||
>90 days delinquent or in |
|
|
|
|
|
|
|
|
|
|
|
|
|
|
|
|
|
|
process of foreclosure |
|
|
|
|
|
|
|
|
| |||||||||
Total(b) |
| $ | $ | $ | $ | $ | $ | $ | % | |||||||||
Allowance for credit losses |
|
| $ | $ | $ | $ | $ | $ | $ | % | ||||||||
|
|
|
|
|
|
|
|
|
|
|
|
|
|
|
|
|
|
|
December 31, 2020 |
|
|
|
|
|
|
|
|
|
|
|
|
|
|
|
|
|
|
Credit Quality Performance |
|
|
|
|
|
|
|
|
|
|
|
|
|
|
|
|
|
|
Indicator: |
|
|
|
|
|
|
|
|
|
|
|
|
|
|
|
|
|
|
In good standing |
| $ | $ | $ | $ | $ | $ | $ | % | |||||||||
Restructured(a) |
|
|
|
|
|
|
|
|
| |||||||||
90 days or less delinquent |
|
|
|
|
|
|
|
|
| |||||||||
>90 days delinquent or in |
|
|
|
|
|
|
|
|
|
|
|
|
|
|
|
|
|
|
process of foreclosure |
|
|
|
|
|
|
|
|
| |||||||||
Total(b) |
| $ | $ | $ | $ | $ | $ | $ | % | |||||||||
Allowance for credit losses |
|
| $ | $ | $ | $ | $ | $ | $ | % | ||||||||
(a)Loans that have been modified in troubled debt restructurings and are performing according to their restructured terms. For additional discussion of troubled debt restructurings see below.
(b) Does not reflect allowance for credit losses.
230 AIG | 2021 Form 10-K
The following table presents credit quality performance indicators for residential mortgages by year of vintage:
December 31, 2021 |
|
|
|
|
|
|
|
|
|
|
|
|
|
|
(in millions) |
| 2021 |
| 2020 |
| 2019 |
| 2018 |
| 2017 |
| Prior |
| Total |
FICO*: |
|
|
|
|
|
|
|
|
|
|
|
|
|
|
780 and greater | $ | $ | $ | $ | $ | $ | $ | |||||||
720 - 779 |
|
|
|
|
|
|
| |||||||
660 - 719 |
|
|
|
|
|
|
| |||||||
600 - 659 |
|
|
|
|
|
|
| |||||||
Less than 600 |
|
|
|
|
|
|
| |||||||
Total residential mortgages | $ | $ | $ | $ | $ | $ | $ | |||||||
|
|
|
|
|
|
|
|
|
|
|
|
|
|
|
December 31, 2020 |
|
|
|
|
|
|
|
|
|
|
|
|
|
|
(in millions) |
| 2020 |
| 2019 |
| 2018 |
| 2017 |
| 2016 |
| Prior |
| Total |
FICO*: |
|
|
|
|
|
|
|
|
|
|
|
|
|
|
780 and greater | $ | $ | $ | $ | $ | $ | $ | |||||||
720 - 779 |
|
|
|
|
|
|
| |||||||
660 - 719 |
|
|
|
|
|
|
| |||||||
600 - 659 |
|
|
|
|
|
|
| |||||||
Less than 600 |
|
|
|
|
|
|
| |||||||
Total residential mortgages | $ | $ | $ | $ | $ | $ | $ |
Methodology Used to Estimate the Allowance for Credit Losses
Subsequent to the adoption of the Financial Instruments Credit Losses Standard on January 1, 2020
At the time of origination or purchase, an allowance for credit losses is established for mortgage and other loan receivables and is updated each reporting period. Changes in the allowance for credit losses are recorded in realized losses. This allowance reflects the risk of loss, even when that risk is remote, that is expected over the remaining contractual life of the loan. The allowance for credit losses considers available relevant information about the collectability of cash flows, including information about past events, current conditions, and reasonable and supportable forecasts of future economic conditions. We revert to historical information when we determine that we can no longer reliably forecast future economic assumptions.
The allowances for the commercial mortgage loans and residential mortgage loans are estimated utilizing a probability of default and loss given default model. Loss rate factors are determined based on historical data and adjusted for current and forecasted information. The loss rates are applied based on individual loan attributes and considering such data points as loan-to-value ratios, FICO scores, and debt service coverage.
The estimate of credit losses also reflects management’s assumptions on certain macroeconomic factors that include, but are not limited to, gross domestic product growth, employment, inflation, housing price index, interest rates and credit spreads.
Accrued interest is excluded from the measurement of the allowance for credit losses and accrued interest is reversed through interest income once a loan is placed on nonaccrual.
When all or a portion of a loan is deemed uncollectible, the uncollectible portion of the carrying amount of the loan is charged off against the allowance.
We also have off-balance sheet commitments related to our commercial mortgage loans. The liability for expected credit losses related to these commercial mortgage loan commitments is reported in Other liabilities in the Consolidated Balance Sheets. When a commitment is funded, we record a loan receivable and reclassify the liability for expected credit losses related to the commitment into loan allowance for expected credit losses. Other changes in the liability for expected credit losses on loan commitments are recorded in Net realized gains (losses) in the Consolidated Statements of Income (Loss).
AIG | 2021 Form 10-K 231
Prior to the adoption of the Financial Instruments Credit Losses Standard on January 1, 2020
Mortgage and other loans receivable are considered impaired when collection of all amounts due under contractual terms is not probable. Impairment is measured using either i) the present value of expected future cash flows discounted at the loan’s effective interest rate, ii) the loan’s observable market price, if available, or iii) the fair value of the collateral if the loan is collateral dependent. Impairment of commercial mortgages is typically determined using the fair value of collateral while impairment of other loans is typically determined using the present value of cash flows or the loan’s observable market price. An allowance is typically established for the difference between the impaired value of the loan and its current carrying amount. Additional allowance amounts are established for incurred but not specifically identified impairments, based on statistical models primarily driven by past-due status, debt service coverage, loan-to-value ratio, property type and location, loan term, profile of the borrower and of the major property tenants, and loan seasoning. When all or a portion of a loan is deemed uncollectable, the uncollectable portion of the carrying amount of the loan is charged off against the allowance.
The following table presents a rollforward of the changes in the allowance for credit losses on Mortgage and other loans receivable(a):
Years Ended December 31, | 2021 |
| 2020 |
| 2019 | ||||||||||||||||||
| Commercial |
|
| Other |
|
|
| Commercial |
|
| Other |
|
|
| Commercial |
|
| Other |
|
| |||
(in millions) | Mortgages |
|
| Loans |
| Total |
| Mortgages |
|
| Loans |
| Total |
| Mortgages |
|
| Loans |
| Total | |||
Allowance, beginning of year | $ |
| $ | $ |
| $ |
| $ | $ |
| $ |
| $ | $ | |||||||||
Initial allowance upon CECL adoption |
|
|
|
|
|
|
|
|
|
|
|
|
|
| |||||||||
Loans charged off |
| ( |
|
|
| ( |
|
| ( |
|
| ( |
| ( |
|
| ( |
|
| ( |
| ( | |
Recoveries of loans previously |
|
|
|
|
|
|
|
|
|
|
|
|
|
|
|
|
|
|
|
|
|
|
|
charged off |
|
|
|
|
|
|
|
|
|
|
|
|
|
| |||||||||
Net charge-offs |
| ( |
|
|
| ( |
|
| ( |
|
| ( |
| ( |
|
| ( |
|
| ( |
| ( | |
Addition to (release of) allowance |
|
|
|
|
|
|
|
|
|
|
|
|
|
|
|
|
|
|
|
|
|
|
|
for loan losses |
| ( |
|
| ( |
| ( |
|
|
|
|
|
|
|
|
|
| ||||||
Divestitures |
|
|
| ( |
| ( |
|
|
|
|
|
|
|
|
|
| |||||||
Allowance, end of year | $ |
| $ | $ |
| $ |
| $ | $ |
| $ | (b) | $ | $ | |||||||||
(a)
Does not include allowance for credit losses of $
(b)
The December 31, 2019 total allowance was calculated prior to the adoption of ASC 326 on January 1, 2020. Of the total allowance, $
As a result of the COVID-19 pandemic, including the significant global economic slowdown, our expectations and models used to estimate the allowance for losses on commercial and residential mortgage loans have been updated to reflect the current economic environment. The full impact of COVID-19 on real estate valuations remains uncertain and we will continue to review our valuations as further information becomes available.
Troubled Debt Restructurings
We modify loans to optimize their returns and improve their collectability, among other things. When we undertake such a modification with a borrower that is experiencing financial difficulty and the modification involves us granting a concession to the troubled debtor, the modification is a troubled debt restructuring (TDR). We assess whether a borrower is experiencing financial difficulty based on a variety of factors, including the borrower’s current default on any of its outstanding debt, the probability of a default on any of its debt in the foreseeable future without the modification, the insufficiency of the borrower’s forecasted cash flows to service any of its outstanding debt (including both principal and interest), and the borrower’s inability to access alternative third-party financing at an interest rate that would be reflective of current market conditions for a non-troubled debtor. Concessions granted may include extended maturity dates, interest rate changes, principal or interest forgiveness, payment deferrals and easing of loan covenants.
In response to the COVID-19 pandemic, there was an increase in the volume of loan modifications in our commercial mortgage, residential mortgage and leveraged loan portfolios in 2020. The COVID-19 related modifications were primarily in the form of short term payment deferrals (one to six months). Short-term payment deferrals are not considered a concession and therefore these modifications are not considered a TDR. As of December 31, 2021, the number of loans in deferral or in the process of being modified have returned to pre-COVID-19 levels.
During the years ended December 31, 2021 and 2020, loans with a carrying value of $
232 AIG | 2021 Form 10-K
7. Reinsurance
The following table provides supplemental information for loss and benefit reserves, gross and net of ceded reinsurance:
At December 31, |
| 2021 |
|
| 2020(b) | ||||
|
| As |
| Net of |
|
| As |
| Net of |
(in millions) |
| Reported | Reinsurance |
|
| Reported | Reinsurance | ||
Liability for unpaid losses and loss adjustment expenses | $ | ( | $ | ( |
| $ | ( | $ | ( |
Future policy benefits for life and accident and health insurance contracts |
| ( |
| ( |
|
| ( |
| ( |
Policyholder contract deposits |
| ( |
| ( |
|
| ( |
| ( |
Reserve for unearned premiums |
| ( |
| ( |
|
| ( |
| ( |
Other policyholder funds |
| ( |
| ( |
|
| ( |
| ( |
Reinsurance assets(a) |
|
|
|
|
|
|
| ||
(a)
Reinsurance assets excludes (i) allowance for credit losses and disputes of $
(b) Liabilities for certain universal life products were reclassified from Policyholder contract deposits to Future policy benefits for life and accident and health insurance contracts. For additional information, see Note 1.
Short-Duration Reinsurance
Short-duration reinsurance is effected under reinsurance treaties and by negotiation on individual risks. Certain of these reinsurance arrangements consist of excess of loss contracts that protect us against losses above stipulated amounts. Ceded premiums are considered prepaid reinsurance premiums and are recognized as a reduction of premiums earned over the contract period in proportion to the protection received. Amounts recoverable from reinsurers on short-duration contracts are estimated in a manner consistent with the claims liabilities associated with the reinsurance and presented as a component of Reinsurance assets. Reinsurance premiums for assumed business are estimated based on information received from brokers, ceding companies and reinsurers. Any subsequent differences arising on such estimates are recorded in the periods in which they are determined. Assumed reinsurance premiums are earned primarily on a pro-rata basis over the terms of the reinsurance contracts and the portion of premiums relating to the unexpired terms of coverage is included in the reserve for unearned premiums. Reinsurance premiums for assumed business are estimated based on information received from brokers, ceding companies and reinsureds. Any subsequent differences arising on such estimates are recorded in the periods in which they are determined. For both ceded and assumed reinsurance, risk transfer requirements must be met for reinsurance accounting to apply. If risk transfer requirements are not met, the contract is accounted for as a deposit, resulting in the recognition of cash flows under the contract through a deposit asset or liability and not as revenue or expense. To meet risk transfer requirements, a reinsurance contract must include both insurance risk, consisting of both underwriting and timing risk, and a reasonable possibility of a significant loss for the assuming entity. Similar risk transfer criteria are used to determine whether directly written insurance contracts should be accounted for as insurance or as a deposit.
AIG | 2021 Form 10-K 233
The following table presents short-duration insurance premiums written and earned:
| Years Ended December 31, | |||||
(in millions) |
| 2021 |
| 2020 |
| 2019 |
Premiums written: |
|
|
|
|
|
|
Direct | $ | $ | $ | |||
Assumed |
|
|
| |||
Ceded |
| ( |
| ( |
| ( |
Net | $ | $ | $ | |||
Premiums earned: |
|
|
|
|
|
|
Direct | $ | $ | $ | |||
Assumed |
|
|
| |||
Ceded |
| ( |
| ( |
| ( |
Net | $ | $ | $ | |||
For the years ended December 31, 2021, 2020 and 2019, reinsurance recoveries, which reduced losses and loss adjustment expenses incurred, amounted to $
In the first quarter of 2017, we entered into an adverse development reinsurance agreement with National Indemnity Company (NICO), a subsidiary of Berkshire Hathaway Inc., under which we transferred to NICO
Long-Duration Reinsurance
Long-duration reinsurance is effected principally under yearly renewable term (YRT) treaties, along with a large modco treaty with a former affiliate, Fortitude Re, that was deconsolidated following the Majority Interest Fortitude Sale. This modco treaty reinsures the majority of our long-duration run-off business. The premiums with respect to YRT treaties are earned over the contract period in proportion to the protection provided, while ceded premiums related to modco treaties are recognized when due. Amounts recoverable on YRT treaties are recognized when claims are incurred on the reinsured policies and are presented as a component of reinsurance assets. Amounts recoverable from reinsurers related to coinsurance or modco contracts are estimated in a manner consistent with the assumptions used for the underlying policy benefits. Amounts recoverable from reinsurers are presented as a component of Reinsurance assets.
234 AIG | 2021 Form 10-K
The following table presents premiums earned and policy fees for our long-duration life insurance and annuity operations:
Years Ended December 31, |
|
|
|
|
|
|
(in millions) |
| 2021 |
| 2020 |
| 2019 |
Premiums |
|
|
|
|
|
|
Direct | $ | $ | $ | |||
Assumed |
|
|
| |||
Ceded |
| ( |
| ( |
| ( |
Net | $ | $ | $ | |||
Policy Fees |
|
|
|
|
|
|
Direct | $ | $ | $ | |||
Assumed |
|
|
| |||
Ceded |
| ( |
| ( |
| ( |
Net | $ | $ | $ |
Long-duration reinsurance recoveries, which reduced Policyholder benefits and losses incurred, was approximately $
The following table presents long-duration insurance in-force ceded to other insurance companies:
At December 31, |
|
|
|
|
|
|
(in millions) |
| 2021 |
| 2020* |
| 2019 |
Long-duration insurance in force ceded | $ | $ | $ |
Long-duration insurance in-force assumed as a percentage of gross long-duration insurance in-force was
The U.S. Life and Retirement companies manage the capital impact of their statutory reserve requirements, including those resulting from the National Association of Insurance Commissioners (NAIC) Model Regulation “Valuation of Life Insurance Policies” (Regulation XXX) and NAIC Actuarial Guideline 38 (Guideline AXXX), through unaffiliated and affiliated reinsurance transactions. Effective July 1, 2016, one of the U.S. Life and Retirement companies entered into an agreement to cede approximately $
In addition, a domestic life insurance subsidiary domiciled in Texas further manages the capital impact of statutory reserve requirements related to fixed index annuities with guaranteed living benefits through two unaffiliated excess of loss reinsurance agreements effective December 31, 2019 and 2020, respectively. Pursuant to a permitted statutory accounting practice, the subsidiary recognizes an admitted asset of approximately $
For additional information on the use of affiliated reinsurance for Regulation XXX and Guideline AXXX reserves see Note 18.
AIG | 2021 Form 10-K 235
Sale of Fortitude Holdings
On June 2, 2020, we completed the Majority Interest Fortitude Sale. AIG established Fortitude Re, a wholly owned subsidiary of Fortitude Holdings, in 2018 in a series of reinsurance transactions related to AIG’s Run-Off operations. As of December 31, 2021, approximately $
These reinsurance transactions between AIG and Fortitude Re were structured as modco and loss portfolio transfer arrangements with funds withheld (funds withheld). In modco and funds withheld arrangements, the investments supporting the reinsurance agreements, and which reflect the majority of the consideration that would be paid to the reinsurer for entering into the transaction, are withheld by, and therefore continue to reside on the balance sheet of, the ceding company (i.e., AIG) thereby creating an obligation for the ceding company to pay the reinsurer (i.e., Fortitude Re) at a later date. Additionally, as AIG maintains ownership of these investments, AIG will maintain its existing accounting for these assets (e.g., the changes in fair value of available for sale securities will be recognized within Other comprehensive income (loss)). As a result of the deconsolidation resulting from the Majority Interest Fortitude Sale, AIG has established a funds withheld payable to Fortitude Re while simultaneously establishing a reinsurance asset representing reserves for the insurance coverage that Fortitude Re has assumed. The funds withheld payable contains an embedded derivative and changes in fair value of the embedded derivative related to the funds withheld payable are recognized in earnings through Net realized gains (losses). This embedded derivative is considered a total return swap with contractual returns that are attributable to various assets and liabilities associated with these reinsurance agreements.
| December 31, 2021 |
| December 31, 2020 |
|
| ||||||
| Carrying |
| Fair |
| Carrying |
| Fair |
|
| ||
(in millions) |
| Value |
| Value |
|
| Value |
| Value |
| Corresponding Accounting Policy |
Fixed maturity securities - available for sale(a) | $ | $ |
| $ | $ |
| Fair value through other comprehensive income (loss) | ||||
Fixed maturity securities - fair value option |
|
|
|
|
|
| Fair value through net investment income | ||||
Commercial mortgage loans |
|
|
|
|
|
| Amortized cost | ||||
Real estate investments |
|
|
|
|
|
| Amortized cost | ||||
Private equity funds / hedge funds |
|
|
|
|
|
| Fair value through net investment income | ||||
Policy loans |
|
|
|
|
|
| Amortized cost | ||||
Short-term investments |
|
|
|
|
|
| Fair value through net investment income | ||||
Funds withheld investment assets |
|
|
|
|
|
|
| ||||
Derivative assets, net(b) |
|
|
|
| ( |
| ( |
| Fair value through net realized gains (losses) | ||
Other(c) |
|
|
|
|
|
| Amortized cost | ||||
Total | $ | $ |
| $ | $ |
|
| ||||
(a)
The change in the net unrealized gains (losses) on available for sale securities related to the Fortitude Re funds withheld assets was $(
(b)
The derivative assets and liabilities have been presented net of cash collateral. The derivative assets and liabilities supporting the Fortitude Re funds withheld arrangements had a fair market value of $
(c) Primarily comprised of Cash and Accrued investment income.
236 AIG | 2021 Form 10-K
The impact of the funds withheld arrangements with Fortitude Re was as follows:
Years Ended December 31, |
|
|
|
|
|
(in millions) |
| 2021 |
|
| 2020 |
Net underwriting income(a) | $ |
| $ | ||
Net investment income - Fortitude Re funds withheld assets |
|
|
| ||
Net realized gains (losses) on Fortitude Re funds withheld assets: |
|
|
|
|
|
Net realized gains - Fortitude Re funds withheld assets |
|
|
| ||
Net realized losses - Fortitude Re embedded derivatives |
| ( |
|
| ( |
Net realized gains (losses) on Fortitude Re funds withheld assets |
|
|
| ( | |
Income (loss) from continuing operations before income tax expense (benefit) |
|
|
| ( | |
Income tax expense (benefit)(b) |
|
|
| ( | |
Net income (loss) |
|
|
| ( | |
Change in unrealized appreciation (depreciation) of all other investments(b) |
| ( |
|
| |
Comprehensive income (loss) | $ |
| $ | ( |
(a)
Effective in the second quarter of 2021, an amendment was made to the purchase agreement to finalize the post-closing purchase price adjustment for adverse reserve development and as a result, during 2021, AIG recognized a $
(b)
The income tax expense (benefit) and the tax impact in AOCI was computed using AIG’s U.S. statutory tax rate of
Various assets supporting the Fortitude Re funds withheld arrangements are reported at amortized cost, and as such, changes in the fair value of these assets are not reflected in the financial statements. However, changes in the fair value of these assets are included in the embedded derivative in the Fortitude Re funds withheld arrangements and the appreciation of these assets is the primary driver of the comprehensive income (loss) reflected above.
Reinsurance Security
Our third-party reinsurance arrangements do not relieve us from our direct obligations to our beneficiaries. Thus, a credit exposure exists with respect to both short-duration and long-duration reinsurance ceded to the extent that any reinsurer fails to meet the obligations assumed under any reinsurance agreement. We hold substantial collateral as security under related reinsurance agreements in the form of funds, securities, and/or letters of credit. A provision has been recorded for estimated unrecoverable reinsurance. In light of collateral held, we believe that no exposure to a single reinsurer represents an inappropriate concentration of credit risk to AIG. Gross reinsurance assets due from reinsurers exceeding
Reinsurance – Credit Losses
The estimation of reinsurance recoverables involves a significant amount of judgment, particularly for latent exposures, such as asbestos, due to their long-tail nature. Reinsurance assets include reinsurance recoverables on unpaid losses and loss adjustment expenses that are estimated as part of our loss reserving process and, consequently, are subject to similar judgments and uncertainties as the estimation of gross loss reserves. Similarly, Other assets include reinsurance recoverables for contracts which are accounted for as deposits.
We assess the collectability of reinsurance recoverable balances in each reporting period, through either historical trends of disputes and credit events or financial analysis of the credit quality of the reinsurer. We record adjustments to reflect the results of these assessments through an allowance for credit losses and disputes that reduces the carrying amount of reinsurance and other assets on the consolidated balance sheets (collectively, reinsurance recoverables). This estimate requires significant judgment for which key considerations include:
paid and unpaid amounts recoverable;
whether the balance is in dispute or subject to legal collection;
the relative financial health of the reinsurer as determined by the Obligor Risk Ratings (ORRs) we assign to each reinsurer based upon our financial reviews; reinsurers that are financially troubled (i.e., in run-off, have voluntarily or involuntarily been placed in receivership, are insolvent, are in the process of liquidation or otherwise subject to formal or informal regulatory restriction) are assigned ORRs that will generate a significant allowance; and
whether collateral and collateral arrangements exist.
AIG | 2021 Form 10-K 237
An estimate of the reinsurance recoverables lifetime expected credit losses is established utilizing a probability of default and loss given default method, which reflects the reinsurer’s ORR rating. The allowance for credit losses excludes disputed amounts. An allowance for disputes is established for a reinsurance recoverable using the losses incurred model for contingencies.
The total reinsurance recoverables as of December 31, 2021 were $
As of December 31, 2021, approximately
Reinsurance Recoverable Allowance
The following table presents a rollforward of the reinsurance recoverable allowance:
Years Ended December 31, | 2021 |
| 2020 | ||||||||||
|
| General |
| Life and |
|
|
|
| General |
| Life and |
|
|
(in millions) | Insurance | Retirement |
| Total |
| Insurance | Retirement |
| Total | ||||
Balance, beginning of year | $ | $ | $ |
| $ | $ | $ | ||||||
Initial allowance upon CECL adoption |
|
|
|
|
|
|
| ||||||
Addition to (release of) allowance for expected credit losses and disputes, net |
|
|
|
|
| ( |
|
| |||||
Write-offs charged against the allowance for credit losses and disputes |
| ( |
|
| ( |
|
| ( |
|
| ( | ||
Balance, end of year | $ | $ | $ |
| $ | $ | $ | ||||||
There were no material recoveries of credit losses previously written off for the years ended December 31, 2021 and 2020.
Past-Due Status
We consider a reinsurance asset to be past due when it is 90 days past due. The allowance for credit losses is estimated excluding disputed amounts. An allowance for disputes is established using the losses incurred method for contingencies. Past due balances on claims that are not in dispute were not material for any of the periods presented.
8. Deferred Policy Acquisition Costs
DAC represent those costs that are incremental and directly related to the successful acquisition of new or renewal of existing insurance contracts. We defer incremental costs that result directly from, and are essential to, the acquisition or renewal of an insurance contract. Such deferred policy acquisition costs generally include agent or broker commissions and bonuses, premium taxes, and medical and inspection fees that would not have been incurred if the insurance contract had not been acquired or renewed. Each cost is analyzed to assess whether it is fully deferrable. We partially defer costs, including certain commissions, when we do not believe that the entire cost is directly related to the acquisition or renewal of insurance contracts.
We also defer a portion of employee total compensation and payroll-related fringe benefits directly related to time spent performing specific acquisition or renewal activities, including costs associated with the time spent on underwriting, policy issuance and processing, and sales force contract selling. The amounts deferred are derived based on successful efforts for each distribution channel and/or cost center from which the cost originates.
Short-duration insurance contracts: Policy acquisition costs are deferred and amortized over the period in which the related premiums written are earned, generally 12 months. DAC is grouped consistent with the manner in which the insurance contracts are acquired, serviced and measured for profitability and is reviewed for recoverability based on the profitability of the underlying insurance contracts. Investment income is anticipated in assessing the recoverability of DAC. We assess the recoverability of DAC on an annual basis or more frequently if circumstances indicate an impairment may have occurred. This assessment is performed by comparing recorded net unearned premiums and anticipated investment income on in-force business to the sum of expected losses and loss adjustment expenses incurred, unamortized DAC and maintenance costs. If the sum of these costs exceeds the amount of recorded net unearned premiums and anticipated investment income, the excess is recognized as an offset against the asset
238 AIG | 2021 Form 10-K
ITEM 8 | Notes to Consolidated Financial Statements | 8. Deferred Policy Acquisition Costs
established for DAC. This offset is referred to as a premium deficiency charge. Increases in expected losses and loss adjustment expenses incurred can have a significant impact on the likelihood and amount of a premium deficiency charge.
Long-duration insurance contracts: Policy acquisition costs for participating life, traditional life and accident and health insurance products are generally deferred and amortized, with interest, over the premium paying period. The assumptions used to calculate the benefit liabilities and DAC for these traditional products are set when a policy is issued and do not change with changes in actual experience, unless a loss recognition event occurs. These “locked-in” assumptions include mortality, morbidity, persistency, maintenance expenses and investment returns, and include margins for adverse deviation to reflect uncertainty given that actual experience might deviate from these assumptions. A loss recognition event occurs when there is a shortfall between the carrying amount of future policy benefit liabilities, net of DAC, and what the future policy benefit liabilities, net of DAC, would be when applying updated current assumptions. When we determine a loss recognition event has occurred, we first reduce any DAC related to that block of business through amortization of acquisition expense, and after DAC is depleted, we record additional liabilities through a charge to Policyholder benefits and losses incurred. Groupings for loss recognition testing are consistent with our manner of acquiring, servicing and measuring the profitability of the business and applied by product groupings. We perform separate loss recognition tests for traditional life products, payout annuities and long-term care products. Once loss recognition has been recorded for a block of business, the old assumption set is replaced and the assumption set used for the loss recognition would then be subject to the lock-in principle.
Investment-oriented contracts: Certain policy acquisition costs and policy issuance costs related to universal life and investment-type products (collectively, investment-oriented products) are deferred and amortized, with interest, in relation to the incidence of estimated gross profits to be realized over the estimated lives of the contracts. DAC on investment-oriented contracts were approximately $
To estimate future estimated gross profits for variable annuity products, a long-term annual asset growth assumption is applied to determine the future growth in assets and related asset-based fees. In determining the asset growth rate, the effect of short-term fluctuations in the equity markets is partially mitigated through the use of a “reversion to the mean” methodology whereby short-term asset growth above or below long-term annual rate assumptions impacts the growth assumption applied to the five-year period subsequent to the current balance sheet date. The reversion to the mean methodology allows us to maintain our long-term growth assumptions, while also giving consideration to the effect of actual investment performance. When actual performance significantly deviates from the annual long-term growth assumption, as evidenced by growth assumptions in the five-year reversion to the mean period falling below a certain rate (floor) or rising above a certain rate (cap) for a sustained period, judgment may be applied to revise or “unlock” the growth rate assumptions to be used for both the five-year reversion to the mean period as well as the long-term annual growth assumption applied to subsequent periods.
Unrealized Appreciation (Depreciation) of Investments: DAC related to investment-oriented products is also adjusted to reflect the effect of unrealized gains or losses on fixed maturity securities available for sale, with related changes recognized through Other comprehensive income. The adjustment is made at each balance sheet date, as if the securities had been sold at their stated aggregate fair value and the proceeds reinvested at current yields. Similarly, for long-duration traditional insurance contracts, if the assets supporting the liabilities are in a net unrealized gain position at the balance sheet date, loss recognition testing assumptions are updated to exclude such gains from future cash flows by reflecting the impact of reinvestment rates on future yields. If a future loss is anticipated under this basis, any additional shortfall indicated by loss recognition tests is recognized as a reduction in accumulated other comprehensive income. Similar to other loss recognition on long-duration insurance contracts, such shortfall is first reflected as a reduction in DAC and secondly as an increase in liabilities for future policy benefits. The change in these adjustments, net of tax, is included with the change in net unrealized appreciation of investments that is credited or charged directly to Other comprehensive income.
AIG | 2021 Form 10-K 239
ITEM 8 | Notes to Consolidated Financial Statements | 8. Deferred Policy Acquisition Costs
Internal Replacements of Long-duration and Investment-oriented Products: For some products, policyholders can elect to modify product benefits, features, rights or coverages by exchanging a contract for a new contract or by amendment, endorsement, or rider to a contract, or by the election of a feature or coverage within a contract. These transactions are known as internal replacements. If the modification does not substantially change the contract, we do not change the accounting and amortization of existing DAC and related actuarial balances. If an internal replacement represents a substantial change, the original contract is considered to be extinguished and any related DAC or other policy balances are charged or credited to income, and any new deferrable costs associated with the replacement contract are deferred.
Value of Business Acquired (VOBA): VOBA is determined at the time of acquisition and is reported in the Consolidated Balance Sheets with DAC. This value is based on the present value of future pre-tax profits discounted at yields applicable at the time of purchase. For participating life, traditional life and accident and health insurance products, VOBA is amortized over the life of the business in a manner similar to that for DAC based on the assumptions at purchase. For investment-oriented products, VOBA is amortized in relation to estimated gross profits and adjusted for the effect of unrealized gains or losses on fixed maturity securities available for sale in a manner similar to DAC.
The following table presents a rollforward of DAC:
Years Ended December 31, |
|
|
|
|
|
|
(in millions) |
| 2021 |
| 2020 |
| 2019 |
Balance, beginning of year | $ | $ | $ | |||
Acquisition costs deferred |
|
|
| |||
Amortization expense |
| ( |
| ( |
| ( |
Change related to unrealized appreciation (depreciation) of investments |
|
| ( |
| ( | |
Dispositions |
|
| ( |
| ||
Other, including foreign exchange |
| ( |
|
| ( | |
Balance, end of year(a) | $ | $ | $ |
The following table presents a rollforward of VOBA:
Years Ended December 31, |
|
|
|
|
|
|
(in millions) |
| 2021 |
| 2020 |
| 2019 |
Balance, beginning of year | $ | $ | $ | |||
Amortization expense |
| ( |
| ( |
| ( |
Change related to unrealized appreciation (depreciation) of investments |
|
|
| ( | ||
Dispositions |
|
| ( |
| ||
Other, including foreign exchange |
| ( |
| ( |
| |
Balance, end of year(a) | $ | $ | $ |
The percentage of the unamortized balance of VOBA at December 31, 2021 expected to be amortized in 2022 through 2026 by year is:
240 AIG | 2021 Form 10-K
ITEM 8 | Notes to Consolidated Financial Statements | 9. Variable Interest Entities
DAC, VOBA and DSI for insurance-oriented and investment-oriented products are reviewed for recoverability, which involves estimating the future profitability of current business. This review involves significant management judgment. If actual profitability is substantially lower than estimated, AIG’s DAC, VOBA and DSI may be subject to an impairment charge and AIG’s results of operations could be significantly affected in the period the impairment charge is recognized and in future periods.
9. Variable Interest Entities
A variable interest entity (VIE) is a legal entity that does not have sufficient equity at risk to finance its activities without additional subordinated financial support or is structured such that equity investors lack the ability to make significant decisions relating to the entity’s operations through voting rights or do not substantively participate in the gains and losses of the entity. Consolidation of a VIE by its primary beneficiary is not based on majority voting interest, but is based on other criteria discussed below.
We enter into various arrangements with VIEs in the normal course of business and consolidate the VIEs when we determine we are the primary beneficiary. This analysis includes a review of the VIE’s capital structure, related contractual relationships and terms, nature of the VIE’s operations and purpose, nature of the VIE’s interests issued and our involvement with the entity. When assessing the need to consolidate a VIE, we evaluate the design of the VIE as well as the related risks to which the entity was designed to expose the variable interest holders.
The primary beneficiary is the entity that has both (i) the power to direct the activities of the VIE that most significantly affect the entity’s economic performance and (ii) the obligation to absorb losses or the right to receive benefits that could be potentially significant to the VIE. While also considering these factors, the consolidation conclusion depends on the breadth of our decision-making ability and our ability to influence activities that significantly affect the economic performance of the VIE.
Balance Sheet Classification and Exposure to Loss
Creditors or beneficial interest holders of VIEs for which AIG is the primary beneficiary generally have recourse only to the assets and cash flows of the VIEs and do not have recourse to AIG, except in limited circumstances when AIG has provided a guarantee to the VIE’s interest holders. The following table presents the total assets and total liabilities associated with our variable interests in consolidated VIEs, as classified in the Consolidated Balance Sheets:
|
| Real Estate and |
|
|
| Affordable |
|
|
|
|
|
| Investment |
| Securitization |
| Housing |
|
|
|
|
(in millions) |
| Entities(d) |
| Vehicles |
| Partnerships |
| Other |
| Total |
December 31, 2021 |
|
|
|
|
|
|
|
|
|
|
Assets: |
|
|
|
|
|
|
|
|
|
|
Bonds available for sale | $ | $ | $ | $ | $ | |||||
Other bond securities |
|
|
|
|
| |||||
Equity securities |
|
|
|
|
| |||||
Mortgage and other loans receivable |
|
|
|
|
| |||||
Other invested assets |
|
|
|
|
|
|
|
|
|
|
Alternative investments(a) |
|
|
|
|
| |||||
Investment real estate |
|
|
|
|
| |||||
Short-term investments |
|
|
|
|
| |||||
Cash |
|
|
|
|
| |||||
Accrued investment income |
|
|
|
|
| |||||
Other assets |
|
|
|
|
| |||||
Total(b) | $ | $ | $ | $ | $ | |||||
Liabilities: |
|
|
|
|
|
|
|
|
|
|
Debt of consolidated investment entities | $ | $ | $ | $ | $ | |||||
Other(c) |
|
|
|
|
| |||||
Total | $ | $ | $ | $ | $ | |||||
December 31, 2020 |
|
|
|
|
|
|
|
|
|
|
Assets: |
|
|
|
|
|
|
|
|
|
|
Bonds available for sale | $ | $ | $ | $ | $ | |||||
Other bond securities |
|
|
|
|
| |||||
Equity securities |
|
|
|
|
|
AIG | 2021 Form 10-K 241
ITEM 8 | Notes to Consolidated Financial Statements | 9. Variable Interest Entities
Mortgage and other loans receivable |
|
|
|
|
| |||||
Other invested assets |
|
|
|
|
|
|
|
|
|
|
Alternative investments(a) |
|
|
|
|
| |||||
Investment real estate |
|
|
|
|
| |||||
Short-term investments |
|
|
|
|
| |||||
Cash |
|
|
|
|
| |||||
Accrued investment income |
|
|
|
|
| |||||
Other assets |
|
|
|
|
| |||||
Total(b) | $ | $ | $ | $ | $ | |||||
Liabilities: |
|
|
|
|
|
|
|
|
|
|
Debt of consolidated investment entities | $ | $ | $ | $ | $ | |||||
Other(c) |
|
|
|
|
| |||||
Total | $ | $ | $ | $ | $ |
(a) Comprised primarily of investments in real estate joint ventures at December 31, 2021 and 2020.
(b) The assets of each VIE can be used only to settle specific obligations of that VIE.
(c) Comprised primarily of Other liabilities at December 31, 2021 and 2020.
(d)
At December 31, 2021 and 2020, off-balance sheet exposure primarily consisting of our insurance companies’ commitments to real estate and investment entities were $
We calculate our maximum exposure to loss to be (i) the amount invested in the debt or equity of the VIE, (ii) the notional amount of VIE assets or liabilities where we have also provided credit protection to the VIE with the VIE as the referenced obligation, and (iii) other commitments and guarantees to the VIE.
AIG entered into six transactions between 2012 and 2014, securitizing portfolios of certain debt securities previously owned by AIG and its affiliates. As part of these transactions, an indirectly wholly-owned subsidiary of AIG was obligated to make capital contributions to these securitization VIEs in the event that the VIE was unable to redeem any rated notes it had in issue on the relevant redemption date. AIG had provided a guarantee to the six securitization VIEs of the obligations of its indirectly wholly-owned subsidiary to make such capital contributions when due. Prior to December 31, 2021, all six transactions were terminated. In aggregate, the termination of these six transactions resulted in a reduction of debt of consolidated investment entities of $
The following table presents total assets of unconsolidated VIEs in which we hold a variable interest, as well as our maximum exposure to loss associated with these VIEs:
|
|
|
| Maximum Exposure to Loss | |||||||
|
| Total VIE |
|
| On-Balance |
|
| Off-Balance |
|
|
|
(in millions) |
| Assets |
|
| Sheet | (b) |
| Sheet |
|
| Total |
December 31, 2021 |
|
|
|
|
|
|
|
|
|
|
|
Real estate and investment entities(a) | $ |
| $ |
| $ | (d) | $ | ||||
Other |
|
|
|
|
| (e) |
| ||||
Total | $ |
| $ |
| $ |
| $ | ||||
December 31, 2020 |
|
|
|
|
|
|
|
|
|
|
|
Real estate and investment entities(a) | $ |
| $ |
| $ | (d) | $ | ||||
Affordable housing partnerships |
|
|
| (c) |
|
|
| ||||
Other |
|
|
|
|
| (e) |
| ||||
Total | $ |
| $ |
| $ |
| $ | ||||
(a) Comprised primarily of hedge funds and private equity funds.
(b)
At December 31, 2021 and 2020, $
(c)
At December 31, 2020, primarily included alternative equity investments of $
(d) These amounts represent our unfunded commitments to invest in private equity funds and hedge funds.
(e) These amounts represent our estimate of the maximum exposure to loss under certain insurance policies issued to VIEs if a hypothetical loss occurred to the extent of the full amount of the insured value. Our insurance policies cover defined risks and our estimate of liability is included in our insurance reserves on the balance sheet.
242 AIG | 2021 Form 10-K
ITEM 8 | Notes to Consolidated Financial Statements | 9. Variable Interest Entities
Real Estate and Investment Entities
Through our insurance operations and AIG Global Real Estate Investment Corp., we are an investor in various real estate investment entities, some of which are VIEs. These investments are typically with unaffiliated third-party developers via a partnership or limited liability company structure. The VIEs’ activities consist of the development or redevelopment of commercial, industrial and residential real estate. Our involvement varies from being a passive equity investor or finance provider to actively managing the activities of the VIEs.
Our insurance operations participate as passive investors in the equity issued by certain third-party-managed hedge and private equity funds that are VIEs. Our insurance operations typically are not involved in the design or establishment of these VIEs, nor do they actively participate in the management of the VIEs.
Securitization AND REPACKAGING Vehicles
We created certain VIEs that hold investments, primarily in investment-grade debt securities and loans, and issued beneficial interests in these investments. Some of these VIEs were created to facilitate our purchase of asset-backed securities. In these situations, all of the beneficial interests are owned by our insurance operations and are consolidated by AIG. In other instances, we have created VIEs that are securitizations of residential mortgage loans or other forms of collateralized loan obligations or repackage loan and other assets into pass-through securities. Our insurance subsidiaries own some of the beneficial interests of these VIEs, and we maintain the power to direct the activities of the VIEs that most significantly impact their economic performance. Accordingly, we consolidate these entities and those beneficial interests issued to third parties are reported as debt of consolidated investment entities. This debt is non-recourse to AIG.
Affordable Housing Partnerships
SAAHP organized and invested in limited partnerships that develop and operate affordable housing qualifying for federal, state, and historic tax credits, in addition to a few market rate properties across the United States. The operating partnerships are VIEs, whose debt is generally non-recourse in nature, and the general partners of which are mostly unaffiliated third-party developers. Until their sale in December 2021, we accounted for our investments in operating partnerships using the equity method of accounting, unless they are required to be consolidated. We consolidated an operating partnership if the general partner is an affiliated entity or we otherwise have the power to direct activities that most significantly impact the entities’ economic performance. The pre-tax income of SAAHP was reported as a component of the Life and Retirement segment. In December 2021, AIG completed the sale of a U.S. affordable housing portfolio to Blackstone Real Estate Income Trust.
For additional information on the sale of AIG’s interests in a U.S. affordable housing portfolio, see Note 1.
RMBS, CMBS, Other ABS and CDOs
Primarily through our insurance operations, we are a passive investor in RMBS, CMBS, other ABS and CDOs, the majority of which are issued by domestic special purpose entities. We generally do not sponsor or transfer assets to, or act as the servicer to these asset-backed structures, and were not involved in the design of these entities.
Our maximum exposure in these types of structures is limited to our investment in securities issued by these entities. Based on the nature of our investments and our passive involvement in these types of structures, we have determined that we are not the primary beneficiary of these entities. We have not included these entities in the above tables; however, the fair values of our investments in these structures are reported in Notes 4 and 5 herein.
AIG | 2021 Form 10-K 243
ITEM 8 | Notes to Consolidated Financial Statements | 10. Derivatives and Hedge Accounting
10. Derivatives and Hedge Accounting
We use derivatives and other financial instruments as part of our financial risk management programs and as part of our investment operations. Interest rate derivatives (such as interest rate swaps) are used to manage interest rate risk associated with embedded derivatives contained in insurance contract liabilities, fixed maturity securities, outstanding medium- and long-term notes as well as other interest rate sensitive assets and liabilities. Foreign exchange derivatives (principally foreign exchange forwards and swaps) are used to economically mitigate risk associated with non-U.S. dollar denominated debt, net capital exposures, foreign currency transactions, and foreign denominated investments. Equity derivatives are used to mitigate financial risk embedded in certain insurance liabilities and economically hedge certain investments. We use credit derivatives to manage our credit exposures. Commodity derivatives are used to hedge exposures within reinsurance contracts. The derivatives are effective economic hedges of the exposures that they are meant to offset. In addition to hedging activities, we also enter into derivative contracts with respect to investment operations, which may include, among other things, CDSs, total return swaps and purchases of investments with embedded derivatives, such as equity-linked notes and convertible bonds.
Interest rate, currency, equity and commodity swaps, credit contracts, swaptions, options and forward transactions are accounted for as derivatives, recorded on a trade-date basis and carried at fair value. Unrealized gains and losses are reflected in income, when appropriate. Aggregate asset or liability positions are netted on the Consolidated Balance Sheets only to the extent permitted by qualifying master netting arrangements in place with each respective counterparty. Cash collateral posted with counterparties in conjunction with transactions supported by qualifying master netting arrangements is reported as a reduction of the corresponding net derivative liability, while cash collateral received in conjunction with transactions supported by qualifying master netting arrangements is reported as a reduction of the corresponding net derivative asset.
Derivatives, with the exception of embedded derivatives, are reported at fair value in the Consolidated Balance Sheets in Other assets and Other liabilities. Embedded derivatives are generally presented with the host contract in the Consolidated Balance Sheets. A bifurcated embedded derivative is measured at fair value and accounted for in the same manner as a free standing derivative contract. The corresponding host contract is accounted for according to the accounting guidance applicable for that instrument.
For additional information on embedded derivatives see Notes 4 and 13.
The following table presents the notional amounts of our derivatives and the fair value of derivative assets and liabilities in the Consolidated Balance Sheets:
| December 31, 2021 |
| December 31, 2020 | ||||||||||||||||
| Gross Derivative Assets |
| Gross Derivative Liabilities |
| Gross Derivative Assets |
| Gross Derivative Liabilities | ||||||||||||
|
| Notional |
| Fair |
|
| Notional |
| Fair |
|
| Notional |
| Fair |
|
| Notional |
| Fair |
(in millions) |
| Amount |
| Value |
|
| Amount |
| Value |
|
| Amount |
| Value |
|
| Amount |
| Value |
Derivatives designated as |
|
|
|
|
|
|
|
|
|
|
|
|
|
|
|
|
|
|
|
hedging instruments:(a) |
|
|
|
|
|
|
|
|
|
|
|
|
|
|
|
|
|
|
|
Interest rate contracts | $ | $ |
| $ | $ |
| $ | $ |
| $ | $ | ||||||||
Foreign exchange contracts |
|
|
|
|
|
|
|
|
|
|
| ||||||||
Derivatives not designated |
|
|
|
|
|
|
|
|
|
|
|
|
|
|
|
|
|
|
|
as hedging instruments:(a) |
|
|
|
|
|
|
|
|
|
|
|
|
|
|
|
|
|
|
|
Interest rate contracts |
|
|
|
|
|
|
|
|
|
|
| ||||||||
Foreign exchange contracts |
|
|
|
|
|
|
|
|
|
|
| ||||||||
Equity contracts |
|
|
|
|
|
|
|
|
|
|
| ||||||||
Commodity contracts |
|
|
|
|
|
|
|
|
|
|
| ||||||||
Credit contracts(b) |
|
|
|
|
|
|
|
|
|
|
| ||||||||
Other contracts(c) |
|
|
|
|
|
|
|
|
|
|
| ||||||||
Total derivatives, gross | $ | $ |
| $ | $ |
| $ | $ |
| $ | $ | ||||||||
Counterparty netting(d) |
|
|
| ( |
|
|
|
| ( |
|
|
|
| ( |
|
|
|
| ( |
Cash collateral(e) |
|
|
| ( |
|
|
|
| ( |
|
|
|
| ( |
|
|
|
| ( |
Total derivatives on |
|
|
|
|
|
|
|
|
|
|
|
|
|
|
|
|
|
|
|
Consolidated Balance Sheets(f) |
|
| $ |
|
|
| $ |
|
|
| $ |
|
|
| $ | ||||
(a) Fair value amounts are shown before the effects of counterparty netting adjustments and offsetting cash collateral.
(b)
As of December 31, 2021 and 2020, included CDSs on super senior multi-sector CDOs with a net notional amount of $
244 AIG | 2021 Form 10-K
ITEM 8 | Notes to Consolidated Financial Statements | 10. Derivatives and Hedge Accounting
(c) Consists primarily of stable value wraps and contracts with multiple underlying exposures.
(d) Represents netting of derivative exposures covered by a qualifying master netting agreement.
(e) Represents cash collateral posted and received that is eligible for netting.
.
Collateral
We engage in derivative transactions that are not subject to a clearing requirement directly with unaffiliated third parties, in most cases, under International Swaps and Derivatives Association, Inc. (ISDA) Master Agreements. Many of the ISDA Master Agreements also include Credit Support Annex provisions, which provide for collateral postings that may vary at various ratings and threshold levels. We attempt to reduce our risk with certain counterparties by entering into agreements that enable collateral to be obtained from a counterparty on an upfront or contingent basis. We minimize the risk that counterparties might be unable to fulfill their contractual obligations by monitoring counterparty credit exposure and collateral value and generally requiring additional collateral to be posted upon the occurrence of certain events or circumstances. In addition, certain derivative transactions have provisions that require collateral to be posted by us upon a downgrade of our long-term debt ratings or give the counterparty the right to terminate the transaction. In the case of some of the derivative transactions, upon a downgrade of our long-term debt ratings, as an alternative to posting collateral and subject to certain conditions, we may assign the transaction to an obligor with higher debt ratings or arrange for a substitute guarantee of our obligations by an obligor with higher debt ratings or take other similar action. The actual amount of collateral required to be posted to counterparties in the event of such downgrades, or the aggregate amount of payments that we could be required to make, depends on market conditions, the fair value of outstanding affected transactions and other factors prevailing at and after the time of the downgrade.
Collateral posted by us to third parties for derivative transactions was $
Offsetting
We have elected to present all derivative receivables and derivative payables, and the related cash collateral received and paid, on a net basis on our Consolidated Balance Sheets when a legally enforceable ISDA Master Agreement exists between us and our derivative counterparty. An ISDA Master Agreement is an agreement governing multiple derivative transactions between two counterparties. The ISDA Master Agreement generally provides for the net settlement of all, or a specified group, of these derivative transactions, as well as transferred collateral, through a single payment, and in a single currency, as applicable. The net settlement provisions apply in the event of a default on, or affecting any, one derivative transaction or a termination event affecting all, or a specified group of, derivative transactions governed by the ISDA Master Agreement.
Hedge Accounting
We designated certain derivatives entered into with third parties as fair value hedges of available for sale investment securities held by our insurance subsidiaries. The fair value hedges include foreign currency forwards and cross currency swaps designated as hedges of the change in fair value of foreign currency denominated available for sale securities attributable to changes in foreign exchange rates. We also designated certain interest rate swaps entered into with third parties as fair value hedges of fixed rate GICs attributable to changes in benchmark interest rates.
We use foreign currency denominated debt and cross-currency swaps as hedging instruments in net investment hedge relationships to mitigate the foreign exchange risk associated with our non-U.S. dollar functional currency foreign subsidiaries. For net investment hedge relationships where issued debt is used as a hedging instrument, we assess the hedge effectiveness and measure the amount of ineffectiveness based on changes in spot rates. For net investment hedge relationships that use derivatives as hedging instruments, we assess hedge effectiveness and measure hedge ineffectiveness using changes in forward rates. For the years ended December 31, 2021, 2020 and 2019, we recognized gains (losses) of $
AIG | 2021 Form 10-K 245
ITEM 8 | Notes to Consolidated Financial Statements | 10. Derivatives and Hedge Accounting
A qualitative methodology is utilized to assess hedge effectiveness for net investment hedges, while regression analysis is employed for all other hedges.
The following table presents the gain (loss) recognized in income on our derivative instruments in fair value hedging relationships in the Consolidated Statements of Income (Loss):
| Gains/(Losses) Recognized in Income for: |
|
|
| |||||
| Hedging | Excluded | Hedged |
|
|
| |||
(in millions) | Derivatives(a) | Components(b) | Items |
| Net Impact | ||||
Year ended December 31, 2021 |
|
|
|
|
|
|
|
|
|
Interest rate contracts: |
|
|
|
|
|
|
|
|
|
Interest credited to policyholder account balances | $ | ( | $ | $ |
| $ | ( | ||
Net investment income |
|
|
| ( |
|
| ( | ||
Foreign exchange contracts: |
|
|
|
|
|
|
|
|
|
Net realized gains/(losses) |
|
|
| ( |
|
| |||
Year ended December 31, 2020 |
|
|
|
|
|
|
|
|
|
Interest rate contracts: |
|
|
|
|
|
|
|
|
|
Interest credited to policyholder account balances | $ | $ | $ | ( |
| $ | |||
Net investment income |
| ( |
|
|
|
| ( | ||
Foreign exchange contracts: |
|
|
|
|
|
|
|
|
|
Net realized gains/(losses) |
| ( |
|
|
|
| |||
Year ended December 31, 2019 |
|
|
|
|
|
|
|
|
|
Interest rate contracts: |
|
|
|
|
|
|
|
|
|
Interest credited to policyholder account balances | $ | $ | $ | ( |
| $ | |||
Net investment income |
| ( |
|
|
|
| |||
Foreign exchange contracts: |
|
|
|
|
|
|
|
|
|
Net realized gains/(losses) |
| ( |
|
|
|
| |||
Derivatives Not Designated as Hedging Instruments
The following table presents the effect of derivative instruments not designated as hedging instruments in the Consolidated Statements of Income (Loss):
Years Ended December 31, | Gains (Losses) Recognized in Income | |||||
(in millions) |
| 2021 |
| 2020 |
| 2019 |
By Derivative Type: |
|
|
|
|
|
|
Interest rate contracts | $ | ( | $ | $ | ||
Foreign exchange contracts |
|
| ( |
| ( | |
Equity contracts |
| ( |
|
| ( | |
Commodity contracts |
| ( |
|
| ||
Credit contracts |
| ( |
|
| ||
Other contracts |
|
|
| |||
Embedded derivatives |
|
| ( |
| ( | |
Total | $ | ( | $ | ( | $ | ( |
By Classification: |
|
|
|
|
|
|
Policy fees | $ | $ | $ | |||
Net investment income |
|
| ( |
| ( | |
Net realized gains (losses) - excluding Fortitude Re funds withheld assets |
|
| ( |
| ( | |
Net realized losses on Fortitude Re funds withheld assets(a) |
| ( |
| ( |
| |
Policyholder benefits and claims incurred |
| ( |
|
| ||
Total | $ | ( | $ | ( | $ | ( |
(a)
246 AIG | 2021 Form 10-K
ITEM 8 | Notes to Consolidated Financial Statements | 10. Derivatives and Hedge Accounting
Credit Risk-Related Contingent Features
We estimate that at December 31, 2021, based on our outstanding financial derivative transactions, a downgrade of our long-term senior debt ratings to BBB or BBB– by Standard & Poor’s Financial Services LLC, a subsidiary of S&P Global Inc., and/or a downgrade to Baa2 or Baa3 by Moody’s Investors’ Service, Inc. would permit counterparties to make additional collateral calls and permit certain counterparties to elect early termination of contracts, resulting in corresponding collateral postings and termination payments in the total amount of up to approximately $
Hybrid Securities with Embedded Credit Derivatives
We invest in hybrid securities (such as credit-linked notes) with the intent of generating income and not specifically to acquire exposure to embedded derivative risk. As is the case with our other investments in RMBS, CMBS, CDOs and ABS, our investments in these hybrid securities are exposed to losses only up to the amount of our initial investment in the hybrid security. Other than our initial investment in the hybrid securities, we have
We elect to account for our investments in these hybrid securities with embedded written credit derivatives at fair value, with changes in fair value recognized in Net investment income and Other income. Our investments in these hybrid securities are reported as Other bond securities in the Consolidated Balance Sheets. The fair values of these hybrid securities were $
11. Goodwill and Other Intangible Assets
Goodwill represents the future economic benefits arising from assets acquired in a business combination that are not individually identified and separately recognized. Goodwill is tested for impairment at the reporting unit level, which is defined as an operating segment or one level below, and the test is performed annually, or more frequently if circumstances indicate an impairment may have occurred. At December 31, 2021, goodwill is reported within our General Insurance business – North America and International operating segments, our Life and Retirement business – Life Insurance operating segment and our Other Operations segment. When a business is transferred from one reporting unit to another, goodwill from the original reporting unit is allocated among reporting units based on the fair value of business transferred, relative to business retained by a reporting unit.
The impairment assessment involves an option to first assess qualitative factors to determine whether events or circumstances exist that lead to a determination that it is more likely than not that the fair value of a reporting unit is less than its carrying amount. If the qualitative assessment is not performed, or after assessing the totality of the events or circumstances, we determine it is more likely than not that the fair value of a reporting unit is less than its carrying amount, a quantitative assessment for potential impairment is performed.
If the qualitative test is not performed or if the test indicates a potential impairment is present, we estimate the fair value of each reporting unit and compare the estimated fair value with the carrying amount of the reporting unit, including allocated goodwill. The estimate of a reporting unit’s fair value involves management judgment and is based on one or a combination of approaches including discounted expected future cash flows, market-based earnings multiples of the unit’s peer companies, external appraisals or, in the case of reporting units being considered for sale, third-party indications of fair value, if available. We consider one or more of these estimates when determining the fair value of a reporting unit to be used in the impairment test.
If the estimated fair value of a reporting unit exceeds its carrying amount, goodwill is not impaired. If the carrying value of a reporting unit exceeds its estimated fair value, goodwill associated with that reporting unit potentially is impaired. The amount of impairment, if any, is measured as the excess of a reporting unit’s carrying amount over its fair value not to exceed the total amount of goodwill allocated to that reporting unit and recognized in income.
AIG | 2021 Form 10-K 247
ITEM 8 | Notes to Consolidated Financial Statements | 11. Goodwill and Other Intangible Assets
The following table presents the changes in goodwill by operating segment:
| General Insurance |
|
|
|
|
|
| |||
| North |
| Life |
| Other |
|
| |||
(in millions) | America | International | Insurance | Operations |
| Total | ||||
Balance at January 1, 2019: |
|
|
|
|
|
|
|
|
|
|
Goodwill - gross | $ | $ | $ | $ | $ | |||||
Accumulated impairments |
| ( |
| ( |
| ( |
| ( |
| ( |
Net goodwill |
|
|
|
|
| |||||
Increase (decrease) due to: |
|
|
|
|
|
|
|
|
|
|
Acquisitions |
|
|
|
|
| |||||
Other(a) |
|
|
| ( |
| ( |
| ( | ||
Balance at December 31, 2019: |
|
|
|
|
|
|
|
|
|
|
Goodwill - gross |
|
|
|
|
| |||||
Accumulated impairments |
| ( |
| ( |
| ( |
| ( |
| ( |
Net goodwill |
|
|
|
|
| |||||
Increase (decrease) due to: |
|
|
|
|
|
|
|
|
|
|
Dispositions |
| ( |
|
|
| ( |
| ( | ||
Other |
|
|
|
|
| |||||
Balance at December 31, 2020: |
|
|
|
|
|
|
|
|
|
|
Goodwill - gross |
|
|
|
|
| |||||
Accumulated impairments |
| ( |
| ( |
| ( |
| ( |
| ( |
Net goodwill |
|
|
|
|
| |||||
Increase (decrease) due to: |
|
|
|
|
|
|
|
|
|
|
Other |
|
| ( |
| ( |
|
| ( | ||
Balance at December 31, 2021: |
|
|
|
|
|
|
|
|
|
|
Goodwill - gross |
|
|
|
|
| |||||
Accumulated impairments |
| ( |
| ( |
| ( |
| ( |
| ( |
Net goodwill | $ | $ | $ | $ | $ | |||||
The Other intangible assets and Value of distribution network acquired (VODA) resulted primarily from the acquisition of Validus.
248 AIG | 2021 Form 10-K
ITEM 8 | Notes to Consolidated Financial Statements | 11. Goodwill and Other Intangible Assets
The following table presents the changes in other intangible assets and the VODA by operating segment:
| General Insurance |
|
|
|
|
|
| |||
| North |
| Life |
| Other |
|
| |||
(in millions) | America | International | Insurance | Operations |
| Total | ||||
Other intangible assets |
|
|
|
|
|
|
|
|
|
|
Balance at January 1, 2019 | $ | $ | $ | $ | $ | |||||
Increase (decrease) due to: |
|
|
|
|
|
|
|
|
|
|
Amortization |
| ( |
| ( |
| ( |
| ( |
| ( |
Other |
| ( |
|
| ( |
|
| ( | ||
Balance at December 31, 2019 | $ | $ | $ | $ | $ | |||||
Increase (decrease) due to: |
|
|
|
|
|
|
|
|
|
|
Dispositions |
|
|
|
| ( |
| ( | |||
Amortization |
| ( |
| ( |
| ( |
| ( |
| ( |
Other |
| ( |
|
|
| ( |
| ( | ||
Balance at December 31, 2020 | $ | $ | $ | $ | $ | |||||
Increase (decrease) due to: |
|
|
|
|
|
|
|
|
|
|
Amortization |
| ( |
|
| ( |
| ( |
| ( | |
Other |
| ( |
| ( |
| ( |
|
| ( | |
Balance at December 31, 2021 | $ | $ | $ | $ | $ | |||||
|
|
|
|
|
|
|
|
|
|
|
Value of distribution network acquired |
|
|
|
|
|
|
|
|
|
|
Balance at January 1, 2019 | $ | $ | $ | $ | $ | |||||
Increase (decrease) due to: |
|
|
|
|
|
|
|
|
|
|
Amortization |
|
|
|
| ( |
| ( | |||
Other |
|
|
|
|
| |||||
Balance at December 31, 2019 | $ | $ | $ | $ | $ | |||||
Increase (decrease) due to: |
|
|
|
|
|
|
|
|
|
|
Amortization |
|
|
|
| ( |
| ( | |||
Other |
|
|
|
|
| |||||
Balance at December 31, 2020 | $ | $ | $ | $ | $ | |||||
Increase (decrease) due to: |
|
|
|
|
|
|
|
|
|
|
Amortization |
|
|
|
| ( |
| ( | |||
Other |
|
|
|
|
| |||||
Balance at December 31, 2021 | $ | $ | $ | $ | $ | |||||
AIG | 2021 Form 10-K 249
12. Insurance Liabilities
Liability for Unpaid Losses and Loss Adjustment Expenses (Loss Reserves)
Loss reserves represent the accumulation of estimates of unpaid claims, including estimates for claims incurred but not reported and loss adjustment expenses, less applicable discount. We regularly review and update the methods used to determine loss reserve estimates. Any adjustments resulting from this review are reflected currently in pre-tax income, except to the extent such adjustment impacts a deferred gain under a retroactive reinsurance agreement, in which case the ceded portion would be amortized into pre-tax income in subsequent periods. Because these estimates are subject to the outcome of future events, changes in estimates are common given that loss trends vary and time is often required for changes in trends to be recognized and confirmed. Given the uncertainties around the impact from the COVID-19 pandemic, including the significant global economic slowdown, the full impact of COVID-19 and how it may ultimately impact the results of our insurance operations remains uncertain. In addition, in response to the pandemic, new governmental, legislative and regulatory initiatives have been put in place and continue to be developed that could result in additional restrictions and requirements relating to our policies that may have a negative impact on our business operations. We have recorded our estimate of the ultimate liability for losses that have occurred as of the balance sheet date associated with COVID-19 which reflects our expectations given the current facts and circumstances. We will continue to monitor and review the impact. Reserve changes that increase previous estimates of ultimate cost are referred to as unfavorable or adverse development or reserve strengthening. Reserve changes that decrease previous estimates of ultimate cost are referred to as favorable development.
Our gross loss reserves before reinsurance and discount are net of contractual deductible recoverable amounts due from policyholders of approximately $
250 AIG | 2021 Form 10-K
Years Ended December 31, |
|
| ||||
(in millions) |
| 2021 |
| 2020 |
| 2019 |
Liability for unpaid loss and loss adjustment expenses, beginning of year | $ | $ | $ | |||
Reinsurance recoverable |
| ( |
| ( |
| ( |
Initial allowance upon CECL adoption |
|
|
| |||
Net Liability for unpaid loss and loss adjustment expenses, beginning of year |
|
|
| |||
Losses and loss adjustment expenses incurred: |
|
|
|
|
|
|
Current year |
|
|
| |||
Prior years, excluding discount and amortization of deferred gain |
| ( |
| ( |
| ( |
Prior years, discount charge (benefit) |
| ( |
|
| ||
Prior years, amortization of deferred gain on retroactive reinsurance(a) |
| ( |
| ( |
| ( |
Total losses and loss adjustment expenses incurred |
|
|
| |||
Losses and loss adjustment expenses paid: |
|
|
|
|
|
|
Current year |
| ( |
| ( |
| ( |
Prior years |
| ( |
| ( |
| ( |
Total losses and loss adjustment expenses paid |
| ( |
| ( |
| ( |
Other changes: |
|
|
|
|
|
|
Foreign exchange effect |
| ( |
|
| ( | |
Allowance for credit losses |
|
| ( |
| ||
Retroactive reinsurance adjustment (net of discount)(b) |
|
|
| |||
Fortitude sale(c) |
|
| ( |
| ||
Total other changes |
| ( |
| ( |
| |
Liability for unpaid loss and loss adjustment expenses, end of year: |
|
|
|
|
|
|
Net liability for unpaid losses and loss adjustment expenses |
|
|
| |||
Reinsurance recoverable |
|
|
| |||
Total | $ | $ | $ | |||
(a)
Includes $
(b)
Includes benefit (charge) from change in discount on retroactive reinsurance in the amount of $(
(c) On June 2, 2020, AIG completed the Majority Interest Fortitude Sale. Concurrent with the Majority Interest Fortitude Sale, AIG established a reinsurance recoverable. For additional information see Note 1.
| Net liability for unpaid losses | Reinsurance recoverable on | Gross liability | |||
| and loss adjustment expenses | unpaid losses and loss | for unpaid | |||
| as presented in the | adjustment expenses included in | losses and loss | |||
(in millions) | disaggregated tables below | the disaggregated tables below | adjustment expenses | |||
U.S. Workers' Compensation (before discount) | $ | $ | $ | |||
U.S. Excess Casualty |
|
|
| |||
U.S. Other Casualty |
|
|
| |||
U.S. Financial Lines |
|
|
| |||
U.S. Property and Special Risks |
|
|
| |||
U.S. Personal Insurance |
|
|
| |||
UK/Europe Casualty and Financial lines |
|
|
| |||
UK/Europe Property and Special Risks |
|
|
| |||
UK/Europe and Japan Personal Insurance |
|
|
| |||
Total | $ | $ | $ | |||
Reconciling Items |
|
|
|
|
|
|
Discount on workers' compensation lines |
|
|
|
|
| ( |
Other product lines* |
|
|
|
|
| |
Unallocated loss adjustment expenses |
|
|
|
|
| |
Total Loss Reserves |
|
|
|
| $ | |
AIG | 2021 Form 10-K 251
Prior Year Development
In the sections below, we provide details by coverage group regarding incurred losses, reserve balances and prior year development. The first table below shows prior year development by coverage group, the first two columns of which will again be presented in the coverage group sections that follow. After this table we describe historical drivers of prior year development as well as actuarial methods and relevant terminology. The following coverage group sections present the undiscounted incurred losses and allocated loss adjustment expenses by accident year on a net basis after reinsurance, with separate presentation of the adverse development cover where applicable, excluding related amortization of the deferred gain. Each section also contains details on drivers of prior year development and a description of our reserving process and methodology. Finally, we show a table of claims payout patterns by coverage.
The following table presents the reconciliation of net prior year development before the adverse development reinsurance agreement (ADC) cessions from the tables below to the net prior year development after ADC cessions and amortization of deferred gain for the year ended December 31, 2021:
|
| Prior Year |
| Prior Year |
|
|
|
| Prior Year | |
|
| Development |
| Development |
|
|
|
| Development | |
|
| Net of External |
| Net of External |
|
| Amortization | After | ||
|
| Reinsurance |
| Reinsurance | Re-Attribution | of Deferred | Amortization | |||
|
| Before ADC |
| After ADC | of ADC | Gain at | and | |||
(in millions) |
| Cessions |
| Cessions(a) | Recovery(b) | Inception | Re-Attribution | |||
U.S. Workers' Compensation | $ | ( | $ | ( | $ | $ | ( | $ | ( | |
U.S. Excess Casualty |
|
|
| ( |
| ( |
| ( | ||
U.S. Other Casualty |
| ( |
|
| ( |
| ( |
| ||
U.S. Financial Lines |
|
|
| ( |
| ( |
| |||
U.S. Property and Special Risks |
|
|
| ( |
| ( |
| |||
U.S. Personal Insurance |
| ( |
| ( |
|
| ( |
| ( | |
UK/Europe Casualty and Financial lines |
|
|
|
|
| |||||
UK/Europe Property and Special Risks |
| ( |
| ( |
|
|
| ( | ||
UK/Europe and Japan Personal Insurance |
| ( |
| ( |
|
|
| ( | ||
Other Operations Run-Off |
|
|
|
|
| |||||
Other product lines |
| ( |
| ( |
|
|
| ( | ||
Subtotal, adjusted pre-tax basis | $ | ( | $ | $ | $ | ( | $ | ( | ||
|
|
|
|
|
|
|
|
|
|
|
Remove impact of Retroactive Reinsurance |
|
|
|
|
|
|
|
| ||
Amortization of deferred gain at inception |
|
|
|
|
|
|
| |||
Prior year development ceded under the Asbestos LPT |
|
|
|
|
|
|
| |||
Prior year development ceded under the ADC |
|
|
|
|
|
|
| ( | ||
Total, prior years, excluding discount and amortization of deferred gain | $ | ( | ||||||||
During 2021, we recognized favorable prior year loss reserve development of $
Favorable development on U.S. Workers’ Compensation business where we see continued favorable loss development;
Favorable development in Personal Lines driven by subrogation recoveries from catastrophe events;
Favorable development on Europe and Japan Personal Insurance driven by favorable accident and health and personal auto experience;
Favorable development on Property and Special Risks driven by UK and Europe specialty business;
Unfavorable development in U.S. Financial Lines, notably Directors & Officers (D&O), Employers Liability (EPLI) and Cyber coverages;
Unfavorable development on Casualty and Financial Lines in Europe and UK;
Unfavorable development in Property, Specialty, and other miscellaneous coverages largely driven by reductions in reinsurance recoveries due to changes in catastrophe loss estimates; and
252 AIG | 2021 Form 10-K
Marginally unfavorable development in excess casualty and medical malpractice coverages, partially offset by favorable development in primary general liability.
During 2020, we recognized favorable prior year loss reserve development of $
Favorable development on U.S. Workers’ Compensation business, both guaranteed cost business and large deductible, where we reacted to favorable loss trends in recent accident years;
Favorable development across the combination of primary and excess casualty coverages;
Favorable development in Property, Specialty, and other miscellaneous coverages;
Unfavorable development in U.S. Financial Lines, notably D&O, EPLI, Mergers and Acquisitions, Cyber and Non-Medical Professional Errors & Omissions business where we reacted to increasing frequency and severity in recent accident years;
Unfavorable development in Personal Lines where we reacted to adverse development in Homeowners and Umbrella;
Unfavorable development on Financial Lines driven by low frequency and high severity seen in D&O, especially in UK/Europe and Australia;
Favorable development on Property and Special Risks globally driven by UK/Europe; and
Favorable development on Europe and Japan Personal Insurance driven by favorable frequency and severity trends.
During 2019, we recognized favorable prior year loss reserve development of $
Favorable development on U.S. Workers’ Compensation business, both guaranteed cost business and large deductible and Defense Base Act business (covering government contractors serving at military bases overseas) where we reacted to favorable loss trends in recent accident years;
Favorable development on 2017 Hurricanes (Harvey, Irma and Maria) and favorable development due to 2017 California wildfire subrogation recoverables in Commercial Property and Personal Lines.
Unfavorable development in Primary General Liability where we reacted to adverse frequency and severity trends especially in Construction Wrap business in recent accident years.
Unfavorable development in U.S. Financial Lines, notably D&O, EPLI and Non-Medical Professional Errors & Omissions business where we reacted to increasing frequency and severity in recent accident years.
Unfavorable development on European Casualty & Financial Lines, notably Commercial Auto, Employers Liability, Directors & Officers, and Financial Institutions business; and
Favorable development on Europe Property and Special Risks, Europe and Japan Personal Insurance and Other product lines.
Our analyses and conclusions about prior year reserves also help inform our judgments about the current accident year loss and loss adjustment expense ratios we selected.
Loss Development Information
The following is information about incurred and paid loss developments as of December 31, 2021, net of reinsurance. The cumulative number of reported claims, the total of IBNR liabilities and expected development on reported loss included within the net incurred loss amounts are presented in the following section.
Reserving Methodology
We use a combination of methods to project ultimate losses for both long-tail and short-tail exposures, which include:
Paid Development method: The Paid Development method estimates ultimate losses by reviewing paid loss patterns and selecting paid ultimate loss development factors. These factors are then applied to paid losses by applying them to accident years, with further expected changes in paid loss. Since the method does not rely on case reserves, it is not directly influenced by changes in the adequacy of case reserves.
Incurred Development method: The Incurred Development method is similar to the Paid Development method, but it uses case incurred losses instead of paid losses. Since this method uses more data (case reserves in addition to paid losses) than the Paid Development method, the incurred development patterns may be less variable than paid development patterns.
Expected Loss Ratio method: The Expected Loss Ratio method multiplies premiums by an expected loss ratio to produce ultimate loss estimates for each accident year. This method may be useful if loss development patterns are inconsistent, losses emerge very slowly, or there is relatively little loss history from which to estimate future losses.
AIG | 2021 Form 10-K 253
Bornhuetter-Ferguson method: The Bornhuetter-Ferguson method using premiums and paid losses is a combination of the Paid Development method and the Expected Loss Ratio method where the weight given to each method is the reciprocal of the loss development factor. This method normally determines expected loss ratios similar to the method used for the Expected Loss Ratio method. The Bornhuetter-Ferguson method using premiums and incurred losses is similar to the Bornhuetter-Ferguson method using premiums and paid losses except that it uses case-incurred losses.
Cape Cod method: The Cape Cod method is mechanically similar to the Bornhuetter-Ferguson method with the difference being that the Expected Loss Ratio estimates are determined based on a weighting of the loss estimates that come from the Paid/Incurred Development Methods. This method may be more responsive to recent loss trends than the Bornhuetter-Ferguson method.
Average Loss method: The Average Loss method multiplies a projected number of ultimate claims by an estimated ultimate severity average loss for each accident year to produce ultimate loss estimates. Since projections of the ultimate number of claims are often less variable than projections of ultimate loss, this method can provide more reliable results for reserve categories where loss development patterns are inconsistent or too variable to be relied on exclusively.
In updating our loss reserve estimates, we consider and evaluate inputs from many sources, including actual claims data, the performance of prior reserve estimates, observed industry trends, our internal peer review processes, including challenges and recommendations from our Enterprise Risk Management group, as well as the views of third-party actuarial firms. We use these inputs to improve our evaluation techniques, and to analyze and assess the change in estimated ultimate loss for each accident year by product line. Our analyses produce a range of indications from various methods, from which we select our best estimate.
In determining the actual carried loss reserves, we consider both the internal actuarial best estimate and numerous other internal and external factors, including:
an assessment of economic conditions, including real GDP growth, inflation, employment rates or unemployment duration, stock market volatility and changes in corporate bond spreads;
changes in the legal, regulatory, judicial and social environment, including changes in road safety, public health and cleanup standards;
changes in medical cost trends (inflation, intensity and utilization of medical services) and wage inflation trends;
underlying policy pricing, terms and conditions including attachment points and policy limits;
change in claims handling philosophy, operating model, processes, and related ongoing enhancements;
third-party claims reviews that are periodically performed for key classes of claims such as toxic tort, environmental and other complex casualty claims;
third-party actuarial reviews that are periodically performed for key classes of business;
input from underwriters on pricing, terms, and conditions and market trends; and
changes in our reinsurance program, pricing and commutations.
The following factors are relevant to the loss development information included in the tables below:
Table organization: The tables are organized by accident year and include policies written on an occurrence and claims- made basis. We note that for certain categories of claims (e.g., construction defect claims and environmental claims) and for reinsurance recoverable, losses may sometimes be reclassified to an earlier or later accident year as more information about the date of occurrence becomes available to us. These reclassifications are shown as development in the respective years in the tables below. Financial Lines business is primarily written on a claims-made basis, while the majority of the workers’ compensation, excess casualty, other casualty, and run-off property and casualty lines of business are written on an occurrence basis. Primarily, all short-tail lines in Property and Special Risks and Personal Insurance are written on an occurrence basis.
Groupings: We believe our groupings have homogenous risk characteristics with similar development patterns and would generally be subject to similar trends and reflect our reportable segments. The incurred losses and loss adjustment expenses and paid losses in the following tables for the current reporting year are allocated to the line of business and accident years based on how the business is coded by profit center and line of business.
Reinsurance: Our reinsurance program varies by exposure type. Historically we have leveraged facultative and treaty reinsurance, both on a pro-rata and excess of loss basis. Our reinsurance program may change from year to year, which may affect the comparability of the data presented in our tables.
254 AIG | 2021 Form 10-K
Adverse development reinsurance agreement: We have provided the impact of the ADC in an additional table below our Incurred Losses and Allocated Loss Adjustment Expenses (ALAE) tables. The impact of the ADC is shown beginning in 2016 given the retroactive date of the contract and coincides with the effective date of the contract. For the lines of business covered by the agreement (U.S. Workers' Compensation, U.S. Excess Casualty, U.S. Other Casualty, U.S. Financial Lines, U.S. Property and Special Risks and U.S. Personal Insurance or collectively, the Covered Lines), an attribution of the loss recoveries to the line of business by calendar year and accident year is performed based on the underlying distribution of the losses subject to the agreement. Specifically, the future claim payments for all subject incurred losses were projected into future years based on the same actuarial assumptions underlying the related reserves. The additional table presented after discussion of prior year development by line of business reconciles the changes in net ultimates to our overall prior year development and provides the reattribution of loss recoveries for the Covered Lines. The reinsurance terms of the ADC were then used to identify the future claims payments for which 80% will be reimbursed by NICO. At each reporting period, the attribution of the ADC recoveries is performed. The factors that could cause the attribution to lines of business and accident year to change include changes in underlying actuarial assumptions as to timing and amount of future claim payments.
Incurred but not reported liabilities (IBNR): We include development from past reported losses in IBNR.
Data excluded from tables: Information with respect to accident years older than ten years is excluded from the development tables. Unallocated loss adjustment expenses are also excluded.
Foreign exchange: The loss development for operations outside of the U.S. is presented for all accident years using the current exchange rate at December 31, 2021. Although this approach requires restating all prior accident year information, the changes in exchange rates do not impact incurred and paid loss development trends.
Acquisitions: We include acquisitions from all accident years presented in the tables. For purposes of this disclosure, we have applied the retrospective method for the acquired reserves, including incurred and paid claim development histories throughout the relevant tables. It should be noted that historical reserves for the acquired businesses were established by the acquired companies using methods, assumptions and procedures then in effect which may differ from our current reserving bases. Accordingly, it may not be appropriate to extrapolate future redundancies or deficiencies based on the aggregated historical results shown in the triangles.
Dispositions: We exclude dispositions from all accident years presented in the tables.
Claim counts: We consider a reported claim to be one claim for each claimant or feature for each loss occurrence. Claims relating to losses that are 100 percent reinsured are excluded from the reported claims in the tables below. Reported claims for losses from assumed reinsurance contracts are not available and hence not included in the reported claims.
There are limitations that should be considered on the reported claim count data in the tables below, including:
- Claim counts are presented only on a reported (not an ultimate) basis;
- The tables below include lines of business and geographies at a certain aggregated level which may indicate different frequency and severity trends and characteristics, and may not be as meaningful as the claim count information related to the individual products within those lines of business and geographies;
- Certain lines of business are more likely to be subject to occurrences involving multiple claimants and features, which can distort measures based on the reported claim counts in the table below; and
- Reported claim counts are not adjusted for ceded reinsurance, which may distort the measure of frequency or severity.
Supplemental Information: The information about incurred and paid loss development for all periods preceding the year ended December 31, 2021 and the related historical claims payout percentage disclosure is unaudited and is presented as supplementary information.
AIG | 2021 Form 10-K 255
The following tables present undiscounted, incurred and paid losses and allocated loss adjustment expenses by accident year, on a net basis after reinsurance, with a separate presentation of the ADC excluding the related amortization of the deferred gain:
U.S. Workers' Compensation
During 2021, we recognized $
During 2020, we recognized $
During 2019, we recognized $
Incurred Losses and Allocated Loss Adjustment Expenses, Undiscounted and Net of Reinsurance | |||||||||||||||||||||||||||||||||||
|
|
|
|
|
|
|
|
|
|
|
|
|
|
|
|
|
|
|
|
|
|
|
|
|
|
|
|
|
|
|
|
|
|
|
|
| Years Ended December 31, (in millions) |
|
|
| December 31, 2021 |
|
|
|
|
|
|
|
| ||||||||||||||||||||||
Accident Year |
| 2012 |
| 2013 |
| 2014 |
| 2015 |
| 2016 |
| 2017 |
| 2018 |
| 2019 |
| 2020 |
|
| 2021 |
| 2021 Prior Year Development Excluding the Impact of Adverse Development Reinsurance Agreement |
| Total of IBNR Liabilities Plus Expected Development on Reported Losses |
| Cumulative Number of Reported Claims |
| Incurred Impact of Adverse Development Reinsurance Agreement |
| IBNR Impact of Adverse Development Reinsurance Agreement |
| 2021 (Net of Impact of Adverse Development Reinsurance Agreement) |
| Total of IBNR Liabilities Net of Impact of Adverse Development Reinsurance Agreement |
| Unaudited |
|
|
|
|
|
|
|
|
|
|
|
|
|
|
|
|
| |||||||||||||||||
2012 | $ | $ | $ | $ | $ | $ | $ | $ | $ |
| $ | $ | ( | $ |
| $ | ( | $ | ( | $ | $ | ||||||||||||||
2013 |
|
|
|
|
|
|
|
|
|
|
|
|
| ( |
|
|
| ( |
| ( |
|
| |||||||||||||
2014 |
|
|
|
|
|
|
|
|
|
|
|
|
|
| ( |
|
|
| ( |
| ( |
|
| ||||||||||||
2015 |
|
|
|
|
|
|
|
|
|
|
|
|
|
|
| ( |
|
|
| ( |
| ( |
|
| |||||||||||
2016 |
|
|
|
|
|
|
|
|
|
|
|
|
|
|
|
| ( |
|
|
|
|
|
| ||||||||||||
2017 |
|
|
|
|
|
|
|
|
|
|
|
|
|
|
|
|
| ( |
|
|
|
|
|
| |||||||||||
2018 |
|
|
|
|
|
|
|
|
|
|
|
|
|
|
|
|
|
| ( |
|
|
|
|
|
| ||||||||||
2019 |
|
|
|
|
|
|
|
|
|
|
|
|
|
|
|
|
|
|
| ( |
|
|
|
|
|
| |||||||||
2020 |
|
|
|
|
|
|
|
|
|
|
|
|
|
|
|
|
|
|
|
| ( |
|
|
|
|
|
| ||||||||
2021 |
|
|
|
|
|
|
|
|
|
|
|
|
|
|
|
|
|
|
|
|
|
|
|
|
|
|
|
| |||||||
Total |
|
|
|
|
|
|
|
|
|
|
|
|
|
|
|
|
|
|
| $ | $ | ( |
|
|
|
| $ | ( |
|
| $ |
|
| ||
Cumulative Paid Losses and Allocated Loss Adjustment Expenses, Net of |
|
|
|
|
|
|
|
|
|
|
|
|
|
|
|
|
| ||||||||||||||||||
Reinsurance from the table below |
|
| ( |
|
|
|
|
|
|
|
|
| ( |
|
| ||||||||||||||||||||
Liabilities for losses and loss adjustment expenses and prior year development |
|
|
|
|
|
|
|
|
|
|
|
|
|
|
|
|
| ||||||||||||||||||
before accident year 2012, net of reinsurance |
|
|
| ( |
|
|
|
|
| ( |
|
|
|
|
| ||||||||||||||||||||
Unallocated loss adjustment expense prior year development |
|
|
|
|
|
|
|
|
|
|
|
|
|
|
|
| |||||||||||||||||||
Liabilities for losses and loss adjustment expenses and prior year loss |
|
|
|
|
|
|
|
|
|
|
|
|
|
|
|
|
| ||||||||||||||||||
development, net of reinsurance |
| $ | $ | ( |
|
|
|
| $ | ( |
|
| $ |
|
| ||||||||||||||||||||
256 AIG | 2021 Form 10-K
Incurred Losses and Loss Adjustment Expenses, Undiscounted, Net of Reinsurance (including impact of ADC) | ||||||||||||||
| Calendar Years Ended December 31, (in millions) |
| Prior Year Development | |||||||||||
Accident Year |
| 2016 |
| 2017 |
| 2018 |
| 2019 |
| 2020 |
| 2021 |
| |
| Unaudited |
|
|
|
| |||||||||
2012 | $ | $ | $ | $ | $ | $ | $ | |||||||
2013 |
|
|
|
|
|
|
| ( | ||||||
2014 |
|
|
|
|
|
|
| ( | ||||||
2015 |
|
|
|
|
|
|
| ( | ||||||
2016 |
|
|
|
|
|
|
| ( | ||||||
2017 |
|
|
|
|
|
|
|
| ( | |||||
2018 |
|
|
|
|
|
|
|
|
| ( | ||||
2019 |
|
|
|
|
|
|
|
|
|
| ( | |||
2020 |
|
|
|
|
|
|
|
|
|
|
| ( | ||
2021 |
|
|
|
|
|
|
|
|
|
|
|
|
| |
Total | $ | $ | $ | $ | $ | $ | $ | ( | ||||||
Cumulative Paid Losses and Allocated Loss Adjustment Expenses, Net of Reinsurance from the table below |
| ( |
|
| ||||||||||
Liabilities for losses and allocated loss adjustment expenses and prior year development before 2012, net of reinsurance |
|
| ( | |||||||||||
Unallocated loss adjustment expense prior year development |
|
|
| ( | ||||||||||
Liabilities for losses and loss adjustment expenses and prior year loss development, net of reinsurance | $ | $ | ( | |||||||||||
|
| Calendar Years Ended December 31, (in millions) |
| Prior Year Development | ||||||||||
Accident Year |
| 2016 |
| 2017 |
| 2018 |
| 2019 |
| 2020 |
| 2021 |
| |
|
| Unaudited |
|
|
|
| ||||||||
2012 | $ | ( | $ | ( | $ | ( | $ | ( | $ | ( | $ | ( | $ | |
2013 |
| ( |
| ( |
| ( |
| ( |
| ( |
| ( |
| ( |
2014 |
| ( |
| ( |
| ( |
| ( |
| ( |
| ( |
| ( |
2015 |
| ( |
| ( |
| ( |
| ( |
| ( |
| ( |
| ( |
2016 |
|
|
|
|
|
|
| |||||||
2017 |
| - |
|
|
|
|
|
| ||||||
2018 |
| - |
| - |
|
|
|
|
| |||||
2019 |
| - |
| - |
| - |
|
|
|
| ||||
2020 |
| - |
| - |
| - |
| - |
|
|
| |||
2021 |
| - |
| - |
| - |
| - |
| - |
|
| ||
Total | $ | ( | $ | ( | $ | ( | $ | ( | $ | ( | $ | ( | $ | ( |
Cumulative Paid Losses and Allocated Loss Adjustment Expenses, Net of Reinsurance from the table below |
|
|
| |||||||||||
Liabilities for losses and allocated loss adjustment expenses and prior year development before 2012, net of reinsurance |
| ( |
| |||||||||||
Unallocated loss adjustment expense prior year development |
|
|
| ( | ||||||||||
Liabilities for losses and loss adjustment expenses and prior year loss development, net of reinsurance |
|
|
|
| $ | ( | $ | |||||||
AIG | 2021 Form 10-K 257
Cumulative Paid Losses and Allocated Loss Adjustment Expenses, Net of Reinsurance | |||||||||||||||||||||||
|
|
|
|
|
|
|
|
|
|
|
|
|
|
|
|
|
|
|
|
|
|
|
|
| Years Ended December 31, (in millions) |
|
| ||||||||||||||||||||
Accident Year |
| 2012 |
| 2013 |
| 2014 |
| 2015 |
| 2016 |
| 2017 |
| 2018 |
| 2019 |
| 2020 |
|
| 2021 |
| Paid Impact of Adverse Development Reinsurance Agreement |
| Unaudited |
|
|
|
|
| |||||||||||||||||
2012 | $ | $ | $ | $ | $ | $ | $ | $ | $ |
| $ | $ | ( | ||||||||||
2013 |
|
|
|
|
|
|
|
|
|
|
|
|
| ( | |||||||||
2014 |
|
|
|
|
|
|
|
|
|
|
|
|
|
| ( | ||||||||
2015 |
|
|
|
|
|
|
|
|
|
|
|
|
|
|
| ( | |||||||
2016 |
|
|
|
|
|
|
|
|
|
|
|
|
|
|
|
| |||||||
2017 |
|
|
|
|
|
|
|
|
|
|
|
|
|
|
|
|
| ||||||
2018 |
|
|
|
|
|
|
|
|
|
|
|
|
|
|
|
|
|
| |||||
2019 |
|
|
|
|
|
|
|
|
|
|
|
|
|
|
|
|
|
|
| ||||
2020 |
|
|
|
|
|
|
|
|
|
|
|
|
|
|
|
|
|
|
|
| |||
2021 |
|
|
|
|
|
|
|
|
|
|
|
|
|
|
|
|
|
|
|
|
| ||
Total |
|
|
|
|
|
|
|
|
|
|
|
|
|
|
|
|
|
|
| $ | $ | ( | |
Reserving Process and Methodology
U.S. Workers’ Compensation is an extremely long-tail line of business, with loss emergence extending for decades. We generally use a combination of loss development, frequency/severity and expected loss ratio methods for workers’ compensation.
Many of our workers compensation policies contain risk-sharing features, including high deductibles, self-insured retentions or retrospective rating features, in addition to a traditional insurance component. These risk-sharing programs generally are large and complex, comprising multiple products, years and structures, and are subject to amendment over time. We group guaranteed cost and excess of deductible business separately and then further by state and industry subset to the extent that meaningful differences are determined to exist. We also separately analyze certain subsets of the portfolio that have unique characteristics (e.g., U.S. government sub-contractor accounts and construction wrap-up business). For excess of deductible business, we also segment by size of deductible and whether the claim is handled by AIG or an outside third-party administrator. The proportion of large deductible business has increased over time, which has slowed the reporting pattern of claims.
For guaranteed cost business, expected loss ratio methods generally are given significant weight only in the most recent accident year. Workers’ compensation claims are generally characterized by high frequency, low severity, and relatively consistent loss development from one accident year to the next. We historically have been a leading writer of workers’ compensation, and thus have sufficient volume of claims experience to use development methods. We generally segregate California (CA) and New York (NY) businesses from the other states to reflect their different development patterns and changing percentage of the mix by state. The claims development tables above are impacted by two other significant initiatives, which offset each other. In recent years, we instituted claims strategy changes and loss mitigation efforts to accelerate settlements, which we believe results in an overall reduction in claim costs. This strategy resulted in an increase in paid losses along the latest diagonals relative to prior years. In addition, we have been reducing premium volume in recent years and shifting a greater proportion of business to insured risk retention structures such as high deductible policies. These mix and volume changes slowed paid and incurred development since excess of deductible claims will typically take longer to emerge and settle.
Expected loss ratio methods for business written in excess of a deductible may be given significant weight in the most recent five accident years. In the 2016 analysis, we increased our tail factor estimates for states other than NY and CA for guaranteed cost business in recognition of longer medical development patterns that we have been seeing in recent years. We reflected increases in legal costs we have seen across the portfolio, particularly in California. The expected loss ratios used for recent accident years are based on the projected ultimate loss ratios for older years adjusted for rate changes, loss trend including inflation, and where appropriate, changing market conditions.
Additionally, over the years we have written a number of very large accounts which include workers’ compensation coverage. These accounts are generally individually priced by our actuaries, and to the extent appropriate, the indicated losses based on the pricing analysis may be used to record the initial estimated loss reserves for these accounts. Recent COVID-19 related events have caused disruption in claims frequency and severity as well as reporting patterns. Where appropriate and identifiable, adjustments have been made to standard projection techniques. Changes in Claims organization management, differing referral and review criteria and other factors may also be expected to alter loss emergence.
258 AIG | 2021 Form 10-K
U.S. Excess Casualty
During 2021, we recognized $
During 2020, we recognized $
During 2019, we recognized $
Incurred Losses and Allocated Loss Adjustment Expenses, Undiscounted and Net of Reinsurance | |||||||||||||||||||||||||||||||||||
|
|
|
|
|
|
|
|
|
|
|
|
|
|
|
|
|
|
|
|
|
|
|
|
|
|
|
|
|
|
|
|
|
|
|
|
| Years Ended December 31, (in millions) |
|
|
| December 31, 2021 |
|
|
|
|
|
|
|
| ||||||||||||||||||||||
Accident Year |
| 2012 |
| 2013 |
| 2014 |
| 2015 |
| 2016 |
| 2017 |
| 2018 |
| 2019 |
| 2020 |
|
| 2021 |
| 2021 Prior Year Development Excluding the Impact of Adverse Development Reinsurance Agreement |
| Total of IBNR Liabilities Plus Expected Development on Reported Losses |
| Cumulative Number of Reported Claims |
| Incurred Impact of Adverse Development Reinsurance Agreement |
| IBNR Impact of Adverse Development Reinsurance Agreement |
| 2021 (Net of Impact of Adverse Development Reinsurance Agreement) |
| Total of IBNR Liabilities Net of Impact of Adverse Development Reinsurance Agreement |
| Unaudited |
|
|
|
|
|
|
|
|
|
|
|
|
|
|
|
|
| |||||||||||||||||
2012 | $ | $ | $ | $ | $ | $ | $ | $ | $ |
| $ | $ | $ |
| $ | ( | $ | ( | $ | $ | |||||||||||||||
2013 |
|
|
|
|
|
|
|
|
|
|
|
|
| ( |
|
|
| ( |
| ( |
|
| |||||||||||||
2014 |
|
|
|
|
|
|
|
|
|
|
|
|
|
|
|
|
| ( |
| ( |
|
| |||||||||||||
2015 |
|
|
|
|
|
|
|
|
|
|
|
|
|
|
|
|
|
| ( |
| ( |
|
| ||||||||||||
2016 |
|
|
|
|
|
|
|
|
|
|
|
|
|
|
|
| ( |
|
|
|
|
|
| ||||||||||||
2017 |
|
|
|
|
|
|
|
|
|
|
|
|
|
|
|
|
|
|
|
|
|
|
| ||||||||||||
2018 |
|
|
|
|
|
|
|
|
|
|
|
|
|
|
|
|
|
|
|
|
|
|
|
| |||||||||||
2019 |
|
|
|
|
|
|
|
|
|
|
|
|
|
|
|
|
|
|
|
|
|
|
|
|
| ||||||||||
2020 |
|
|
|
|
|
|
|
|
|
|
|
|
|
|
|
|
|
|
|
|
|
|
|
|
|
| |||||||||
2021 |
|
|
|
|
|
|
|
|
|
|
|
|
|
|
|
|
|
|
|
|
|
|
|
|
|
|
|
| |||||||
Total |
|
|
|
|
|
|
|
|
|
|
|
|
|
|
|
|
|
|
| $ | $ |
|
|
|
| $ | ( |
|
| $ |
|
| |||
Cumulative Paid Losses and Allocated Loss Adjustment Expenses, Net of |
|
|
|
|
|
|
|
|
|
|
|
|
|
|
|
|
| ||||||||||||||||||
Reinsurance from the table below |
|
| ( |
|
|
|
|
|
|
|
|
| ( |
|
| ||||||||||||||||||||
Liabilities for losses and loss adjustment expenses and prior year development |
|
|
|
|
|
|
|
|
|
|
|
|
|
|
|
|
| ||||||||||||||||||
before accident year 2012, net of reinsurance |
|
|
| ( |
|
|
|
|
| ( |
|
|
|
|
| ||||||||||||||||||||
Unallocated loss adjustment expense prior year development |
|
|
|
|
|
|
|
|
|
|
|
|
|
|
|
| |||||||||||||||||||
Liabilities for losses and loss adjustment expenses and prior year loss |
|
|
|
|
|
|
|
|
|
|
|
|
|
|
|
|
| ||||||||||||||||||
development, net of reinsurance |
| $ | $ |
|
|
|
| $ | ( |
|
| $ |
|
| |||||||||||||||||||||
AIG | 2021 Form 10-K 259
Incurred Losses and Loss Adjustment Expenses, Undiscounted, Net of Reinsurance (including impact of ADC) | ||||||||||||||
|
| Calendar Years Ended December 31, (in millions) |
| Prior Year Development | ||||||||||
Accident Year |
| 2016 |
| 2017 |
| 2018 |
| 2019 |
| 2020 |
| 2021 |
| |
|
| Unaudited |
|
|
|
| ||||||||
2012 | $ | $ | $ | $ | $ | $ | $ | ( | ||||||
2013 |
|
|
|
|
|
|
| |||||||
2014 |
|
|
|
|
|
|
| |||||||
2015 |
|
|
|
|
|
|
| |||||||
2016 |
|
|
|
|
|
|
| ( | ||||||
2017 |
|
|
|
|
|
|
|
| ||||||
2018 |
|
|
|
|
|
|
|
|
| |||||
2019 |
|
|
|
|
|
|
|
|
|
| ||||
2020 |
|
|
|
|
|
|
|
|
|
|
| |||
2021 |
|
|
|
|
|
|
|
|
|
|
|
|
| |
Total | $ | $ | $ | $ | $ | $ | $ | |||||||
Cumulative Paid Losses and Allocated Loss Adjustment Expenses, Net of Reinsurance from the table below |
| ( |
|
| ||||||||||
Liabilities for losses and allocated loss adjustment expenses and prior year development before 2012, net of reinsurance |
|
| ( | |||||||||||
Unallocated loss adjustment expense prior year development |
|
|
| |||||||||||
Liabilities for losses and loss adjustment expenses and prior year loss development, net of reinsurance |
|
| $ | $ | ||||||||||
|
| Calendar Years Ended December 31, (in millions) |
| Prior Year Development | ||||||||||
Accident Year |
| 2016 |
| 2017 |
| 2018 |
| 2019 |
| 2020 |
| 2021 |
| |
|
| Unaudited |
|
|
|
| ||||||||
2012 | $ | ( | $ | ( | $ | ( | $ | ( | $ | ( | $ | ( | $ | ( |
2013 |
| ( |
| ( |
| ( |
| ( |
| ( |
| ( |
| |
2014 |
| ( |
| ( |
| ( |
| ( |
| ( |
| ( |
| |
2015 |
| ( |
| ( |
| ( |
| ( |
| ( |
| ( |
| ( |
2016 |
|
|
|
|
|
|
| |||||||
2017 |
| - |
|
|
|
|
|
| ||||||
2018 |
| - |
| - |
|
|
|
|
| |||||
2019 |
| - |
| - |
| - |
|
|
|
| ||||
2020 |
| - |
| - |
| - |
| - |
|
|
| |||
2021 |
| - |
| - |
| - |
| - |
| - |
|
| ||
Total | $ | ( | $ | ( | $ | ( | $ | ( | $ | ( | $ | ( | $ | ( |
Cumulative Paid Losses and Allocated Loss Adjustment Expenses, Net of Reinsurance from the table below |
|
|
| |||||||||||
Liabilities for losses and allocated loss adjustment expenses and prior year development before 2012, net of reinsurance |
| ( |
| ( | ||||||||||
Unallocated loss adjustment expense prior year development |
|
|
| |||||||||||
Liabilities for losses and loss adjustment expenses and prior year loss development, net of reinsurance | $ | ( | $ | |||||||||||
260 AIG | 2021 Form 10-K
Cumulative Paid Losses and Allocated Loss Adjustment Expenses, Net of Reinsurance | |||||||||||||||||||||||
|
|
|
|
|
|
|
|
|
|
|
|
|
|
|
|
|
|
|
|
|
|
|
|
| Years Ended December 31, (in millions) |
|
| ||||||||||||||||||||
Accident Year |
| 2012 |
| 2013 |
| 2014 |
| 2015 |
| 2016 |
| 2017 |
| 2018 |
| 2019 |
| 2020 |
|
| 2021 |
| Paid Impact of Adverse Development Reinsurance Agreement |
| Unaudited |
|
|
|
|
| |||||||||||||||||
2012 | $ | $ | $ | $ | $ | $ | $ | $ | $ |
| $ | $ | ( | ||||||||||
2013 |
|
|
|
|
|
|
|
|
|
|
|
|
| ( | |||||||||
2014 |
|
|
|
|
|
|
|
|
|
|
|
|
|
| ( | ||||||||
2015 |
|
|
|
|
|
|
|
|
|
|
|
|
|
|
| ( | |||||||
2016 |
|
|
|
|
|
|
|
|
|
|
|
|
|
|
|
| |||||||
2017 |
|
|
|
|
|
|
|
|
|
|
|
|
|
|
|
|
| ||||||
2018 |
|
|
|
|
|
|
|
|
|
|
|
|
|
|
|
|
|
| |||||
2019 |
|
|
|
|
|
|
|
|
|
|
|
|
|
|
|
|
|
|
| ||||
2020 |
|
|
|
|
|
|
|
|
|
|
|
|
|
|
|
|
|
|
|
| |||
2021 |
|
|
|
|
|
|
|
|
|
|
|
|
|
|
|
|
|
|
|
|
| ||
Total |
|
|
|
|
|
|
|
|
|
|
|
|
|
|
|
|
|
|
| $ | $ | ( | |
Reserving Process and Methodology
U.S. Excess Casualty policies tend to attach at a high layer above underlying policies, which causes the loss development pattern to be lagged significantly. Many of the claims notified to the excess layers are closed without payment because the claims never reach our layer as a result of high deductibles and other underlying coverages, while the claims that reach our layer can have large case reserves or settlements and be highly variable in terms of reported timing and amount. For a portion of this business, the underlying primary policies are issued by other insurance companies, which can limit our access to relevant information to help inform our judgments as the loss events evolve and mature. Furthermore, this coverage is often significantly impacted by the underwriting cycle and external judicial trends.
Recent accident years reflect a strategy towards having higher attachment points on the portfolio through changing participations in various layers within an insured’s program.
We generally use a combination of loss development methods and expected loss ratio methods for excess casualty product lines. We segment our analysis between automobile-related claims and non-automobile claims, due to the shorter-tail nature of the automobile claims. We then further segment the non-automobile claims for certain latent exposures such as construction defects and mass torts where losses have unique emergence patterns. Mass tort claims in particular may develop over an extended period of time and impact multiple accident years when they emerge. The more standard types of claims are then separately analyzed based on attachment point bands, to recognize that the impact of the level of the attachment point can significantly impact the delay in loss reporting and development. In our analyses, losses capped at $
Expected loss ratio methods are generally used for at least the three latest accident years, due to the relatively low credibility of the reported losses. The loss experience is generally reviewed separately by attachment point. The expected loss ratios used for recent accident years are based on the projected ultimate loss ratios for older years adjusted for rate changes, loss trend including inflation, and where appropriate, changing market conditions. Recent COVID-19 related events have caused disruption in claims frequency and severity as well as reporting patterns. Where appropriate, and identifiable, adjustments have been made to standard projection techniques.
U.S. Other Casualty
U.S Other Casualty includes general liability, commercial auto, medical malpractice, and various other casualty lines of business.
In 2021, we recognized $
In 2020, we recognized $
AIG | 2021 Form 10-K 261
In 2019, we recognized $
Incurred Losses and Allocated Loss Adjustment Expenses, Undiscounted and Net of Reinsurance | |||||||||||||||||||||||||||||||||||
|
|
|
|
|
|
|
|
|
|
|
|
|
|
|
|
|
|
|
|
|
|
|
|
|
|
|
|
|
|
|
|
|
|
|
|
| Years Ended December 31, (in millions) |
|
|
| December 31, 2021 |
|
|
|
|
|
|
|
| ||||||||||||||||||||||
Accident Year |
| 2012 |
| 2013 |
| 2014 |
| 2015 |
| 2016 |
| 2017 |
| 2018 |
| 2019 |
| 2020 |
|
| 2021 |
| 2021 Prior Year Development Excluding the Impact of Adverse Development Reinsurance Agreement |
| Total of IBNR Liabilities Plus Expected Development on Reported Losses |
| Cumulative Number of Reported Claims |
| Incurred Impact of Adverse Development Reinsurance Agreement |
| IBNR Impact of Adverse Development Reinsurance Agreement |
| 2021 (Net of Impact of Adverse Development Reinsurance Agreement) |
| Total of IBNR Liabilities Net of Impact of Adverse Development Reinsurance Agreement |
| Unaudited |
|
|
|
|
|
|
|
|
|
|
|
|
|
|
|
|
| |||||||||||||||||
2012 | $ | $ | $ | $ | $ | $ | $ | $ | $ |
| $ | $ | $ |
| $ | ( | $ | ( | $ | $ | |||||||||||||||
2013 |
|
|
|
|
|
|
|
|
|
|
|
|
| ( |
|
|
| ( |
| ( |
|
| |||||||||||||
2014 |
|
|
|
|
|
|
|
|
|
|
|
|
|
| ( |
|
|
| ( |
| ( |
|
| ||||||||||||
2015 |
|
|
|
|
|
|
|
|
|
|
|
|
|
|
| ( |
|
|
| ( |
| ( |
|
| |||||||||||
2016 |
|
|
|
|
|
|
|
|
|
|
|
|
|
|
|
| ( |
|
|
|
|
|
| ||||||||||||
2017 |
|
|
|
|
|
|
|
|
|
|
|
|
|
|
|
|
| ( |
|
|
|
|
|
| |||||||||||
2018 |
|
|
|
|
|
|
|
|
|
|
|
|
|
|
|
|
|
|
|
|
|
|
|
| |||||||||||
2019 |
|
|
|
|
|
|
|
|
|
|
|
|
|
|
|
|
|
|
| ( |
|
|
|
|
|
| |||||||||
2020 |
|
|
|
|
|
|
|
|
|
|
|
|
|
|
|
|
|
|
|
|
|
|
|
|
|
| |||||||||
2021 |
|
|
|
|
|
|
|
|
|
|
|
|
|
|
|
|
|
|
|
|
|
|
|
|
|
|
|
| |||||||
Total |
|
|
|
|
|
|
|
|
|
|
|
|
|
|
|
|
|
|
| $ | $ |
|
|
|
| $ | ( |
|
| $ |
|
| |||
Cumulative Paid Losses and Allocated Loss Adjustment Expenses, Net of |
|
|
|
|
|
|
|
|
|
|
|
|
|
|
|
|
| ||||||||||||||||||
Reinsurance from the table below |
|
| ( |
|
|
|
|
|
|
|
|
| ( |
|
| ||||||||||||||||||||
Liabilities for losses and loss adjustment expenses and prior year development |
|
|
|
|
|
|
|
|
|
|
|
|
|
|
|
|
| ||||||||||||||||||
before accident year 2012, net of reinsurance |
|
|
| ( |
|
|
|
|
| ( |
|
|
|
|
| ||||||||||||||||||||
Unallocated loss adjustment expense prior year development |
|
|
|
| ( |
|
|
|
|
|
|
|
|
|
|
|
| ||||||||||||||||||
Liabilities for losses and loss adjustment expenses and prior year loss |
|
|
|
|
|
|
|
|
|
|
|
|
|
|
|
|
| ||||||||||||||||||
development, net of reinsurance |
| $ | $ | ( |
|
|
|
| $ | ( |
|
| $ |
|
| ||||||||||||||||||||
Incurred Losses and Loss Adjustment Expenses, Undiscounted, Net of Reinsurance (including impact of ADC) | ||||||||||||||
|
| Calendar Years Ended December 31, (in millions) |
| Prior Year Development | ||||||||||
Accident Year |
| 2016 |
| 2017 |
| 2018 |
| 2019 |
| 2020 |
| 2021 |
| |
|
| Unaudited |
|
|
|
| ||||||||
2012 | $ | $ | $ | $ | $ | $ | $ | ( | ||||||
2013 |
|
|
|
|
|
|
| |||||||
2014 |
|
|
|
|
|
|
| |||||||
2015 |
|
|
|
|
|
|
| |||||||
2016 |
|
|
|
|
|
|
| ( | ||||||
2017 |
|
|
|
|
|
|
|
| ( | |||||
2018 |
|
|
|
|
|
|
|
|
| |||||
2019 |
|
|
|
|
|
|
|
|
|
| ( | |||
2020 |
|
|
|
|
|
|
|
|
|
|
| |||
2021 |
|
|
|
|
|
|
|
|
|
|
|
|
| |
Total | $ | $ | $ | $ | $ | $ | $ | |||||||
Cumulative Paid Losses and Allocated Loss Adjustment Expenses, Net of Reinsurance from the table below |
| ( |
|
| ||||||||||
Liabilities for losses and allocated loss adjustment expenses and prior year development before 2012, net of reinsurance |
|
| ( | |||||||||||
Unallocated loss adjustment expense prior year development |
|
|
| |||||||||||
Liabilities for losses and loss adjustment expenses and prior year loss development, net of reinsurance | $ | $ | ||||||||||||
262 AIG | 2021 Form 10-K
|
| Calendar Years Ended December 31, (in millions) |
| Prior Year Development | ||||||||||
Accident Year |
| 2016 |
| 2017 |
| 2018 |
| 2019 |
| 2020 |
| 2021 |
| |
|
| Unaudited |
|
|
|
| ||||||||
2012 | $ | ( | $ | ( | $ | ( | $ | ( | $ | ( | $ | ( | $ | ( |
2013 |
| ( |
| ( |
| ( |
| ( |
| ( |
| ( |
| |
2014 |
| ( |
| ( |
| ( |
| ( |
| ( |
| ( |
| |
2015 |
| ( |
| ( |
| ( |
| ( |
| ( |
| ( |
| |
2016 |
|
|
|
|
|
|
| |||||||
2017 |
| - |
|
|
|
|
|
| ||||||
2018 |
| - |
| - |
|
|
|
|
| |||||
2019 |
| - |
| - |
| - |
|
|
|
| ||||
2020 |
| - |
| - |
| - |
| - |
|
|
| |||
2021 |
| - |
| - |
| - |
| - |
| - |
|
| ||
Total | $ | ( | $ | ( | $ | ( | $ | ( | $ | ( | $ | ( | $ | |
Cumulative Paid Losses and Allocated Loss Adjustment Expenses, Net of Reinsurance from the table below |
|
|
| |||||||||||
Liabilities for losses and allocated loss adjustment expenses and prior year development before 2012, net of reinsurance |
| ( |
| ( | ||||||||||
Unallocated loss adjustment expense prior year development |
|
|
| |||||||||||
Liabilities for losses and loss adjustment expenses and prior year loss development, net of reinsurance | $ | ( | $ | |||||||||||
Cumulative Paid Losses and Allocated Loss Adjustment Expenses, Net of Reinsurance | |||||||||||||||||||||||
|
|
|
|
|
|
|
|
|
|
|
|
|
|
|
|
|
|
|
|
|
|
|
|
| Years Ended December 31, (in millions) |
|
| ||||||||||||||||||||
Accident Year |
| 2012 |
| 2013 |
| 2014 |
| 2015 |
| 2016 |
| 2017 |
| 2018 |
| 2019 |
| 2020 |
|
| 2021 |
| Paid Impact of Adverse Development Reinsurance Agreement |
| Unaudited |
|
|
|
|
| |||||||||||||||||
2012 | $ | $ | $ | $ | $ | $ | $ | $ | $ |
| $ | $ | ( | ||||||||||
2013 |
|
|
|
|
|
|
|
|
|
|
|
|
| ( | |||||||||
2014 |
|
|
|
|
|
|
|
|
|
|
|
|
|
| ( | ||||||||
2015 |
|
|
|
|
|
|
|
|
|
|
|
|
|
|
| ( | |||||||
2016 |
|
|
|
|
|
|
|
|
|
|
|
|
|
|
|
| |||||||
2017 |
|
|
|
|
|
|
|
|
|
|
|
|
|
|
|
|
| ||||||
2018 |
|
|
|
|
|
|
|
|
|
|
|
|
|
|
|
|
|
| |||||
2019 |
|
|
|
|
|
|
|
|
|
|
|
|
|
|
|
|
|
|
| ||||
2020 |
|
|
|
|
|
|
|
|
|
|
|
|
|
|
|
|
|
|
|
| |||
2021 |
|
|
|
|
|
|
|
|
|
|
|
|
|
|
|
|
|
|
|
|
| ||
Total |
|
|
|
|
|
|
|
|
|
|
|
|
|
|
|
|
|
|
| $ | $ | ( | |
AIG | 2021 Form 10-K 263
Reserving Process and Methodology
U.S. Other Casualty includes general liability, automobile liability, environmental, medical malpractice, and other casualty lines of business. These lines of business are all long-tail in nature and while somewhat diverse in terms of exposures, these lines are often subject to similar trends. These lines are often significantly impacted by the underwriting cycle and external judicial trends. Many of our policies contain risk-sharing features, including high deductibles, self-insured retentions or retrospective rating features, in addition to a traditional insurance component. These risk-sharing programs generally are large and complex, comprising multiple products, years and structures, and are subject to amendment over time.
We generally use a combination of loss development methods, frequency/severity and expected loss ratio methods for primary general liability or products liability product lines. We also supplement the standard actuarial techniques by using evaluations of the ultimate losses on unusual claims or claim accumulations by external specialists on those subsets of claims. The segmentation of the data reflects state differences, industry groups, deductible/non-deductible programs and type of claim.
We segment our analysis by line of business and key coverage structures (claims-made vs. occurrence, large deductible policies, retrospective-rated policies, captives, etc.). Additionally, certain subsets, such as construction defect for general liability, auto liability policies for trucking business, hospital policies for medical malpractice and underground storage tanks for environmental are generally reviewed separately from business in other subsets. We continually refine our loss reserving techniques for the domestic primary casualty product lines and adopt further segmentations based on our analysis of the differing emerging loss patterns for certain subsets of insureds. Due to the long-tail nature of general liability business, and the many subsets that are reviewed individually, there is less credibility given to the reported losses and increased reliance on expected loss ratio methods for recent accident years.
For certain product lines with sufficient loss volume or seasoning, loss development methods may be given significant weight for all but the most recent one or two accident years. For smaller or more volatile subsets of business and excess of a large deductible business, loss development methods may be given limited weight for the five or more recent accident years. Expected loss ratio methods are used for the more recent accident years for these subsets. The loss experience for primary general liability business is generally reviewed at a level that is believed to provide the most appropriate data for reserve analysis. For other subsets, such as environmental, we utilize a combination of claim analysts’ loss projections and actuarial methods to estimate ultimate losses.
Expected loss ratio methods are generally given significant weight only in the most recent accident year, except for excess of large deductible business, in which expected loss ratio methods may receive weight for several of the most recent accident years. In recent years, the impact of the increase in the frequency of severe claims was projected in the accident years where it was most prevalent. The resulting increase in ultimate loss projections and loss ratios for those years impacted subsequent years through loss development factors and prior expected loss ratio assumptions, also incorporating rate changes, loss trend including inflation, and changing market condition impacts. Recent COVID-19 related events have caused disruption in claims frequency and severity as well as reporting patterns. Where appropriate, and identifiable, adjustments have been made to standard projection techniques. Changes in Claims organization management, differing referral and review criteria, and other factors may also be expected to alter loss emergence.
264 AIG | 2021 Form 10-K
Prior Year Development
Primary General Liability
In 2021, we recognized favorable development of $
In 2020, we recognized unfavorable development of $
In 2019, we recognized unfavorable development of $
Primary Commercial Auto Liability
In 2021, we experienced favorable development of approximately $
In 2020, we experienced unfavorable development of approximately $
In 2019, we experienced unfavorable development of approximately $
Medical Malpractice
During 2021, we recognized $
During 2020, we recognized $
During 2019, we recognized $
Other Lines
During 2021, we recognized unfavorable development of $
During 2020, we recognized favorable development of $
During 2019, we recognized favorable development of $
U.S. Financial Lines
During 2021, we recognized $
During 2020, we recognized $
During 2019, we recognized $
The mix of business has been changing in recent years as we write more cyber and mergers and acquisitions business, which generally report claims faster.
AIG | 2021 Form 10-K 265
|
|
|
|
|
|
|
|
|
|
|
|
|
|
|
|
|
|
|
|
|
|
|
|
|
|
|
|
|
|
|
|
|
|
|
|
Incurred Losses and Allocated Loss Adjustment Expenses, Undiscounted and Net of Reinsurance | |||||||||||||||||||||||||||||||||||
|
|
|
|
|
|
|
|
|
|
|
|
|
|
|
|
|
|
|
|
|
|
|
|
|
|
|
|
|
|
|
|
|
|
|
|
| Years Ended December 31, (in millions) |
|
|
| December 31, 2021 |
|
|
|
|
|
|
|
| ||||||||||||||||||||||
Accident Year |
| 2012 |
| 2013 |
| 2014 |
| 2015 |
| 2016 |
| 2017 |
| 2018 |
| 2019 |
| 2020 |
|
| 2021 |
| 2021 Prior Year Development Excluding the Impact of Adverse Development Reinsurance Agreement |
| Total of IBNR Liabilities Plus Expected Development on Reported Losses |
| Cumulative Number of Reported Claims |
| Incurred Impact of Adverse Development Reinsurance Agreement |
| IBNR Impact of Adverse Development Reinsurance Agreement |
| 2021 (Net of Impact of Adverse Development Reinsurance Agreement) |
| Total of IBNR Liabilities Net of Impact of Adverse Development Reinsurance Agreement |
| Unaudited |
|
|
|
|
|
|
|
|
|
|
|
|
|
|
|
|
| |||||||||||||||||
2012 | $ | $ | $ | $ | $ | $ | $ | $ | $ |
| $ | $ | ( | $ |
| $ | ( | $ | ( | $ | $ | ||||||||||||||
2013 |
|
|
|
|
|
|
|
|
|
|
|
|
| ( |
|
|
| ( |
| ( |
|
| |||||||||||||
2014 |
|
|
|
|
|
|
|
|
|
|
|
|
|
|
|
|
| ( |
| ( |
|
| |||||||||||||
2015 |
|
|
|
|
|
|
|
|
|
|
|
|
|
|
|
|
|
| ( |
| ( |
|
| ||||||||||||
2016 |
|
|
|
|
|
|
|
|
|
|
|
|
|
|
|
|
|
|
|
|
|
| |||||||||||||
2017 |
|
|
|
|
|
|
|
|
|
|
|
|
|
|
|
|
|
|
|
|
|
|
| ||||||||||||
2018 |
|
|
|
|
|
|
|
|
|
|
|
|
|
|
|
|
|
|
|
|
|
|
|
| |||||||||||
2019 |
|
|
|
|
|
|
|
|
|
|
|
|
|
|
|
|
|
|
|
|
|
|
|
|
| ||||||||||
2020 |
|
|
|
|
|
|
|
|
|
|
|
|
|
|
|
|
|
|
|
|
|
|
|
|
|
| |||||||||
2021 |
|
|
|
|
|
|
|
|
|
|
|
|
|
|
|
|
|
|
|
|
|
|
|
|
|
|
|
| |||||||
Total |
|
|
|
|
|
|
|
|
|
|
|
|
|
|
|
|
|
|
| $ | $ |
|
|
|
| $ | ( |
|
| $ |
|
| |||
Cumulative Paid Losses and Allocated Loss Adjustment Expenses, Net of |
|
|
|
|
|
|
|
|
|
|
|
|
|
|
|
|
| ||||||||||||||||||
Reinsurance from the table below |
|
| ( |
|
|
|
|
|
|
|
|
| ( |
|
| ||||||||||||||||||||
Liabilities for losses and loss adjustment expenses and prior year development |
|
|
|
|
|
|
|
|
|
|
|
|
|
|
|
|
| ||||||||||||||||||
before accident year 2012, net of reinsurance |
|
|
| ( |
|
|
|
|
| ( |
|
|
| ( |
|
| |||||||||||||||||||
Unallocated loss adjustment expense prior year development |
|
|
|
|
|
|
|
|
|
|
|
|
|
|
|
| |||||||||||||||||||
Liabilities for losses and loss adjustment expenses and prior year loss |
|
|
|
|
|
|
|
|
|
|
|
|
|
|
|
|
| ||||||||||||||||||
development, net of reinsurance |
| $ | $ |
|
|
|
| $ | ( |
|
| $ |
|
| |||||||||||||||||||||
Incurred Losses and Loss Adjustment Expenses, Undiscounted, Net of Reinsurance (including impact of ADC) | ||||||||||||||
|
| Calendar Years Ended December 31, (in millions) |
| Prior Year Development | ||||||||||
Accident Year |
| 2016 |
| 2017 |
| 2018 |
| 2019 |
| 2020 |
| 2021 |
| |
|
| Unaudited |
|
|
|
| ||||||||
2012 | $ | $ | $ | $ | $ | $ | $ | |||||||
2013 |
|
|
|
|
|
|
| |||||||
2014 |
|
|
|
|
|
|
| |||||||
2015 |
|
|
|
|
|
|
| |||||||
2016 |
|
|
|
|
|
|
| |||||||
2017 |
|
|
|
|
|
|
|
| ||||||
2018 |
|
|
|
|
|
|
|
|
| |||||
2019 |
|
|
|
|
|
|
|
|
|
| ||||
2020 |
|
|
|
|
|
|
|
|
|
|
| |||
2021 |
|
|
|
|
|
|
|
|
|
|
|
|
| |
Total | $ | $ | $ | $ | $ | $ | $ | |||||||
Cumulative Paid Losses and Allocated Loss Adjustment Expenses, Net of Reinsurance from the table below |
| ( |
|
| ||||||||||
Liabilities for losses and allocated loss adjustment expenses and prior year development before 2012, net of reinsurance |
| ( |
| ( | ||||||||||
Unallocated loss adjustment expense prior year development |
|
|
| |||||||||||
Liabilities for losses and loss adjustment expenses and prior year loss development, net of reinsurance |
|
| $ | $ | ||||||||||
266 AIG | 2021 Form 10-K
|
| Calendar Years Ended December 31, (in millions) |
| Prior Year Development | ||||||||||
Accident Year |
| 2016 |
| 2017 |
| 2018 |
| 2019 |
| 2020 |
| 2021 |
| |
|
| Unaudited |
|
|
|
| ||||||||
2012 | $ | ( | $ | ( | $ | ( | $ | ( | $ | ( | $ | ( | $ | |
2013 |
| ( |
| ( |
| ( |
| ( |
| ( |
| ( |
| |
2014 |
| ( |
| ( |
| ( |
| ( |
| ( |
| ( |
| ( |
2015 |
| ( |
| ( |
| ( |
| ( |
| ( |
| ( |
| ( |
2016 |
|
|
|
|
|
|
| |||||||
2017 |
| - |
|
|
|
|
|
| ||||||
2018 |
| - |
| - |
|
|
|
|
| |||||
2019 |
| - |
| - |
| - |
|
|
|
| ||||
2020 |
| - |
| - |
| - |
| - |
|
|
| |||
2021 |
| - |
| - |
| - |
| - |
| - |
|
| ||
Total | $ | ( | $ | ( | $ | ( | $ | ( | $ | ( | $ | ( | $ | ( |
Cumulative Paid Losses and Allocated Loss Adjustment Expenses, Net of Reinsurance from the table below |
|
|
| |||||||||||
Liabilities for losses and allocated loss adjustment expenses and prior year development before 2012, net of reinsurance |
| ( |
| ( | ||||||||||
Unallocated loss adjustment expense prior year development |
|
|
| |||||||||||
Liabilities for losses and loss adjustment expenses and prior year loss development, net of reinsurance |
|
| $ | ( | $ | ( | ||||||||
Cumulative Paid Losses and Allocated Loss Adjustment Expenses, Net of Reinsurance | |||||||||||||||||||||||
|
|
|
|
|
|
|
|
|
|
|
|
|
|
|
|
|
|
|
|
|
|
|
|
| Years Ended December 31, (in millions) |
|
| ||||||||||||||||||||
Accident Year |
| 2012 |
| 2013 |
| 2014 |
| 2015 |
| 2016 |
| 2017 |
| 2018 |
| 2019 |
| 2020 |
|
| 2021 |
| Paid Impact of Adverse Development Reinsurance Agreement |
| Unaudited |
|
|
|
|
| |||||||||||||||||
2012 | $ | $ | $ | $ | $ | $ | $ | $ | $ |
| $ | $ | ( | ||||||||||
2013 |
|
|
|
|
|
|
|
|
|
|
|
|
| ( | |||||||||
2014 |
|
|
|
|
|
|
|
|
|
|
|
|
|
| ( | ||||||||
2015 |
|
|
|
|
|
|
|
|
|
|
|
|
|
|
| ( | |||||||
2016 |
|
|
|
|
|
|
|
|
|
|
|
|
|
|
|
| |||||||
2017 |
|
|
|
|
|
|
|
|
|
|
|
|
|
|
|
|
| ||||||
2018 |
|
|
|
|
|
|
|
|
|
|
|
|
|
|
|
|
|
| |||||
2019 |
|
|
|
|
|
|
|
|
|
|
|
|
|
|
|
|
|
|
| ||||
2020 |
|
|
|
|
|
|
|
|
|
|
|
|
|
|
|
|
|
|
|
| |||
2021 |
|
|
|
|
|
|
|
|
|
|
|
|
|
|
|
|
|
|
|
|
| ||
Total |
|
|
|
|
|
|
|
|
|
|
|
|
|
|
|
|
|
|
| $ | $ | ( | |
Reserving Process and Methodology
U.S. Financial Lines business includes D&O, Errors and Omissions (E&O), EPLI policies and various professional liability subsets of business, as well as the fidelity book of business. This includes cyber coverage and mergers and acquisitions coverage, which have been a growing and evolving portion of this portfolio. These product lines are predominantly claims-made in nature, losses are characterized by low frequency and high severity, and results are often significantly impacted by external economic conditions.
Our analysis is segmented by major coverages, such as D&O, E&O, etc. and then further segmented by major industry groups (e.g. corporate accounts, national accounts, financial institutions, private/not-for-profit, etc.). We also separately review primary business from excess business for certain product lines.
AIG | 2021 Form 10-K 267
We use a combination of loss development, expected loss ratio, and frequency/severity methods for D&O, E&O, EPLI, and professional liability. These product lines generally are offered on a claims-made basis and losses are characterized by low frequency and high severity. In general, expected loss ratio methods are given more weight in the more recent accident years and loss development methods are given more weight in more mature accident years. The loss development factors for the different segments differ significantly in some cases, based on specific coverage characteristics and other factors such as industry group, attachment points, and limits offered.
Frequency/severity methods are generally not used in isolation for these product lines as the overall losses are driven by large losses more than by claim frequency. For commercial D&O segments though, we reflect claims dismissal rates in our frequency estimates, particularly for securities class action suits, as claims severity varies directly with claims jurisprudence. Severity trends have varied significantly from accident year to accident year and care is required in analyzing these trends by claim type. In view of the changing severity profile of the book, we use a capped and excess layer approach on many segments to better reflect the potential impact of large claims on the results by accident year.
We generally use loss development methods for fidelity exposures for all but the latest accident year. For mergers and acquisitions exposure, given the unique profile of each transaction, we use claim department estimates of the ultimate value of each reported claim to supplement and inform the standard actuarial approaches and some weight is given to this method in the more recent accident years.
Expected loss ratio methods are also given weight for the more recent accident years. IBNR factor methods are used, when the nature of losses is low frequency/high severity. The IBNR factors, when applied to earned premium, generate the ultimate expected losses (or other exposure measure) yet to be reported. The factors are determined based on prior accident quarters’ loss costs adjusted to reflect current cost levels and the historical emergence of those loss costs. The factors are continually reevaluated to reflect emerging claim experience, rate changes, loss trends including inflation, or other market and underwriting strategy factors that could affect the adequacy of the IBNR factor being employed. Recent COVID-19 related events have caused disruption in claims frequency and severity as well as reporting patterns. Where appropriate, and identifiable, adjustments have been made to standard projection techniques. Also, many subsets of the business have experienced significant re-underwriting efforts and planned turnover which could likely lead to differing emergence patterns over time. Changes in Claims management, differing referral and review criteria, and other factors may also be expected to alter loss emergence.
U.S. Property and Special Risks
During 2021, we recognized $
During 2020, we recognized $
During 2019, we recognized $
268 AIG | 2021 Form 10-K
Incurred Losses and Allocated Loss Adjustment Expenses, Undiscounted and Net of Reinsurance | |||||||||||||||||||||||||||||||||||
|
|
|
|
|
|
|
|
|
|
|
|
|
|
|
|
|
|
|
|
|
|
|
|
|
|
|
|
|
|
|
|
|
|
|
|
| Years Ended December 31, (in millions) |
|
|
| December 31, 2021 |
|
|
|
|
|
|
|
| ||||||||||||||||||||||
Accident Year |
| 2012 |
| 2013 |
| 2014 |
| 2015 |
| 2016 |
| 2017 |
| 2018 |
| 2019 |
| 2020 |
|
| 2021 |
| 2021 Prior Year Development Excluding the Impact of Adverse Development Reinsurance Agreement |
| Total of IBNR Liabilities Plus Expected Development on Reported Losses |
| Cumulative Number of Reported Claims |
| Incurred Impact of Adverse Development Reinsurance Agreement |
| IBNR Impact of Adverse Development Reinsurance Agreement |
| 2021 (Net of Impact of Adverse Development Reinsurance Agreement) |
| Total of IBNR Liabilities Net of Impact of Adverse Development Reinsurance Agreement |
| Unaudited |
|
|
|
|
|
|
|
|
|
|
|
|
|
|
|
|
| |||||||||||||||||
2012 | $ | $ | $ | $ | $ | $ | $ | $ | $ |
| $ | $ | ( | $ |
| $ | ( | $ | ( | $ | $ | ||||||||||||||
2013 |
|
|
|
|
|
|
|
|
|
|
|
|
| ( |
|
|
| ( |
| ( |
|
| |||||||||||||
2014 |
|
|
|
|
|
|
|
|
|
|
|
|
|
| ( |
|
|
| ( |
| ( |
|
| ||||||||||||
2015 |
|
|
|
|
|
|
|
|
|
|
|
|
|
|
|
|
|
| ( |
| ( |
|
| ||||||||||||
2016 |
|
|
|
|
|
|
|
|
|
|
|
|
|
|
|
| ( |
|
|
|
|
|
| ||||||||||||
2017 |
|
|
|
|
|
|
|
|
|
|
|
|
|
|
|
|
|
|
|
|
|
|
| ||||||||||||
2018 |
|
|
|
|
|
|
|
|
|
|
|
|
|
|
|
|
|
|
|
|
|
|
|
| |||||||||||
2019 |
|
|
|
|
|
|
|
|
|
|
|
|
|
|
|
|
|
|
|
|
|
|
|
|
| ||||||||||
2020 |
|
|
|
|
|
|
|
|
|
|
|
|
|
|
|
|
|
|
|
| ( |
|
|
|
|
|
| ||||||||
2021 |
|
|
|
|
|
|
|
|
|
|
|
|
|
|
|
|
|
|
|
|
|
|
|
|
|
|
|
| |||||||
Total |
|
|
|
|
|
|
|
|
|
|
|
|
|
|
|
|
|
|
| $ | $ |
|
|
|
| $ | ( |
|
|
|
|
| |||
Cumulative Paid Losses and Allocated Loss Adjustment Expenses, Net of |
|
|
|
|
|
|
|
|
|
|
|
|
|
|
|
|
| ||||||||||||||||||
Reinsurance from the table below |
|
| ( |
|
|
|
|
|
|
|
|
| ( |
|
| ||||||||||||||||||||
Liabilities for losses and loss adjustment expenses and prior year development |
|
|
|
|
|
|
|
|
|
|
|
|
|
|
|
|
| ||||||||||||||||||
before accident year 2012, net of reinsurance |
|
|
| ( |
|
|
|
|
| ( |
|
|
|
|
| ||||||||||||||||||||
Unallocated loss adjustment expense prior year development |
|
|
|
| ( |
|
|
|
|
|
|
|
|
|
|
|
| ||||||||||||||||||
Liabilities for losses and loss adjustment expenses and prior year loss |
|
|
|
|
|
|
|
|
|
|
|
|
|
|
|
|
| ||||||||||||||||||
development, net of reinsurance |
| $ | $ |
|
|
|
| $ | ( |
|
|
|
|
| |||||||||||||||||||||
Incurred Losses and Loss Adjustment Expenses, Undiscounted, Net of Reinsurance (including impact of ADC) | ||||||||||||||
|
| Calendar Years Ended December 31, (in millions) |
| Prior Year Development | ||||||||||
Accident Year |
| 2016 |
| 2017 |
| 2018 |
| 2019 |
| 2020 |
| 2021 |
| |
|
| Unaudited |
|
|
|
| ||||||||
2012 | $ | $ | $ | $ | $ | $ | $ | ( | ||||||
2013 |
|
|
|
|
|
|
| ( | ||||||
2014 |
|
|
|
|
|
|
| ( | ||||||
2015 |
|
|
|
|
|
|
| |||||||
2016 |
|
|
|
|
|
|
| ( | ||||||
2017 |
|
|
|
|
|
|
|
| ||||||
2018 |
|
|
|
|
|
|
|
|
| |||||
2019 |
|
|
|
|
|
|
|
|
|
| ||||
2020 |
|
|
|
|
|
|
|
|
|
|
| ( | ||
2021 |
|
|
|
|
|
|
|
|
|
|
|
|
| |
Total | $ | $ | $ | $ | $ | $ | $ | |||||||
Cumulative Paid Losses and Allocated Loss Adjustment Expenses, Net of Reinsurance from the table below |
| ( |
|
| ||||||||||
Liabilities for losses and allocated loss adjustment expenses and prior year development before 2012, net of reinsurance |
|
| ||||||||||||
Unallocated loss adjustment expense prior year development |
|
|
| ( | ||||||||||
Liabilities for losses and loss adjustment expenses and prior year loss development, net of reinsurance | $ | $ | ||||||||||||
AIG | 2021 Form 10-K 269
|
| Calendar Years Ended December 31, (in millions) |
| Prior Year Development | ||||||||||
Accident Year |
| 2016 |
| 2017 |
| 2018 |
| 2019 |
| 2020 |
| 2021 |
| |
|
| Unaudited |
|
|
|
| ||||||||
2012 | $ | ( | $ | ( | $ | ( | $ | ( | $ | ( | $ | ( | $ | |
2013 |
| ( |
| ( |
| ( |
| ( |
| ( |
| ( |
| |
2014 |
| ( |
| ( |
| ( |
| ( |
| ( |
| ( |
| |
2015 |
| ( |
| ( |
| ( |
| ( |
| ( |
| ( |
| ( |
2016 |
|
|
|
|
|
|
| |||||||
2017 |
| - |
|
|
|
|
|
| ||||||
2018 |
| - |
| - |
|
|
|
|
| |||||
2019 |
| - |
| - |
| - |
|
|
|
| ||||
2020 |
| - |
| - |
| - |
| - |
|
|
| |||
2021 |
| - |
| - |
| - |
| - |
| - |
|
| ||
Total | $ | ( | $ | ( | $ | ( | $ | ( | $ | ( | $ | ( | $ | |
Cumulative Paid Losses and Allocated Loss Adjustment Expenses, Net of Reinsurance from the table below |
|
|
| |||||||||||
Liabilities for losses and allocated loss adjustment expenses and prior year development before 2012, net of reinsurance |
| ( |
| |||||||||||
Unallocated loss adjustment expense prior year development |
|
|
| |||||||||||
Liabilities for losses and loss adjustment expenses and prior year loss development, net of reinsurance | $ | ( | $ | |||||||||||
Cumulative Paid Losses and Allocated Loss Adjustment Expenses, Net of Reinsurance | |||||||||||||||||||||||
|
|
|
|
|
|
|
|
|
|
|
|
|
|
|
|
|
|
|
|
|
|
|
|
| Years Ended December 31, (in millions) |
|
| ||||||||||||||||||||
Accident Year |
| 2012 |
| 2013 |
| 2014 |
| 2015 |
| 2016 |
| 2017 |
| 2018 |
| 2019 |
| 2020 |
|
| 2021 |
| Paid Impact of Adverse Development Reinsurance Agreement |
| Unaudited |
|
|
|
|
| |||||||||||||||||
2012 | $ | $ | $ | $ | $ | $ | $ | $ | $ |
| $ | $ | ( | ||||||||||
2013 |
|
|
|
|
|
|
|
|
|
|
|
|
| ( | |||||||||
2014 |
|
|
|
|
|
|
|
|
|
|
|
|
|
| ( | ||||||||
2015 |
|
|
|
|
|
|
|
|
|
|
|
|
|
|
| ( | |||||||
2016 |
|
|
|
|
|
|
|
|
|
|
|
|
|
|
|
| |||||||
2017 |
|
|
|
|
|
|
|
|
|
|
|
|
|
|
|
|
| ||||||
2018 |
|
|
|
|
|
|
|
|
|
|
|
|
|
|
|
|
|
| |||||
2019 |
|
|
|
|
|
|
|
|
|
|
|
|
|
|
|
|
|
|
| ||||
2020 |
|
|
|
|
|
|
|
|
|
|
|
|
|
|
|
|
|
|
|
| |||
2021 |
|
|
|
|
|
|
|
|
|
|
|
|
|
|
|
|
|
|
|
|
| ||
Total |
|
|
|
|
|
|
|
|
|
|
|
|
|
|
|
|
|
|
| $ | $ | ( | |
270 AIG | 2021 Form 10-K
Reserving Process and Methodology
U.S. Property products include commercial, industrial and energy-related property insurance products and services that cover exposures to manmade and natural disasters, including business interruption. U.S. Special Risk products include aerospace, environmental, political risk, trade credit, surety and marine insurance, and program business for various small and medium sized enterprises insurance lines. The program segments include both property and casualty exposures. Recent years have seen an increasing proportion of non-admitted coverages which has altered the underlying customer profile to be less severe in the aggregate.
We primarily segment our analysis by line of business. Additionally, we separately review various subsets, including hull, cargo, and liability for marine business, aviation and satellite for aerospace business, and various other specific programs and product lines.
Frequency/severity methods, loss development methods, and IBNR factor methods are used alone or in combination to set reserves for short-tail classes such as U.S. Property.
IBNR factor methods are used when the nature of losses is low frequency/high severity. The IBNR factors, when applied to earned premium, generate the ultimate expected losses (or other exposure measure) yet to be reported. The factors are determined based on prior accident quarters’ loss costs adjusted to reflect current cost levels and the historical emergence of those loss costs. The factors are continually reevaluated to reflect emerging claim experience, rate changes, loss trends including inflation, or other factors that could affect the adequacy of the IBNR factor being employed.
We generally use a combination of loss development methods and expected loss ratio methods for aviation exposures. Aviation claims are not very long-tail in nature; however, they are driven by claim severity. Thus a combination of both development and expected loss ratio methods is used for all but the latest accident year to determine the loss reserves. Frequency/severity methods are not employed due to the high severity nature of the claims and different mix of claims from year to year.
For program business, we use methods which vary by line of business. For property classes, we use methods similar to those noted above. For liability classes, we use methods similar to those described in the casualty sections detailed above.
Expected loss ratio methods are used to determine the loss reserves for the latest accident year. We also use ground-up claim projections provided by our claims staff to assist in developing the appropriate reserve.
U.S. Personal Insurance
During 2021, we recognized $
During 2020, we recognized $
During 2019, we recognized $
AIG | 2021 Form 10-K 271
Incurred Losses and Allocated Loss Adjustment Expenses, Undiscounted and Net of Reinsurance | |||||||||||||||||||||||||||||||||||
|
|
|
|
|
|
|
|
|
|
|
|
|
|
|
|
|
|
|
|
|
|
|
|
|
|
|
|
|
|
|
|
|
|
|
|
| Years Ended December 31, (in millions) |
|
|
| December 31, 2021 |
|
|
|
|
|
|
|
| ||||||||||||||||||||||
Accident Year |
| 2012 |
| 2013 |
| 2014 |
| 2015 |
| 2016 |
| 2017 |
| 2018 |
| 2019 |
| 2020 |
|
| 2021 |
| 2021 Prior Year Development Excluding the Impact of Adverse Development Reinsurance Agreement |
| Total of IBNR Liabilities Plus Expected Development on Reported Losses |
| Cumulative Number of Reported Claims |
| Incurred Impact of Adverse Development Reinsurance Agreement |
| IBNR Impact of Adverse Development Reinsurance Agreement |
| 2021 (Net of Impact of Adverse Development Reinsurance Agreement) |
| Total of IBNR Liabilities Net of Impact of Adverse Development Reinsurance Agreement |
| Unaudited |
|
|
|
|
|
|
|
|
|
|
|
|
|
|
|
|
| |||||||||||||||||
2012 | $ | $ | $ | $ | $ | $ | $ | $ | $ |
| $ | $ | ( | $ |
| $ | ( | $ | $ | $ | |||||||||||||||
2013 |
|
|
|
|
|
|
|
|
|
|
|
|
| ( |
|
|
| ( |
| ( |
|
| |||||||||||||
2014 |
|
|
|
|
|
|
|
|
|
|
|
|
|
| ( |
|
|
| ( |
| ( |
|
| ||||||||||||
2015 |
|
|
|
|
|
|
|
|
|
|
|
|
|
|
|
|
|
| ( |
| ( |
|
| ||||||||||||
2016 |
|
|
|
|
|
|
|
|
|
|
|
|
|
|
|
|
|
|
|
|
|
| |||||||||||||
2017 |
|
|
|
|
|
|
|
|
|
|
|
|
|
|
|
|
| ( |
|
|
|
|
|
| |||||||||||
2018 |
|
|
|
|
|
|
|
|
|
|
|
|
|
|
|
|
|
| ( |
|
|
|
|
|
| ||||||||||
2019 |
|
|
|
|
|
|
|
|
|
|
|
|
|
|
|
|
|
|
| ( |
|
|
|
|
|
| |||||||||
2020 |
|
|
|
|
|
|
|
|
|
|
|
|
|
|
|
|
|
|
|
| ( |
|
|
|
|
|
| ||||||||
2021 |
|
|
|
|
|
|
|
|
|
|
|
|
|
|
|
|
|
|
|
|
|
|
|
|
|
|
|
| |||||||
Total |
|
|
|
|
|
|
|
|
|
|
|
|
|
|
|
|
|
|
| $ | $ | ( |
|
|
|
| $ | ( |
|
|
|
|
| ||
Cumulative Paid Losses and Allocated Loss Adjustment Expenses, Net of |
|
|
|
|
|
|
|
|
|
|
|
|
|
|
|
|
| ||||||||||||||||||
Reinsurance from the table below |
|
| ( |
|
|
|
|
|
|
|
|
| ( |
|
| ||||||||||||||||||||
Liabilities for losses and loss adjustment expenses and prior year development |
|
|
|
|
|
|
|
|
|
|
|
|
|
|
|
|
| ||||||||||||||||||
before accident year 2012, net of reinsurance |
|
| ( |
|
|
|
|
|
| ( |
|
|
| ( |
|
| |||||||||||||||||||
Unallocated loss adjustment expense prior year development |
|
|
|
|
|
|
|
|
|
|
|
|
|
|
|
|
|
| |||||||||||||||||
Liabilities for losses and loss adjustment expenses and prior year loss |
|
|
|
|
|
|
|
|
|
|
|
|
|
|
|
|
| ||||||||||||||||||
development, net of reinsurance |
| $ | $ | ( |
|
|
|
| $ | ( |
|
|
|
|
| ||||||||||||||||||||
Incurred Losses and Loss Adjustment Expenses, Undiscounted, Net of Reinsurance (including impact of ADC) | ||||||||||||||
|
| Calendar Years Ended December 31, (in millions) |
| Prior Year Development | ||||||||||
Accident Year |
| 2016 |
| 2017 |
| 2018 |
| 2019 |
| 2020 |
| 2021 |
| |
|
| Unaudited |
|
|
|
| ||||||||
2012 | $ | $ | $ | $ | $ | $ | $ | ( | ||||||
2013 |
|
|
|
|
|
|
| |||||||
2014 |
|
|
|
|
|
|
| ( | ||||||
2015 |
|
|
|
|
|
|
| |||||||
2016 |
|
|
|
|
|
|
| |||||||
2017 |
|
|
|
|
|
|
|
| ( | |||||
2018 |
|
|
|
|
|
|
|
|
| ( | ||||
2019 |
|
|
|
|
|
|
|
|
|
| ( | |||
2020 |
|
|
|
|
|
|
|
|
|
|
| ( | ||
2021 |
|
|
|
|
|
|
|
|
|
|
|
|
| |
Total | $ | $ | $ | $ | $ | $ | $ | ( | ||||||
Cumulative Paid Losses and Allocated Loss Adjustment Expenses, Net of Reinsurance from the table below |
| ( |
|
| ||||||||||
Liabilities for losses and allocated loss adjustment expenses and prior year development before 2012, net of reinsurance |
| ( |
| |||||||||||
Unallocated loss adjustment expense prior year development |
|
|
| |||||||||||
Liabilities for losses and loss adjustment expenses and prior year loss development, net of reinsurance | $ | $ | ( | |||||||||||
272 AIG | 2021 Form 10-K
|
| Calendar Years Ended December 31, (in millions) |
| Prior Year Development | ||||||||||
Accident Year |
| 2016 |
| 2017 |
| 2018 |
| 2019 |
| 2020 |
| 2021 |
| |
|
| Unaudited |
|
|
|
| ||||||||
2012 | $ | $ | ( | $ | ( | $ | ( | $ | ( | $ | ( | $ | ||
2013 |
| ( |
| ( |
| ( |
| ( |
| ( |
| ( |
| |
2014 |
| ( |
| ( |
| ( |
| ( |
| ( |
| ( |
| ( |
2015 |
| ( |
| ( |
| ( |
| ( |
| ( |
| ( |
| |
2016 |
|
|
|
|
|
|
| |||||||
2017 |
| - |
|
|
|
|
|
| ||||||
2018 |
| - |
| - |
|
|
|
|
| |||||
2019 |
| - |
| - |
| - |
|
|
|
| ||||
2020 |
| - |
| - |
| - |
| - |
|
|
| |||
2021 |
| - |
| - |
| - |
| - |
| - |
|
| ||
Total | $ | ( | $ | ( | $ | ( | $ | ( | $ | ( | $ | ( | $ | |
Cumulative Paid Losses and Allocated Loss Adjustment Expenses, Net of Reinsurance from the table below |
|
|
| |||||||||||
Liabilities for losses and allocated loss adjustment expenses and prior year development before 2012, net of reinsurance |
| ( |
| |||||||||||
Liabilities for losses and loss adjustment expenses and prior year loss development, net of reinsurance | $ | ( | $ | |||||||||||
Cumulative Paid Losses and Allocated Loss Adjustment Expenses, Net of Reinsurance | |||||||||||||||||||||||
|
|
|
|
|
|
|
|
|
|
|
|
|
|
|
|
|
|
|
|
|
|
|
|
| Years Ended December 31, (in millions) |
|
| ||||||||||||||||||||
Accident Year |
| 2012 |
| 2013 |
| 2014 |
| 2015 |
| 2016 |
| 2017 |
| 2018 |
| 2019 |
| 2020 |
|
| 2021 |
| Paid Impact of Adverse Development Reinsurance Agreement |
| Unaudited |
|
|
|
|
| |||||||||||||||||
2012 | $ | $ | $ | $ | $ | $ | $ | $ | $ |
| $ | $ | ( | ||||||||||
2013 |
|
|
|
|
|
|
|
|
|
|
|
|
| ||||||||||
2014 |
|
|
|
|
|
|
|
|
|
|
|
|
|
| ( | ||||||||
2015 |
|
|
|
|
|
|
|
|
|
|
|
|
|
|
| ( | |||||||
2016 |
|
|
|
|
|
|
|
|
|
|
|
|
|
|
|
| |||||||
2017 |
|
|
|
|
|
|
|
|
|
|
|
|
|
|
|
|
| ||||||
2018 |
|
|
|
|
|
|
|
|
|
|
|
|
|
|
|
|
|
| |||||
2019 |
|
|
|
|
|
|
|
|
|
|
|
|
|
|
|
|
|
|
| ||||
2020 |
|
|
|
|
|
|
|
|
|
|
|
|
|
|
|
|
|
|
|
| |||
2021 |
|
|
|
|
|
|
|
|
|
|
|
|
|
|
|
|
|
|
|
|
| ||
Total |
|
|
|
|
|
|
|
|
|
|
|
|
|
|
|
|
|
|
| $ | $ | ( | |
AIG | 2021 Form 10-K 273
Reserving Process and Methodology
U.S. Personal Insurance consists of accident and health and personal lines. Accident and health products include voluntary and sponsor-paid personal accident and supplemental health products for individuals, employees, associations and other organizations as well as a broad range of travel insurance products and services for leisure and business travelers. Personal lines include automobile and homeowners’ insurance, extended warranty, and consumer specialty products, such as identity theft and credit card protection. Personal lines also provides insurance for high net worth individuals offered through AIG Private Client Group, including auto, homeowners, umbrella, yacht, fine art and collections insurance. Personal lines are generally short-tail in nature and can reflect significant salvage and subrogation recoveries.
We primarily segment our analysis by line of business and may separately review various sub-segments, such as specific accident and health products and property damage versus liability for personal lines products.
Frequency/severity methods, loss development methods, and IBNR factor methods are used alone or in combination to set reserves for short-tail product lines such as personal property.
Frequency/severity and loss development methods are utilized for domestic personal auto product lines.
For these classes of business, reliance is placed on frequency/severity methods as claim counts emerge quickly for personal auto. Frequency/severity methods allow for more immediate analysis of resulting loss trends and comparisons to industry and other diagnostic metrics. Recent COVID-19 related events have caused disruption in claims frequency and severity as well as reporting patterns. Where appropriate, and identifiable, adjustments have been made to standard projection techniques.
UK/Europe Casualty and Financial Lines
During 2021, we recognized $
During 2020, we recognized $
During 2019, we recognized $
274 AIG | 2021 Form 10-K
Incurred Losses and Allocated Loss Adjustment Expenses, Undiscounted and Net of Reinsurance* | |||||||||||||||||||||||||||
|
|
|
|
|
|
|
|
|
|
|
|
|
|
|
|
|
|
|
|
|
|
|
|
|
|
|
|
| Years Ended December 31, (in millions) |
|
|
| December 31, 2021 | ||||||||||||||||||||||
Accident Year |
| 2012 |
| 2013 |
| 2014 |
| 2015 |
| 2016 |
| 2017 |
| 2018 |
| 2019 |
| 2020 |
|
| 2021 |
| 2021 Prior Year Development |
| Total of IBNR Liabilities Plus Expected Development on Reported Losses |
| Cumulative Number of Reported Claims |
| Unaudited |
|
|
|
|
|
|
|
|
| |||||||||||||||||
2012 | $ | $ | $ | $ | $ | $ | $ | $ | $ |
| $ | $ | $ |
| |||||||||||||
2013 |
|
|
|
|
|
|
|
|
|
|
|
|
| ( |
|
| |||||||||||
2014 |
|
|
|
|
|
|
|
|
|
|
|
|
|
|
|
| |||||||||||
2015 |
|
|
|
|
|
|
|
|
|
|
|
|
|
|
|
|
| ||||||||||
2016 |
|
|
|
|
|
|
|
|
|
|
|
|
|
|
|
| ( |
|
| ||||||||
2017 |
|
|
|
|
|
|
|
|
|
|
|
|
|
|
|
|
|
|
| ||||||||
2018 |
|
|
|
|
|
|
|
|
|
|
|
|
|
|
|
|
|
|
|
| |||||||
2019 |
|
|
|
|
|
|
|
|
|
|
|
|
|
|
|
|
|
|
|
|
| ||||||
2020 |
|
|
|
|
|
|
|
|
|
|
|
|
|
|
|
|
|
|
|
|
|
| |||||
2021 |
|
|
|
|
|
|
|
|
|
|
|
|
|
|
|
|
|
|
|
|
|
|
|
| |||
Total |
|
|
|
|
|
|
|
|
|
|
|
|
|
|
|
|
|
|
| $ | $ |
|
|
|
| ||
Cumulative Paid Losses and Allocated Loss Adjustment Expenses, Net of |
|
|
|
|
|
|
|
|
| ||||||||||||||||||
Reinsurance from the table below |
|
| ( |
|
|
|
|
| |||||||||||||||||||
Liabilities for losses and loss adjustment expenses and prior year development |
|
|
|
|
|
|
|
|
| ||||||||||||||||||
before accident year 2012, net of reinsurance |
|
|
| ( |
|
|
|
| |||||||||||||||||||
Unallocated loss adjustment expense prior year development |
|
|
|
|
|
|
|
|
|
| |||||||||||||||||
Liabilities for losses and loss adjustment expenses and prior year loss |
|
|
|
|
|
|
|
|
| ||||||||||||||||||
development, net of reinsurance |
| $ | $ |
|
|
|
| ||||||||||||||||||||
|
|
|
|
|
|
|
|
|
|
|
|
|
|
|
|
|
|
|
|
|
|
|
|
|
|
|
|
* The losses reported in the table are not covered by the ADC. | |||||||||||||||||||||||||||
|
|
|
|
|
|
|
|
|
|
|
|
|
|
|
|
|
|
|
|
|
|
Cumulative Paid Losses and Allocated Loss Adjustment Expenses, Net of Reinsurance* | |||||||||||||||||||||
|
|
|
|
|
|
|
|
|
|
|
|
|
|
|
|
|
|
|
|
|
|
| Years Ended December 31, (in millions) | ||||||||||||||||||||
Accident Year |
| 2012 |
| 2013 |
| 2014 |
| 2015 |
| 2016 |
| 2017 |
| 2018 |
| 2019 |
| 2020 |
|
| 2021 |
| Unaudited |
|
|
| |||||||||||||||||
2012 | $ | $ | $ | $ | $ | $ | $ | $ | $ |
| $ | ||||||||||
2013 |
|
|
|
|
|
|
|
|
|
|
|
| |||||||||
2014 |
|
|
|
|
|
|
|
|
|
|
|
|
| ||||||||
2015 |
|
|
|
|
|
|
|
|
|
|
|
|
|
| |||||||
2016 |
|
|
|
|
|
|
|
|
|
|
|
|
|
|
| ||||||
2017 |
|
|
|
|
|
|
|
|
|
|
|
|
|
|
|
| |||||
2018 |
|
|
|
|
|
|
|
|
|
|
|
|
|
|
|
|
| ||||
2019 |
|
|
|
|
|
|
|
|
|
|
|
|
|
|
|
|
|
| |||
2020 |
|
|
|
|
|
|
|
|
|
|
|
|
|
|
|
|
|
|
| ||
2021 |
|
|
|
|
|
|
|
|
|
|
|
|
|
|
|
|
|
|
|
| |
Total |
|
|
|
|
|
|
|
|
|
|
|
|
|
|
|
|
|
|
| $ | |
|
|
|
|
|
|
|
|
|
|
|
|
|
|
|
|
|
|
|
|
|
|
* The losses reported in the table are not covered by the ADC. | |||||||||||||||||||||
AIG | 2021 Form 10-K 275
Reserving Process and Methodology
UK/Europe is our largest non-U.S. region for Liability and Financial Lines. UK/Europe Casualty and Financial Lines is composed of third-party coverages including general liability, auto liability, D&O, professional liability and various other coverages throughout both the UK and Continental Europe. These areas are all long-tail in nature and while somewhat diverse in terms of exposures, these lines are often subject to similar trends. These lines are impacted by the underwriting cycle and external judicial trends. The largest share of business is in the UK, but significant business is also written in other European countries such as Germany, France, and Italy.
We primarily segment our analysis by country and line of business. Additionally, we separately review various product lines, including excess versus primary casualty, commercial versus financial institutions management liability, and other specific programs and subsets of business. We maintain a database of detailed historical premium and loss transactions in original currency for business written outside of the U.S. which allows our actuaries to determine loss reserves without foreign exchange distorting development.
We generally use a combination of loss development methods and expected loss ratio methods. For countries and coverages with sufficient loss volume, loss development methods may be given significant weight for all but the most recent accident years. For smaller countries and more volatile product lines, loss development methods are typically given limited weight for recent accident years. Further, we may rely on larger data subsets in determining the loss development factors and a priori loss ratio assumptions. Expected loss ratios are continually reevaluated to reflect emerging claim experience, rate changes, loss trends including inflation, or other market and underwriting strategy factors that could affect the appropriateness of the methods being employed. Recent COVID-19 related events have caused disruption in claims frequency and severity as well as reporting patterns. Where appropriate, and identifiable, adjustments have been made to standard projection techniques. Also, many subsets of the business have experienced significant re-underwriting efforts and planned turnover which could likely lead to differing emergence patterns over time. Changes in Claims management, differing referral and review criteria, and other factors may also be expected to alter loss emergence.
In general, the loss development for long-tail lines in UK/Europe has been more stable than the development in U.S. long-tail lines, although some underlying drivers have affected the results in a similar manner (e.g. the impact of the financial crisis in accident years 2008 and 2009, COVID-19, etc.).
UK/Europe Property and Special Risks
During 2021, we recognized $
During 2020, we recognized $
276 AIG | 2021 Form 10-K
Incurred Losses and Allocated Loss Adjustment Expenses, Undiscounted and Net of Reinsurance* | |||||||||||||||||||||||||||
|
|
|
|
|
|
|
|
|
|
|
|
|
|
|
|
|
|
|
|
|
|
|
|
|
|
|
|
| Years Ended December 31, (in millions) |
|
|
| December 31, 2021 | ||||||||||||||||||||||
Accident Year |
| 2012 |
| 2013 |
| 2014 |
| 2015 |
| 2016 |
| 2017 |
| 2018 |
| 2019 |
| 2020 |
|
| 2021 |
| 2021 Prior Year Development |
| Total of IBNR Liabilities Plus Expected Development on Reported Losses |
| Cumulative Number of Reported Claims |
| Unaudited |
|
|
|
|
|
|
|
|
| |||||||||||||||||
2012 | $ | $ | $ | $ | $ | $ | $ | $ | $ |
| $ | $ | $ |
| |||||||||||||
2013 |
|
|
|
|
|
|
|
|
|
|
|
|
| ( |
|
| |||||||||||
2014 |
|
|
|
|
|
|
|
|
|
|
|
|
|
| ( |
| ( |
| |||||||||
2015 |
|
|
|
|
|
|
|
|
|
|
|
|
|
|
| ( |
|
| |||||||||
2016 |
|
|
|
|
|
|
|
|
|
|
|
|
|
|
|
| ( |
|
| ||||||||
2017 |
|
|
|
|
|
|
|
|
|
|
|
|
|
|
|
|
| ( |
|
| |||||||
2018 |
|
|
|
|
|
|
|
|
|
|
|
|
|
|
|
|
|
| ( |
|
| ||||||
2019 |
|
|
|
|
|
|
|
|
|
|
|
|
|
|
|
|
|
|
| ( |
|
| |||||
2020 |
|
|
|
|
|
|
|
|
|
|
|
|
|
|
|
|
|
|
|
| ( |
|
| ||||
2021 |
|
|
|
|
|
|
|
|
|
|
|
|
|
|
|
|
|
|
|
|
|
|
|
| |||
Total |
|
|
|
|
|
|
|
|
|
|
|
|
|
|
|
|
|
|
| $ | $ | ( |
|
|
|
| |
Cumulative Paid Losses and Allocated Loss Adjustment Expenses, Net of |
|
|
|
|
|
|
|
|
| ||||||||||||||||||
Reinsurance from the table below |
|
| ( |
|
|
|
|
| |||||||||||||||||||
Liabilities for losses and loss adjustment expenses and prior year development |
|
|
|
|
|
|
|
|
| ||||||||||||||||||
before accident year 2012, net of reinsurance |
|
|
| ( |
|
|
|
| |||||||||||||||||||
Unallocated loss adjustment expense prior year development |
|
|
|
|
|
|
|
| |||||||||||||||||||
Liabilities for losses and loss adjustment expenses and prior year loss |
|
|
|
|
|
|
|
|
| ||||||||||||||||||
development, net of reinsurance |
| $ | $ | ( |
|
|
|
| |||||||||||||||||||
|
|
|
|
|
|
|
|
|
|
|
|
|
|
|
|
|
|
|
|
|
|
|
|
|
|
|
|
* The losses reported in the table are not covered by the ADC. | |||||||||||||||||||||||||||
|
|
|
|
|
|
|
|
|
|
|
|
|
|
|
|
|
|
|
|
|
|
Cumulative Paid Losses and Allocated Loss Adjustment Expenses, Net of Reinsurance* | |||||||||||||||||||||
|
|
|
|
|
|
|
|
|
|
|
|
|
|
|
|
|
|
|
|
|
|
| Years Ended December 31, (in millions) | ||||||||||||||||||||
Accident Year |
| 2012 |
| 2013 |
| 2014 |
| 2015 |
| 2016 |
| 2017 |
| 2018 |
| 2019 |
| 2020 |
|
| 2021 |
| Unaudited |
|
|
| |||||||||||||||||
2012 | $ | $ | $ | $ | $ | $ | $ | $ | $ |
| $ | ||||||||||
2013 |
|
|
|
|
|
|
|
|
|
|
|
| |||||||||
2014 |
|
|
|
|
|
|
|
|
|
|
|
|
| ||||||||
2015 |
|
|
|
|
|
|
|
|
|
|
|
|
|
| |||||||
2016 |
|
|
|
|
|
|
|
|
|
|
|
|
|
|
| ||||||
2017 |
|
|
|
|
|
|
|
|
|
|
|
|
|
|
|
| |||||
2018 |
|
|
|
|
|
|
|
|
|
|
|
|
|
|
|
|
| ||||
2019 |
|
|
|
|
|
|
|
|
|
|
|
|
|
|
|
|
|
| |||
2020 |
|
|
|
|
|
|
|
|
|
|
|
|
|
|
|
|
|
|
| ||
2021 |
|
|
|
|
|
|
|
|
|
|
|
|
|
|
|
|
|
|
|
| |
Total |
|
|
|
|
|
|
|
|
|
|
|
|
|
|
|
|
|
|
| $ | |
|
|
|
|
|
|
|
|
|
|
|
|
|
|
|
|
|
|
|
|
|
|
* The losses reported in the table are not covered by the ADC. | |||||||||||||||||||||
AIG | 2021 Form 10-K 277
Reserving Process and Methodology
UK/Europe Property products include commercial, industrial and energy-related property insurance products and services that cover exposures to manmade and natural disasters, including business interruption. UK/Europe Special Risk products include aerospace, environmental, political risk, trade credit, surety and marine insurance, and various small and medium sized enterprises insurance lines.
We primarily segment our analysis by line of business. Additionally, we separately review various subsets, including hull, cargo, and liability for marine business, aviation and satellite for aerospace business, and various other specific programs and product lines.
Frequency/severity methods, loss development methods, and IBNR factor methods are used alone or in combination to set reserves for short-tail classes such as UK/Europe Property.
IBNR factor methods are used when the nature of losses is low frequency/high severity. The IBNR factors, when applied to earned premium, generate the ultimate expected losses (or other exposure measure) yet to be reported. The factors are determined based on prior accident quarters’ loss costs adjusted to reflect current cost levels and the historical emergence of those loss costs. The factors are continually reevaluated to reflect emerging claim experience, rate changes or other factors that could affect the adequacy of the IBNR factor being employed.
We generally use a combination of loss development methods and expected loss ratio methods for aviation exposures. Aviation claims are not very long-tail in nature; however, they are driven by claim severity. Thus a combination of both development and expected loss ratio methods is used for all but the latest accident year to determine the loss reserves. Frequency/severity methods are not employed due to the high severity nature of the claims and different mix of claims from year to year.
We generally use loss development methods for fidelity exposures for all but the latest accident year. We also use claim department projections of the ultimate value of each reported claim to supplement and inform the standard actuarial approaches and some weight is given to this method in the more recent accident years. The claims staff also provides specific estimates to assist in the setting of reserves for natural catastrophe losses.
Expected loss ratio methods are used to determine the loss reserves for the latest accident year. We also use ground-up claim projections provided by our claims staff to assist in developing the appropriate reserve. The expected loss ratio used for the latest accident year is based on the projected ultimate loss ratios for older years adjusted for rate changes, loss trend including inflation, and where appropriate, changing market conditions. Recent COVID-19 related events have caused disruption in claims frequency and severity as well as reporting patterns. Where appropriate, and identifiable, adjustments have been made to standard projection techniques.
UK/Europe and Japan Personal Insurance
During 2021, we recognized $
During 2020, we recognized $
During 2019, we recognized $
278 AIG | 2021 Form 10-K
Incurred Losses and Allocated Loss Adjustment Expenses, Undiscounted and Net of Reinsurance* | |||||||||||||||||||||||||||
|
|
|
|
|
|
|
|
|
|
|
|
|
|
|
|
|
|
|
|
|
|
|
|
|
|
|
|
| Years Ended December 31, (in millions) |
|
|
| December 31, 2021 | ||||||||||||||||||||||
Accident Year |
| 2012 |
| 2013 |
| 2014 |
| 2015 |
| 2016 |
| 2017 |
| 2018 |
| 2019 |
| 2020 |
|
| 2021 |
| 2021 Prior Year Development |
| Total of IBNR Liabilities Plus Expected Development on Reported Losses |
| Cumulative Number of Reported Claims |
| Unaudited |
|
|
|
|
|
|
|
|
| |||||||||||||||||
2012 | $ | $ | $ | $ | $ | $ | $ | $ | $ |
| $ | $ | ( | $ |
| ||||||||||||
2013 |
|
|
|
|
|
|
|
|
|
|
|
|
| ( |
|
| |||||||||||
2014 |
|
|
|
|
|
|
|
|
|
|
|
|
|
| ( |
|
| ||||||||||
2015 |
|
|
|
|
|
|
|
|
|
|
|
|
|
|
| ( |
|
| |||||||||
2016 |
|
|
|
|
|
|
|
|
|
|
|
|
|
|
|
| ( |
|
| ||||||||
2017 |
|
|
|
|
|
|
|
|
|
|
|
|
|
|
|
|
| ( |
|
| |||||||
2018 |
|
|
|
|
|
|
|
|
|
|
|
|
|
|
|
|
|
|
|
| |||||||
2019 |
|
|
|
|
|
|
|
|
|
|
|
|
|
|
|
|
|
|
| ( |
|
| |||||
2020 |
|
|
|
|
|
|
|
|
|
|
|
|
|
|
|
|
|
|
|
| ( |
|
| ||||
2021 |
|
|
|
|
|
|
|
|
|
|
|
|
|
|
|
|
|
|
|
|
|
|
|
| |||
Total |
|
|
|
|
|
|
|
|
|
|
|
|
|
|
|
|
|
|
| $ | $ | ( |
|
|
|
| |
Cumulative Paid Losses and Allocated Loss Adjustment Expenses, Net of |
|
|
|
|
|
|
|
|
| ||||||||||||||||||
Reinsurance from the table below |
|
| ( |
|
|
|
|
| |||||||||||||||||||
Liabilities for losses and loss adjustment expenses and prior year development |
|
|
|
|
|
|
|
|
| ||||||||||||||||||
before accident year 2012, net of reinsurance |
|
|
| ( |
|
|
|
| |||||||||||||||||||
Unallocated loss adjustment expense prior year development |
|
|
|
|
|
|
|
|
|
| |||||||||||||||||
Liabilities for losses and loss adjustment expenses and prior year loss |
|
|
|
|
|
|
|
|
| ||||||||||||||||||
development, net of reinsurance |
| $ | $ | ( |
|
|
|
| |||||||||||||||||||
|
|
|
|
|
|
|
|
|
|
|
|
|
|
|
|
|
|
|
|
|
|
|
|
|
|
|
|
* The losses reported in the table are not covered by the ADC. | |||||||||||||||||||||||||||
|
|
|
|
|
|
|
|
|
|
|
|
|
|
|
|
|
|
|
|
|
|
Cumulative Paid Losses and Allocated Loss Adjustment Expenses, Net of Reinsurance* | |||||||||||||||||||||
|
|
|
|
|
|
|
|
|
|
|
|
|
|
|
|
|
|
|
|
|
|
| Years Ended December 31, (in millions) | ||||||||||||||||||||
Accident Year |
| 2012 |
| 2013 |
| 2014 |
| 2015 |
| 2016 |
| 2017 |
| 2018 |
| 2019 |
| 2020 |
|
| 2021 |
| Unaudited |
|
|
| |||||||||||||||||
2012 | $ | $ | $ | $ | $ | $ | $ | $ | $ |
| $ | ||||||||||
2013 |
|
|
|
|
|
|
|
|
|
|
|
| |||||||||
2014 |
|
|
|
|
|
|
|
|
|
|
|
|
| ||||||||
2015 |
|
|
|
|
|
|
|
|
|
|
|
|
|
| |||||||
2016 |
|
|
|
|
|
|
|
|
|
|
|
|
|
|
| ||||||
2017 |
|
|
|
|
|
|
|
|
|
|
|
|
|
|
|
| |||||
2018 |
|
|
|
|
|
|
|
|
|
|
|
|
|
|
|
|
| ||||
2019 |
|
|
|
|
|
|
|
|
|
|
|
|
|
|
|
|
|
| |||
2020 |
|
|
|
|
|
|
|
|
|
|
|
|
|
|
|
|
|
|
| ||
2021 |
|
|
|
|
|
|
|
|
|
|
|
|
|
|
|
|
|
|
|
| |
Total |
|
|
|
|
|
|
|
|
|
|
|
|
|
|
|
|
|
|
| $ | |
|
|
|
|
|
|
|
|
|
|
|
|
|
|
|
|
|
|
|
|
|
|
* The losses reported in the table are not covered by the ADC. | |||||||||||||||||||||
AIG | 2021 Form 10-K 279
Reserving Process and Methodology
UK/Europe and Japan Personal Insurance lines consist of accident and health and personal lines. Accident and health products include voluntary and sponsor-paid personal accident and supplemental health products for individuals, employees, associations and other organizations as well as a broad range of travel insurance products and services for leisure and business travelers. Personal lines include automobile and homeowners’ insurance, extended warranty, and consumer specialty products, such as identity theft and credit card protection. Personal lines are generally short-tail in nature.
We primarily segment our analysis by line of business (and by country for UK/Europe and Japan business) and may separately review various sub-segments, such as specific accident and health products and property damage versus liability for other personal lines products.
Frequency/severity methods, loss development methods, and IBNR factor methods are used alone or in combination to set reserves for short-tail product lines such as personal property.
Frequency/severity and loss development methods are utilized for domestic personal auto product lines.
For these classes of business, reliance is placed on frequency/severity methods as claim counts emerge quickly for personal auto. Frequency/severity methods allow for more immediate analysis of resulting loss trends and comparisons to industry and other diagnostic metrics. Recent COVID-19 related events have caused disruption in claims frequency and severity as well as reporting patterns. Where appropriate, and identifiable, adjustments have been made to standard projection techniques.
In general, development for UK/Europe and Japan Personal Insurance classes has been very stable, with only modest changes in the initial selected loss ratios for this business.
Development on earlier Accident Years
The following table summarizes (favorable) unfavorable development, of incurred losses and loss adjustment expenses on accident years beyond the 10 years shown in the previous section’s development triangles by operating segment and major class of business:
Years Ended December 31, |
|
|
|
|
|
|
|
|
|
|
|
(in millions) |
|
|
|
|
|
| 2021 |
| 2020 |
| 2019 |
U.S. Workers' compensation (before discount) |
|
|
|
|
| $ | ( | $ | ( | $ | ( |
U.S. Excess casualty |
|
|
|
|
|
| ( |
| ( |
| |
U.S. Other casualty |
|
|
|
|
|
| ( |
| ( |
| ( |
U.S. Financial Lines |
|
|
|
|
|
| ( |
|
| ||
U.S. Property and Special Risks |
|
|
|
|
|
| ( |
| ( |
| ( |
U.S. Personal Insurance |
|
|
|
|
|
|
|
| |||
UK/Europe Casualty and Financial Lines |
|
|
|
|
|
| ( |
|
| ||
UK/Europe Property and Special Risks |
|
|
|
|
|
| ( |
|
| ( | |
UK/Europe and Japan Personal Insurance |
|
|
|
|
|
| ( |
|
| ||
Other Operations Run-Off |
|
|
|
|
|
| ( |
|
| ( | |
All Other including unallocated loss adjustment expenses |
|
|
|
|
|
|
| ( |
| ||
Total prior year favorable development |
|
|
|
|
| $ | ( | $ | ( | $ | ( |
280 AIG | 2021 Form 10-K
Claims Payout Patterns
The following table presents the historical average annual percentage claims payout on an accident year basis at the same level of disaggregation as presented in the claims development table.
Average Annual Percentage Payout of Incurred Losses by Age, Net of Reinsurance (Unaudited) |
| |||||||||||||||||||
Year | 1 |
| 2 |
| 3 |
| 4 |
| 5 |
| 6 |
| 7 |
| 8 |
| 9 |
| 10 |
|
U.S. Workers' compensation | % | % | % | % | % | % | % | % | % | % | ||||||||||
U.S. Excess casualty |
|
|
|
|
|
|
|
| ( |
|
| |||||||||
U.S. Other casualty |
|
|
|
|
|
|
|
|
|
| ||||||||||
U.S. Financial Lines |
|
|
|
|
|
|
|
|
|
| ||||||||||
U.S. Property and Special Risks |
|
|
|
|
|
|
|
|
|
| ||||||||||
U.S. Personal Insurance |
|
|
| ( |
|
|
|
|
|
|
| |||||||||
UK/Europe Casualty and Financial Lines |
|
|
|
|
|
|
|
|
|
| ||||||||||
UK/Europe Property and Special Risks |
|
|
|
|
|
|
|
|
|
| ||||||||||
UK/Europe and Japan Personal Insurance |
|
|
|
|
|
|
|
|
|
| ||||||||||
Discounting of Loss Reserves
At December 31, 2021 and 2020, the loss reserves reflect a net loss reserve discount of $
The non-tabular workers’ compensation discount is calculated separately for companies domiciled in New York, Pennsylvania and Delaware, and follows the statutory regulations (prescribed or permitted) for each state.
For New York companies, the discount is based on a
The Pennsylvania and Delaware regulators approved use of a consistent discount rate (U.S. Treasury rate plus a liquidity premium) to all of our workers’ compensation reserves in our Pennsylvania domiciled and Delaware domiciled companies, as well as our use of updated payout patterns specific to our primary and excess workers compensation portfolios. In 2020, the regulators also approved that the discount rate will be updated on an annual basis.
The tabular workers’ compensation discount is calculated based on the mortality rate used in the 2007 U.S. Life table and interest rates prescribed or permitted by each state (i.e. New York is based on
The discount for asbestos reserves has been fully accreted.
At December 31, 2021 and 2020, the discount consists of $
The following table presents the components of the loss reserve discount discussed above:
| December 31, 2021 |
| December 31, 2020 | ||||||||||
| North America |
| Other |
|
|
| North America |
| Other |
|
| ||
| Commercial |
| Operations |
|
|
| Commercial |
| Operations |
|
| ||
(in millions) | Insurance |
| Run-Off(b) |
| Total |
| Insurance |
| Run-Off(b) |
| Total | ||
U.S. workers' compensation | $ | $ | $ |
| $ | $ | $ | ||||||
Retroactive reinsurance |
| ( |
|
| ( |
|
| ( |
|
| ( | ||
Total reserve discount(a) | $ | $ | $ |
| $ | $ | $ | ||||||
(a)Excludes $
(b)Excludes $
AIG | 2021 Form 10-K 281
The following table presents the net loss reserve discount benefit (charge):
Years Ended December 31, | 2021 |
| 2020 |
| 2019 | |||||||||||||||
| North |
|
|
|
|
| North |
|
|
|
|
| North |
|
|
|
| |||
| America |
| Other |
|
|
| America |
| Other |
|
|
| America |
| Other |
|
| |||
| Commercial | Operations |
|
|
| Commercial | Operations |
|
|
| Commercial | Operations |
|
| ||||||
(in millions) | Insurance | Run-Off(b) |
| Total |
| Insurance | Run-Off |
| Total |
| Insurance | Run-Off |
| Total | ||||||
Current accident year | $ | $ | $ |
| $ | $ | $ |
| $ | $ | $ | |||||||||
Accretion and other adjustments |
|
|
|
|
|
|
|
|
|
|
|
|
|
|
|
|
|
|
|
|
to prior year discount |
| ( |
|
| ( |
|
| ( |
| ( |
| ( |
|
| ( |
| ( |
| ( | |
Effect of interest rate changes |
|
|
|
|
| ( |
|
| ( |
|
| ( |
| ( |
| ( | ||||
Net reserve discount |
|
|
|
|
|
|
|
|
|
|
|
|
|
|
|
|
|
|
|
|
benefit (charge) |
|
|
|
|
| ( |
| ( |
| ( |
|
| ( |
| ( |
| ( | |||
Change in discount on loss |
|
|
|
|
|
|
|
|
|
|
|
|
|
|
|
|
|
|
|
|
reserves ceded under |
|
|
|
|
|
|
|
|
|
|
|
|
|
|
|
|
|
|
|
|
retroactive reinsurance |
| ( |
|
| ( |
|
|
|
|
|
|
|
| |||||||
Net change in total |
|
|
|
|
|
|
|
|
|
|
|
|
|
|
|
|
|
|
|
|
reserve discount(a) | $ | $ | $ |
| $ | ( | $ | ( | $ | ( |
| $ | ( | $ | ( | $ | ( | |||
(a)
Excludes $(
(b)
On June 2, 2020, we completed the Majority Interest Fortitude Sale. For additional information see Note 1. Change in discount prior to the sale is included in the above at December 31, 2020. Following the sale,
During 2021, effective interest rates increased due to an increase in the forward yield curve component of the discount rates reflecting an increase in U.S. Treasury rates along with changes in payout pattern assumptions. This resulted in an increase in the loss reserve discount by $
During 2020 and 2019, effective interest rates declined due to a decrease in the forward yield curve component of the discount rates reflecting a decline in U.S. Treasury rates along with changes in payout pattern assumptions. This resulted in a decrease in the loss reserve discount by $
Amortization of Deferred Gain on Retroactive Reinsurance
Amortization of the deferred gain on retroactive reinsurance includes $
Amounts recognized reflect the amortization of the initial deferred gain at inception, as amended for subsequent changes in the deferred gain due to changes in subject reserves.
282 AIG | 2021 Form 10-K
Future Policy Benefits
Future policy benefits primarily include reserves for traditional life and annuity payout contracts, which represent an estimate of the present value of future benefits less the present value of future net premiums. Included in Future policy benefits are liabilities for annuities issued in structured settlement arrangements whereby a claimant has agreed to settle a general insurance claim in exchange for fixed payments over a fixed determinable period of time with a life contingency feature. In addition, reserves for contracts in loss recognition are adjusted to reflect the effect of unrealized gains on fixed maturity securities available for sale.
Future policy benefits also include certain guaranteed benefits of variable annuity products that are not considered embedded derivatives, primarily guaranteed minimum death benefits.
For universal life policies with secondary guarantees, we recognize certain liabilities in addition to policyholder account balances. For universal life policies with secondary guarantees, as well as other universal life policies for which profits followed by losses are expected at contract inception, a liability is recognized based on a benefit ratio of (a) the present value of total expected payments, in excess of the account value, over the life of the contract, divided by (b) the present value of total expected assessments over the life of the contract. For universal life policies without secondary guarantees, for which profits followed by losses are first expected after contract inception, we establish a liability, in addition to policyholder account balances, so that expected future losses are recognized in proportion to the emergence of profits in the earlier (profitable) years. Universal life account balances as well as these additional liabilities related to universal life products are reported within Future Policy Benefits in the Consolidated Balance Sheet. These additional liabilities are also adjusted to reflect the effect of unrealized gains or losses on fixed maturity securities available for sale and prior to 2018, equity securities at fair value on accumulated assessments, with related changes recognized through Other comprehensive income. The policyholder behavior assumptions for these liabilities include mortality, lapses and premium persistency. The capital market assumptions used for the liability for universal life secondary guarantees include discount rates and net earned rates.
For additional information on guaranteed minimum death benefits see Note 13.
The following table presents universal life policies with secondary guarantees and similar features (excluding base policy liabilities and embedded derivatives):
| Years Ended December 31, | |||||
(in millions) |
| 2021 |
| 2020(b) |
| 2019(b) |
Balance, beginning of year | $ | $ | $ | |||
Incurred guaranteed benefits(a) |
|
|
| |||
Paid guaranteed benefits |
| ( |
| ( |
| ( |
Changes related to unrealized appreciation (depreciation) of investments |
| ( |
|
| ||
Balance, end of year | $ | $ | $ | |||
(a) Incurred guaranteed benefits include the portion of assessments established as additions to reserves as well as changes in estimates (assumption unlockings) affecting these reserves.
(b) Prior periods have been updated to include impacts of the changes related to unrealized appreciation (depreciation) of investments.
The following table presents details concerning our Universal life policies with secondary guarantees and similar features:
At December 31, |
|
|
|
|
(dollars in millions) |
| 2021 |
| 2020 |
Account value | $ | $ | ||
Net amount at risk |
|
| ||
Average attained age of contract holders |
|
|
AIG | 2021 Form 10-K 283
Policyholder Contract Deposits
The liability for Policyholder contract deposits is primarily recorded at accumulated value (deposits received and net transfers from separate accounts, plus accrued interest credited at rates ranging from
In addition to liabilities for universal life, fixed annuities, fixed options within variable annuities, annuities without life contingencies, funding agreements and GICs, policyholder contract deposits also include our liability for (i) certain guaranteed benefits and indexed features accounted for as embedded derivatives at fair value, (ii) annuities issued in a structured settlement arrangement with no life contingency and (iii) certain contracts we have elected to account for at fair value.
For additional information on guaranteed benefits accounted for as embedded derivatives see Note 13.
Under a funding agreement-backed notes issuance program, an unaffiliated, non-consolidated statutory trust issues medium-term notes to investors, which are secured by GICs issued to the trust by one of our Life and Retirement companies through our Institutional Markets business.
The following table presents Policyholder contract deposits:
At December 31, |
|
|
|
|
(in millions) |
| 2021 |
| 2020* |
Policyholder contract deposits: |
|
|
|
|
Individual Retirement | $ | $ | ||
Group Retirement |
|
| ||
Life Insurance |
|
| ||
Institutional Markets |
|
| ||
Fortitude Re |
|
| ||
Total Policyholder contract deposits | $ | $ |
* Liabilities for certain universal life products were reclassified from Policyholder contract deposits to Future policy benefits for life and accident and health insurance contracts. For additional information, see Note 1.
Other Policyholder Funds
Other policyholder funds include unearned revenue reserves (URR). URR consist of front-end loads on investment-oriented contracts, representing those policy loads that are non-level and typically higher in initial policy years than in later policy years. URR for investment-oriented contracts are generally deferred and amortized, with interest, in relation to the incidence of estimated gross profits (EGPs) to be realized over the estimated lives of the contracts and are subject to the same adjustments due to changes in the assumptions underlying EGPs as DAC. Amortization of URR is recorded in Policy fees. Similar to unrealized appreciation (depreciation) of investments for DAC, URR related to investment-oriented products is also adjusted to reflect the effect of unrealized gains or losses on fixed maturity securities available for sale with related changes recognized through Other comprehensive income.
Other policyholder funds also include provisions for future dividends to participating policyholders, accrued in accordance with all applicable regulatory or contractual provisions. Participating life business represented approximately
Certain products are subject to experience adjustments. These include group life and group medical products, credit life contracts, accident and health insurance contracts/riders attached to life policies and, to a limited extent, reinsurance agreements with other direct insurers. Ultimate premiums from these contracts are estimated and recognized as revenue with the unearned portions of the premiums recorded as liabilities in Other policyholder funds. Experience adjustments vary according to the type of contract and the territory in which the policy is in force and are subject to local regulatory guidance.
284 AIG | 2021 Form 10-K
ITEM 8 | Notes to Consolidated Financial Statements | 13. Variable Life and Annuity Contracts
13. Variable Life and Annuity Contracts
We report variable contracts within the separate accounts when investment income and investment gains and losses accrue directly to, and investment risk is borne by, the contract holder and the separate account meets additional accounting criteria to qualify for separate account treatment. The assets supporting the variable portion of variable annuity and variable universal life contracts that qualify for separate account treatment are carried at fair value and reported as Separate account assets, with an equivalent summary total reported as Separate account liabilities.
Policy values for variable products and investment contracts are expressed in terms of investment units. Each unit is linked to an asset portfolio. The value of a unit increases or decreases based on the value of the linked asset portfolio. The current liability at any time is the sum of the current unit value of all investment units in the separate accounts, plus any liabilities for guaranteed minimum death benefits (GMDB) or guaranteed minimum withdrawal benefits (GMWB) included in Future policy benefits or Policyholder contract deposits, respectively.
Amounts assessed against the contract holders for mortality, administrative and other services are included in revenue. Net investment income, net investment gains and losses, changes in fair value of assets, and policyholder account deposits and withdrawals related to separate accounts are excluded from the Consolidated Statements of Income (Loss), Comprehensive Income (Loss) and Cash Flows.
Variable annuity contracts may include certain contractually guaranteed benefits to the contract holder. These guaranteed features include GMDB that are payable in the event of death, and living benefits that are payable in the event of annuitization, or, in other instances, at specified dates during the accumulation period. Living benefits primarily include GMWB. A variable annuity contract may include more than one type of guaranteed benefit feature; for example, it may have both a GMDB and a GMWB. However, a policyholder can only receive payout from one guaranteed feature on a contract containing a death benefit and a living benefit, i.e. the features are mutually exclusive (except a surviving spouse who has a rider to potentially collect both a GMDB upon their spouse’s death and a GMWB during their lifetime). A policyholder cannot purchase more than one living benefit on one contract. The net amount at risk for each feature is calculated irrespective of the existence of other features; as a result, the net amount at risk for each feature is not additive to that of other features.
Account balances of variable annuity contracts with guarantees were invested in separate account investment options as follows:
At December 31, |
|
|
|
|
(in millions) |
| 2021 |
| 2020* |
Equity funds | $ | $ | ||
Bond funds |
|
| ||
Balanced funds |
|
| ||
Money market funds |
|
| ||
Total | $ | $ |
*
Total variable annuity contracts with guarantees on December 31, 2020 was revised from $
GMDB
Depending on the contract, the GMDB feature may provide a death benefit of either (a) total deposits made to the contract less any partial withdrawals plus a minimum return (and in rare instances, no minimum return) or (b) the highest contract value attained, typically on any anniversary date minus any subsequent withdrawals following the contract anniversary. GMDB is our most widely offered benefit.
The liability for GMDB, which is recorded in Future policy benefits, represents the expected value of benefits in excess of the projected account value, with the excess recognized ratably over the accumulation period based on total expected assessments, through Policyholder benefits and losses incurred. The net amount at risk for GMDB represents the amount of benefits in excess of account value if death claims were filed on all contracts on the balance sheet date.
AIG | 2021 Form 10-K 285
ITEM 8 | Notes to Consolidated Financial Statements | 13. Variable Life and Annuity Contracts
The following table presents details concerning our GMDB exposures, by benefit type:
At December 31, | 2021 |
| 2020 | ||||||
|
| Net Deposits |
|
|
|
| Net Deposits |
|
|
|
| Plus a Minimum |
| Highest Contract |
|
| Plus a Minimum |
| Highest Contract |
(dollars in millions) |
| Return |
| Value Attained |
|
| Return |
| Value Attained |
Account value | $ | $ |
| $ | $ | ||||
Net amount at risk |
|
|
|
|
| ||||
Average attained age of contract holders by product |
|
|
|
|
| ||||
Range of guaranteed minimum return rates |
|
|
|
|
|
|
| ||
Years Ended December 31, |
|
|
|
|
|
|
(in millions) |
| 2021 |
| 2020 |
| 2019 |
Balance, beginning of year | $ | $ | $ | |||
Reserve increase (decrease) |
|
|
| |||
Benefits paid |
| ( |
| ( |
| ( |
Changes in reserves related to unrealized appreciation (depreciation) of investments |
| ( |
|
| ||
Balance, end of year | $ | $ | $ |
Assumptions used to determine the GMDB liability include interest rates, which vary by year of issuance and products; mortality rates, which are based upon actual experience modified to allow for variations in policy form; lapse rates, which are based upon actual experience modified to allow for variations in policy form; investment returns, based on stochastically generated scenarios; and asset growth assumptions, which include a reversion to the mean methodology, similar to that applied for DAC. We regularly evaluate estimates used to determine the GMDB liability and adjust the additional liability balance, with a related charge or credit to Policyholder benefits and losses incurred, if actual experience or other evidence suggests that earlier assumptions should be revised.
GMWB
Certain of our variable annuity contracts contain optional GMWB benefits and, to a lesser extent, guaranteed minimum accumulation benefits, which are not currently offered. With a GMWB, the contract holder can monetize the excess of the guaranteed amount over the account value of the contract only through a series of withdrawals that do not exceed a specific percentage per year of the guaranteed amount. If, after the series of withdrawals, the account value is exhausted, the contract holder will receive a series of annuity payments equal to the remaining guaranteed amount, and, for lifetime GMWB products, the annuity payments continue as long as the covered person(s) is living.
The liabilities for GMWB, which are recorded in Policyholder contract deposits, are accounted for as embedded derivatives measured at fair value, with changes in the fair value of the liabilities recorded in Net realized gains (losses). The fair value of these embedded derivatives was a net liability of $
For information regarding the fair value measurement of guaranteed benefits that are accounted for as embedded derivatives see Note 4.
We had account values subject to GMWB that totaled $
286 AIG | 2021 Form 10-K
14. Debt
The following table lists our total debt outstanding at December 31, 2021 and 2020. The interest rates presented in the following table are the range of contractual rates in effect at December 31, 2021, including fixed and variable-rates:
|
|
|
| Balance at |
| Balance at | ||
At December 31, 2021 | Range of | Maturity | December 31, |
| December 31, | |||
(in millions) | Interest Rate(s) | Date(s) |
| 2021 |
|
| 2020 | |
Debt issued or guaranteed by AIG: |
|
|
|
|
|
|
|
|
AIG general borrowings: |
|
|
|
|
|
|
|
|
Notes and bonds payable |
| $ |
| $ | ||||
Junior subordinated debt |
|
|
|
| ||||
AIG Japan Holdings Kabushiki Kaisha |
|
|
|
| ||||
AIGLH notes and bonds payable |
|
|
|
| ||||
AIGLH junior subordinated debt |
|
|
|
| ||||
Validus notes and bonds payable |
|
|
|
| ||||
Total AIG general borrowings |
|
|
|
|
|
| ||
AIG borrowings supported by assets:(a) |
|
|
|
|
|
|
|
|
Series AIGFP matched notes and bonds payable |
|
|
|
| ||||
GIAs, at fair value |
|
|
|
| ||||
Notes and bonds payable, at fair value |
|
|
|
| ||||
Total AIG borrowings supported by assets |
|
|
|
|
|
| ||
Total debt issued or guaranteed by AIG |
|
|
|
|
|
| ||
Other subsidiaries notes, bonds, loans and mortgages |
|
|
|
|
|
|
|
|
payable - not guaranteed by AIG |
|
|
|
| ||||
Total long-term debt |
|
|
|
|
|
| ||
Debt of consolidated investment entities - not guaranteed by AIG(b) |
|
|
|
| ||||
Total debt |
|
|
| $ |
| $ | ||
AIG | 2021 Form 10-K 287
The following table presents maturities of long-term debt (including unamortized original issue discount, hedge accounting valuation adjustments and fair value adjustments, when applicable):
December 31, 2021 |
|
|
| Year Ending | |||||||||||
(in millions) |
|
| Total |
| 2022 |
| 2023 |
| 2024 |
| 2025 |
| 2026 |
| Thereafter |
Debt issued or guaranteed by AIG: |
|
|
|
|
|
|
|
|
|
|
|
|
|
|
|
AIG general borrowings: |
|
|
|
|
|
|
|
|
|
|
|
|
|
|
|
Notes and bonds payable |
| $ | $ | $ | $ | $ | $ | $ | |||||||
Junior subordinated debt |
|
|
|
|
|
|
|
| |||||||
AIG Japan Holdings Kabushiki Kaisha |
|
|
|
|
|
|
|
| |||||||
AIGLH notes and bonds payable |
|
|
|
|
|
|
|
| |||||||
AIGLH junior subordinated debt |
|
|
|
|
|
|
|
| |||||||
Validus notes and bonds payable |
|
|
|
|
|
|
|
| |||||||
Total AIG general borrowings |
|
|
|
|
|
|
|
| |||||||
AIG borrowings supported by assets: |
|
|
|
|
|
|
|
|
|
|
|
|
|
|
|
Series AIGFP matched notes and |
|
|
|
|
|
|
|
|
|
|
|
|
|
|
|
bonds payable |
|
|
|
|
|
|
|
| |||||||
GIAs, at fair value |
|
|
|
|
|
|
|
| |||||||
Notes and bonds payable, at fair value |
|
|
|
|
|
|
|
| |||||||
Total AIG borrowings supported by assets |
|
|
|
|
|
|
| ||||||||
Total debt issued or guaranteed by AIG |
|
|
|
|
|
|
|
| |||||||
Debt not guaranteed by AIG: |
|
|
|
|
|
|
|
|
|
|
|
|
|
|
|
Other subsidiaries notes, bonds, loans |
|
|
|
|
|
|
|
|
|
|
|
|
|
|
|
and mortgages payable |
|
|
|
|
|
|
|
| |||||||
Total debt not guaranteed by AIG |
|
|
|
|
|
|
|
| |||||||
Total* |
| $ | $ | $ | $ | $ | $ | $ | |||||||
Uncollateralized and collateralized notes, bonds, loans and mortgages payable consisted of the following:
|
| Uncollateralized |
| Collateralized |
|
|
At December 31, 2021 |
| Notes/Bonds/Loans |
| Loans and |
|
|
(in millions) |
| Payable |
| Mortgages Payable |
| Total |
AIG general borrowings | $ | $ | $ | |||
Other subsidiaries notes, bonds, loans and mortgages payable* |
|
|
| |||
Total | $ | $ | $ |
AIGLH Junior Subordinated Debentures
In connection with our acquisition of AIG Life Holdings, Inc. (AIGLH) in 2001, we entered into arrangements with AIGLH with respect to outstanding AIGLH capital securities. In 1996, AIGLH issued capital securities through a trust to institutional investors and funded the trust with AIGLH junior subordinated debentures issued to the trust with the same terms as the capital securities.
On July 11, 2013, the AIGLH junior subordinated debentures were distributed to holders of the capital securities, the capital securities were cancelled and the trusts were dissolved. At December 31, 2021, the junior subordinated debentures outstanding consisted of $
288 AIG | 2021 Form 10-K
DEBT CASH TENDER OFFERS AND REDEMPTIONS
In 2021, we repurchased, through cash tender offers, and redeemed $
redeemed $
repurchased, through cash tender offers, $
redeemed $
Credit Facilities
On November 19, 2021, we entered into a credit agreement, which provides for a committed, revolving syndicated credit facility (the Facility) as a potential source of liquidity for general corporate purposes. The Facility provides for aggregate commitments by the bank syndicate to provide unsecured revolving loans and/or standby letters of credit of up to $
In connection with our entry into the aforementioned credit agreement, we terminated our prior $
At December 31, 2021 |
|
|
|
| Available |
| Effective |
(in millions) |
| Size |
|
| Amount | Expiration | Date |
Syndicated Credit Facility | $ |
| $ |
15. Contingencies, Commitments and Guarantees
In the normal course of business, various contingent liabilities and commitments are entered into by AIG and our subsidiaries. In addition, AIG Parent guarantees various obligations of certain subsidiaries.
Although AIG cannot currently quantify its ultimate liability for unresolved litigation and investigation matters, including those referred to below, it is possible that such liability could have a material adverse effect on AIG’s consolidated financial condition or its consolidated results of operations or consolidated cash flows for an individual reporting period.
Legal Contingencies
Overview
In the normal course of business, AIG and our subsidiaries are subject to regulatory and government investigations and actions, and litigation and other forms of dispute resolution in a large number of proceedings pending in various domestic and foreign jurisdictions. Certain of these matters involve potentially significant risk of loss due to potential for significant jury awards and settlements, punitive damages or other penalties. Many of these matters are also highly complex and may seek recovery on behalf of a class or similarly large number of plaintiffs. It is therefore inherently difficult to predict the size or scope of potential future losses arising from these matters. In our insurance and reinsurance operations, litigation and arbitration concerning the scope of coverage under insurance and reinsurance contracts, and litigation and arbitration in which our subsidiaries defend or indemnify their insureds under insurance contracts, are generally considered in the establishment of our loss reserves. Separate and apart from the foregoing matters involving insurance and reinsurance coverage, AIG, our subsidiaries and their respective officers and directors are subject to a variety of additional types of legal proceedings brought by holders of AIG securities, customers, employees and others, alleging, among other things, breach of contractual or fiduciary duties, bad faith, indemnification and violations of federal and state statutes and regulations.
AIG | 2021 Form 10-K 289
ITEM 8 | Notes to Consolidated Financial Statements | 15. Contingencies, Commitments and Guarantees
With respect to these other categories of matters not arising out of claims for insurance or reinsurance coverage, we establish reserves for loss contingencies when it is probable that a loss will be incurred and the amount of the loss can be reasonably estimated. In many instances, we are unable to determine whether a loss is probable or to reasonably estimate the amount of such a loss and, therefore, the potential future losses arising from legal proceedings may exceed the amount of liabilities that we have recorded in our financial statements covering these matters. While such potential future charges could be material, based on information currently known to management, management does not believe, other than as may be discussed below, that any such charges are likely to have a material adverse effect on our financial position or results of operation.
Additionally, from time to time, various regulatory and governmental agencies review the transactions and practices of AIG and our subsidiaries in connection with industry-wide and other inquiries or examinations into, among other matters, the business practices of current and former operating insurance subsidiaries. Such investigations, inquiries or examinations could develop into administrative, civil or criminal proceedings or enforcement actions, in which remedies could include fines, penalties, restitution or alterations in our business practices, and could result in additional expenses, limitations on certain business activities and reputational damage.
Moriarty Litigation
Effective January 1, 2013, the California legislature enacted AB 1747 (the Act), which amended the Insurance Code to mandate that life insurance policies issued and delivered in California contain a 60-day grace period during which time the policies must remain in force after a premium payment is missed, and that life insurers provide both a 30-day minimum notification of lapse and the right of policy owners to designate a secondary recipient for lapse and termination notices. Following guidance from the California Department of Insurance and certain industry trade groups, American General Life Insurance Company (AGL) interpreted the Act to be prospective in nature, applying only to policies issued and delivered on or after the Act’s January 1, 2013, effective date. On July 18, 2017, AGL was sued in a putative class action captioned Moriarty v. American General Life Insurance Company, No. 17-cv-1709 (S.D. Cal.), challenging AGL’s prospective application of the Act. Plaintiff’s complaint, which is similar to complaints filed against other insurers, argues that policies issued and delivered prior to January 1, 2013, like the $
lease Commitments
We lease office space and equipment in various locations across jurisdictions in which the Company operates. The majority of the resulting obligation arising from these contracts is generated by our real estate portfolio, which only includes contracts classified as operating leases. The and corresponding reflected in and were $
The weighted average discount rate and lease term assumptions used in determining the liability are
Rent expense was $
290 AIG | 2021 Form 10-K
ITEM 8 | Notes to Consolidated Financial Statements | 15. Contingencies, Commitments and Guarantees
The following table presents the future undiscounted cash flows under operating leases at December 31, 2021:
(in millions) |
| |
2022 | $ | |
2023 |
| |
2024 |
| |
2025 |
| |
2026 |
| |
Remaining years after 2026 |
| |
Total undiscounted lease payments | $ | |
Less: Present value adjustment |
| |
Net lease liabilities |
| |
During 2019, we recognized a pretax net gain of $
Other Commitments
In the normal course of business, we enter into commitments to invest in limited partnerships, private equity funds and hedge funds and to purchase and develop real estate in the U.S. and abroad. These commitments totaled $
Guarantees
Subsidiaries
We have issued unconditional guarantees with respect to the prompt payment, when due, of all present and future payment obligations and liabilities of AIG Financial Products Corp. and related subsidiaries (collectively AIGFP) and of AIG Markets, Inc. arising from transactions entered into by AIG Markets, Inc.
In connection with AIGFP’s business activities, AIGFP has issued, in a limited number of transactions, standby letters of credit or similar facilities to equity investors of structured leasing transactions in an amount equal to the termination value owing to the equity investor by the lessee in the event of a lessee default (the equity termination value). The total amount outstanding at December 31, 2021 was $
AIG Parent files a consolidated federal income tax return with certain subsidiaries and acts as an agent for the consolidated tax group when making payments to the Internal Revenue Service (IRS). AIG Parent and its subsidiaries have adopted, pursuant to a written agreement, a method of allocating consolidated federal income taxes. Under an Amended and Restated Tax Payment Allocation Agreement dated June 6, 2011 between AIG Parent and one of its Bermuda-domiciled insurance subsidiaries, AIG Life of Bermuda, Ltd. (AIGB), AIG Parent has agreed to indemnify AIGB for any tax liability (including interest and penalties) resulting from adjustments made by the IRS or other appropriate authorities to taxable income, special deductions or credits in connection with investments made by AIGB in certain affiliated entities.
Business and Asset Dispositions
We are subject to financial guarantees and indemnity arrangements in connection with the completed sales of businesses and assets. The various arrangements may be triggered by, among other things, declines in asset values, the occurrence of specified business contingencies, the realization of contingent liabilities, developments in litigation or breaches of representations, warranties or covenants provided by us. These arrangements are typically subject to various time limitations, defined by the contract or by operation of law, such as statutes of limitation. In some cases, the maximum potential obligation is subject to contractual limitations, while in other cases such limitations are not specified or are not applicable. The Majority Interest Fortitude Sale was subject to a post-closing purchase price adjustment pursuant to which AIG would pay Fortitude Re for certain adverse development in property casualty related reserves, based on an agreed methodology, that may occur through December 31, 2023, up to a maximum of $
AIG | 2021 Form 10-K 291
ITEM 8 | Notes to Consolidated Financial Statements | 15. Contingencies, Commitments and Guarantees
agreement to finalize the post-closing purchase price adjustment for adverse reserve development. As a result of this amendment, during 2021, AIG recorded a $
We are unable to develop a reasonable estimate of the maximum potential payout under certain of these arrangements. Overall, we believe the likelihood that we will have to make any material payments related to completed sales under these arrangements is remote, and no material liabilities related to these arrangements have been recorded in the Consolidated Balance Sheets.
For additional information on the Fortitude Re transaction, see Note 1.
Other
For additional information on commitments and guarantees associated with VIEs, see Note 9.
For additional information about derivatives, see Note 10.
16. Equity
Shares Outstanding
Preferred Stock
On March 14, 2019, we issued
We may redeem the Series A Preferred Stock at our option, (a) in whole, but not in part, at any time prior to March 15, 2024, within
A “Rating Agency Event” is generally defined to mean that any nationally recognized statistical rating organization within the meaning of Section 3(a)(62) of the Securities Exchange Act of 1934, as amended (the Exchange Act) that then publishes a rating for us amends, clarifies or changes the criteria it uses to assign equity credit to securities such as the Series A Preferred Stock, which amendment, clarification or change results in the shortening of the length of time the Series A Preferred Stock is assigned a particular level of equity credit by that rating agency as compared to the length of time it would have been assigned that level of equity credit by that rating agency or its predecessor on the initial issuance of the Series A Preferred Stock, or the lowering of the equity credit (including up to a lesser amount) assigned to the Series A Preferred Stock by that rating agency as compared to the equity credit assigned by that rating agency or its predecessor on the initial issuance of the Series A Preferred Stock. A “Regulatory Capital Event” is generally defined to mean our good faith determination that as a result of a change in law, rule or regulation, or a proposed change or an official judicial or administrative pronouncement, there is more than an insubstantial risk that the full liquidation preference of the Series A Preferred Stock would not qualify as capital (or a substantially similar concept) for purposes of any group capital standard to which we are or will be subject.
Holders of the Series A Preferred Stock will be entitled to receive dividend payments only when, as and if declared by our Board of Directors (or a duly authorized committee of the board). Dividends will be payable from the original date of issue at a rate of
In the event of any liquidation, dissolution or winding-up of the affairs of AIG, whether voluntary or involuntary, before any distribution or payment out of our assets may be made to or set aside for the holders of any junior stock, holders of the Series A Preferred Stock will be entitled to receive out of our assets legally available for distribution to our stockholders, an amount equal to $
292 AIG | 2021 Form 10-K
The Series A Preferred Stock does not have voting rights, except in limited circumstances, including in the case of certain dividend non-payments.
The following table presents declaration date, record date, payment date and dividends paid per preferred share and per depository share on the Series A Preferred Stock in the twelve months ended December 31, 2021, 2020 and 2019:
|
|
| Dividends Paid | |||
Declaration Date | Record Date | Payment Date |
| Per Preferred Share |
| Per Depositary Share |
$ | $ | |||||
|
| |||||
|
| |||||
|
| |||||
$ | $ | |||||
|
| |||||
|
| |||||
|
| |||||
$ | $ | |||||
|
| |||||
|
| |||||
Common Stock
The following table presents a rollforward of outstanding shares:
| Common | Treasury | Common Stock |
| Stock Issued | Stock | Outstanding |
Year Ended December 31, 2019 |
|
|
|
Shares, beginning of year | ( | ||
Shares issued | |||
Shares repurchased | |||
Shares, end of year | ( | ||
Year Ended December 31, 2020 |
|
|
|
Shares, beginning of year | ( | ||
Shares issued | |||
Shares repurchased | ( | ( | |
Shares, end of year | ( | ||
Year Ended December 31, 2021 |
|
|
|
Shares, beginning of year | ( | ||
Shares issued | |||
Shares repurchased | ( | ( | |
Shares, end of year | ( |
Dividends
Dividends are payable on AIG Common Stock only when, as and if declared by our Board of Directors in its discretion, from funds legally available for this purpose. In considering whether to pay a dividend on or purchase shares of AIG Common Stock, our Board of Directors considers a number of factors, including, but not limited to: the capital resources available to support our insurance operations and business strategies, AIG’s funding capacity and capital resources in comparison to internal benchmarks, expectations for capital generation, rating agency expectations for capital, regulatory standards for capital and capital distributions, and such other factors as our Board of Directors may deem relevant. The payment of dividends is also subject to the terms of AIG’s outstanding Series A Preferred Stock, pursuant to which no dividends may be declared or paid on any AIG Common Stock unless the full dividends for the latest completed dividend period on all outstanding shares of Series A Preferred Stock have been declared and paid or provided for.
AIG | 2021 Form 10-K 293
The following table presents declaration date, record date, payment date and dividends paid per common share on AIG Common Stock in the twelve months ended December 31, 2021, 2020 and 2019:
|
|
|
|
| Dividends Paid |
Declaration Date | Record Date | Payment Date |
|
| Per Common Share |
| $ | ||||
|
| ||||
|
| ||||
|
| ||||
|
|
|
|
|
|
| $ | ||||
|
| ||||
|
| ||||
|
| ||||
|
|
|
|
|
|
| $ | ||||
|
| ||||
|
| ||||
|
|
Repurchase of AIG Common Stock
The following table presents repurchases of AIG Common Stock:
Years Ended December 31, |
|
|
|
|
|
|
|
(in millions) |
| 2021 |
| 2020 |
| 2019 |
|
Aggregate repurchases of common stock | $ | $ | $ |
| |||
Total number of common shares repurchased |
|
|
|
| |||
Aggregate repurchases of warrants* | $ | $ | $ |
| |||
Total number of warrants repurchased |
|
|
|
|
Shares may be repurchased from time to time in the open market, private purchases, through forward, derivative, accelerated repurchase or automatic repurchase transactions or otherwise. Certain of our share repurchases have been and may from time to time be effected through Securities Exchange Act of 1934 (Exchange Act) Rule 10b5-1 repurchase plans.
In August 2021, we executed an accelerated stock repurchase (ASR) agreement with a third-party financial institution. The total number of shares of AIG Common Stock repurchased in the year ended December 31, 2021, and the aggregate purchase price of those shares, reflect our payment of $
Additionally, in the year ended December 31, 2021, we repurchased approximately
The timing of any future repurchases will depend on market conditions, our business and strategic plans, financial condition, results of operations, liquidity and other factors. The repurchase of AIG Common Stock is also subject to the terms of AIG’s outstanding Series A Preferred Stock, pursuant to which AIG may not (other than in limited circumstances) purchase, redeem or otherwise acquire AIG Common Stock unless the full dividends for the latest completed dividend period on all outstanding shares of Series A Preferred Stock have been declared and paid or provided for.
294 AIG | 2021 Form 10-K
Accumulated Other Comprehensive Income (Loss)
The following table presents a rollforward of Accumulated other comprehensive income (loss):
| Unrealized Appreciation |
|
|
|
|
|
|
| Fair Value of |
|
| |
| (Depreciation) of Fixed |
| Unrealized |
|
|
|
|
| Liabilities Under |
|
| |
| Maturity Securities on |
| Appreciation |
| Foreign |
| Retirement |
| Fair Value Option |
|
| |
| Which Other-Than- |
| (Depreciation) |
| Currency |
| Plan |
| Attributable to |
|
| |
| Temporary Credit |
| of All Other |
| Translation |
| Liabilities |
| Changes in |
|
| |
(in millions) | Impairments Were Taken |
| Investments |
| Adjustments |
| Adjustment |
| Own Credit Risk |
| Total | |
Balance, January 1, 2019, net of tax | $ | ( | $ | $ | ( | $ | ( | $ | $ | ( | ||
Change in unrealized appreciation |
|
|
|
|
|
|
|
|
|
|
|
|
of investments |
|
|
| - |
| - |
| - |
| |||
Change in deferred policy acquisition costs |
|
|
|
|
|
|
|
|
|
|
|
|
adjustment and other* |
|
| ( |
| - |
| - |
| - |
| ( | |
Change in future policy benefits |
| - |
| ( |
| - |
| - |
| - |
| ( |
Change in foreign currency translation adjustments |
| - |
| - |
|
| - |
| - |
| ||
Change in net actuarial loss |
| - |
| - |
| - |
| ( |
| - |
| ( |
Change in prior service credit |
| - |
| - |
| - |
| ( |
| - |
| ( |
Change in deferred tax asset (liability) |
| ( |
| ( |
| ( |
|
| - |
| ( | |
Change in fair value of liabilities under fair value |
|
|
|
|
|
|
|
|
|
|
|
|
option attributable to changes in own credit risk |
| - |
| - |
| - |
| - |
| ( |
| ( |
Total other comprehensive income (loss) |
|
|
|
| ( |
| ( |
| ||||
Noncontrolling interests |
| - |
|
|
| - |
| - |
| |||
Balance, December 31, 2019, net of tax | $ | $ | $ | ( | $ | ( | $ | $ | ||||
|
|
|
|
|
|
|
|
|
|
|
|
|
|
| Unrealized Appreciation |
|
|
|
|
|
|
| Fair Value of |
|
|
|
| (Depreciation) of Fixed |
| Unrealized |
|
|
|
|
| Liabilities Under |
|
|
|
| Maturity Securities on |
| Appreciation |
| Foreign |
| Retirement |
| Fair Value Option |
|
|
|
| Which Allowance |
| (Depreciation) |
| Currency |
| Plan |
| Attributable to |
|
|
|
| for Credit Losses |
| of All Other |
| Translation |
| Liabilities |
| Changes in |
|
|
(in millions) |
| Was Taken |
| Investments |
| Adjustments |
| Adjustment |
| Own Credit Risk |
| Total |
Balance, January 1, 2020, net of tax | $ | $ | $ | ( | $ | ( | $ | $ | ||||
Change in unrealized appreciation (depreciation) |
|
|
|
|
|
|
|
|
|
|
|
|
of investments |
| ( |
|
| - |
| - |
| - |
| ||
Change in deferred policy acquisition costs |
|
|
|
|
|
|
|
|
|
|
|
|
adjustment and other |
|
| ( |
| - |
| - |
| - |
| ( | |
Change in future policy benefits |
| - |
|
| - |
| - |
| - |
| ||
Change in foreign currency translation adjustments |
| - |
| - |
|
| - |
| - |
| ||
Change in net actuarial loss |
| - |
| - |
| - |
| ( |
| - |
| ( |
Change in prior service credit |
| - |
| - |
| - |
| ( |
| - |
| ( |
Change in deferred tax asset (liability) |
|
| ( |
|
| ( |
| - |
| ( | ||
Change in fair value of liabilities under fair value |
|
|
|
|
|
|
|
|
|
|
|
|
option attributable to changes in own credit risk |
| - |
| - |
| - |
| - |
|
| ||
Total other comprehensive income (loss) |
| ( |
|
|
| ( |
|
| ||||
Noncontrolling interests |
| - |
| ( |
|
| - |
| - |
| ( | |
Balance, December 31, 2020, net of tax | $ | ( | $ | $ | ( | $ | ( | $ | $ | |||
Change in unrealized appreciation (depreciation) |
|
|
|
|
|
|
|
|
|
|
|
|
of investments |
|
| ( |
| - |
| - |
| - |
| ( | |
Change in deferred policy acquisition costs |
|
|
|
|
|
|
|
|
|
|
|
|
adjustment and other |
| ( |
|
| - |
| - |
| - |
| ||
Change in future policy benefits |
| - |
|
| - |
| - |
| - |
| ||
Change in foreign currency translation adjustments |
| - |
| - |
| ( |
| - |
| - |
| ( |
Change in net actuarial loss |
| - |
| - |
| - |
|
| - |
| ||
Change in prior service cost |
| - |
| - |
| - |
|
| - |
| ||
Change in deferred tax asset (liability) |
| ( |
|
| ( |
| ( |
| - |
| ||
Change in fair value of liabilities under fair value |
|
|
|
|
|
|
|
|
|
|
|
|
option attributable to changes in own credit risk |
| - |
| - |
| - |
| - |
| ( |
| ( |
Total other comprehensive income (loss) |
|
| ( |
| ( |
|
| ( |
| ( | ||
Other changes in AOCI: |
|
|
|
|
|
|
|
|
|
|
|
|
SAFG |
|
| ( |
| ( |
|
|
| ( | |||
Noncontrolling interests |
| - |
| ( |
| ( |
| - |
| - |
| ( |
Balance, December 31, 2021, net of tax | $ | ( | $ | $ | ( | $ | ( | $ | $ | |||
AIG | 2021 Form 10-K 295
The following table presents the other comprehensive income (loss) reclassification adjustments for the years ended December 31, 2021, 2020 and 2019:
|
| Unrealized Appreciation |
|
|
|
|
|
|
| Fair Value of |
|
|
|
| (Depreciation) of Fixed |
| Unrealized |
|
|
|
|
| Liabilities Under |
|
|
|
| Maturity Securities on |
| Appreciation |
| Foreign |
| Retirement |
| Fair Value Option |
|
|
|
| Which Other-Than- |
| (Depreciation) |
| Currency |
| Plan |
| Attributable to |
|
|
|
| Temporary Credit |
| of All Other |
| Translation |
| Liabilities |
| Changes in |
|
|
(in millions) |
| Impairments Were Taken |
| Investments |
| Adjustments |
| Adjustment |
| Own Credit Risk |
| Total |
December 31, 2019 |
|
|
|
|
|
|
|
|
|
|
|
|
Unrealized change arising during period | $ | $ | $ | $ | ( | $ | ( | $ | ||||
Less: Reclassification adjustments |
|
|
|
|
|
|
|
|
|
|
|
|
included in net income |
| ( |
|
|
| ( |
|
| ||||
Total other comprehensive income (loss), |
|
|
|
|
|
|
|
|
|
|
|
|
before income tax expense (benefit) |
|
|
|
| ( |
| ( |
| ||||
Less: Income tax expense (benefit) |
|
|
|
| ( |
|
| |||||
Total other comprehensive income (loss), |
|
|
|
|
|
|
|
|
|
|
|
|
net of income tax expense (benefit) | $ | $ | $ | $ | ( | $ | ( | $ | ||||
|
|
|
|
|
|
|
|
|
|
|
|
|
|
| Unrealized Appreciation |
|
|
|
|
|
|
| Fair Value of |
|
|
|
| (Depreciation) of Fixed |
| Unrealized |
|
|
|
|
| Liabilities Under |
|
|
|
| Maturity Securities on |
| Appreciation |
| Foreign |
| Retirement |
| Fair Value Option |
|
|
|
| Which Allowance |
| (Depreciation) |
| Currency |
| Plan |
| Attributable to |
|
|
|
| for Credit Losses |
| of All Other |
| Translation |
| Liabilities |
| Changes in |
|
|
(in millions) |
| Was Taken |
| Investments |
| Adjustments |
| Adjustment |
| Own Credit Risk |
| Total |
December 31, 2020 |
|
|
|
|
|
|
|
|
|
|
|
|
Unrealized change arising during period | $ | ( | $ | $ | $ | ( | $ | $ | ||||
Less: Reclassification adjustments |
|
|
|
|
|
|
|
|
|
|
|
|
included in net income |
| ( |
|
|
| ( |
|
| ||||
Total other comprehensive income (loss), |
|
|
|
|
|
|
|
|
|
|
|
|
before income tax expense (benefit) |
| ( |
|
|
| ( |
|
| ||||
Less: Income tax expense (benefit) |
| ( |
|
| ( |
|
|
| ||||
Total other comprehensive income (loss), |
|
|
|
|
|
|
|
|
|
|
|
|
net of income tax expense (benefit) | $ | ( | $ | $ | $ | ( | $ | $ | ||||
|
|
|
|
|
|
|
|
|
|
|
|
|
December 31, 2021 |
|
|
|
|
|
|
|
|
|
|
|
|
Unrealized change arising during period | $ | $ | ( | $ | ( | $ | $ | ( | $ | ( | ||
Less: Reclassification adjustments |
|
|
|
|
|
|
|
|
|
|
|
|
included in net income |
|
|
|
| ( |
|
| |||||
Total other comprehensive income (loss), |
|
|
|
|
|
|
|
|
|
|
|
|
before income tax expense (benefit) |
|
| ( |
| ( |
|
| ( |
| ( | ||
Less: Income tax expense (benefit) |
|
| ( |
|
|
|
| ( | ||||
Total other comprehensive income (loss), |
|
|
|
|
|
|
|
|
|
|
|
|
net of income tax expense (benefit) | $ | $ | ( | $ | ( | $ | $ | ( | $ | ( |
296 AIG | 2021 Form 10-K
|
|
|
|
|
|
|
| Affected Line Item in the |
Years Ended December 31, | Amount Reclassified from AOCI |
| Consolidated Statements | |||||
(in millions) | 2021 |
| 2020 |
| 2019 |
| of Income (Loss) | |
Unrealized appreciation (depreciation) of fixed maturity securities on |
|
|
|
|
|
|
|
|
which allowance for credit losses was taken |
|
|
|
|
|
|
|
|
Investments | $ | $ | ( | $ |
| Net realized gains | ||
Total |
|
| ( |
|
|
| ||
Unrealized appreciation (depreciation) of fixed maturity securities on |
|
|
|
|
|
|
|
|
which other-than-temporary credit impairments were taken |
|
|
|
|
|
|
|
|
Investments | $ | $ | $ | ( |
| Net realized gains | ||
Total |
|
|
| ( |
|
| ||
Unrealized appreciation (depreciation) of all other investments |
|
|
|
|
|
|
|
|
Investments |
|
|
|
| Net realized gains | |||
Total |
|
|
|
|
| |||
Change in retirement plan liabilities adjustment |
|
|
|
|
|
|
|
|
Prior-service credit |
| ( |
| ( |
|
| * | |
Actuarial losses |
| ( |
| ( |
| ( |
| * |
Total |
| ( |
| ( |
| ( |
|
|
Total reclassifications for the year | $ | $ | $ |
|
| |||
NON-CONTROLLING INTEREST
On November 2, 2021, AIG and Blackstone completed the acquisition by Blackstone of a
For additional information on the Life and Retirement business, see Note 1.
The following table presents the effect of changes in our ownership interest in SAFG on our equity:
Year Ended December 31, |
|
|
(in millions) |
| 2021 |
Net income attributable to AIG common shareholders | $ | |
Changes in AIG equity for sale of |
| ( |
Change from Net income attributable to AIG common shareholders and changes in AIG's ownership interests | $ |
AIG | 2021 Form 10-K 297
ITEM 8 | Notes to Consolidated Financial Statements | 17. Earnings Per Common Share
17. Earnings Per Common Share (EPS)
The following table presents the computation of basic and diluted EPS:
Years Ended December 31, |
|
|
|
|
|
|
(dollars in millions, except per common share data) |
| 2021 |
| 2020 |
| 2019 |
Numerator for EPS: |
|
|
|
|
|
|
Income (loss) from continuing operations | $ | $ | ( | $ | ||
Less: Net income from continuing operations attributable to noncontrolling interests |
|
|
| |||
Less: Preferred stock dividends |
|
|
| |||
Income (loss) attributable to AIG common shareholders from continuing operations |
|
| ( |
| ||
Income from discontinued operations, net of income tax expense |
|
|
| |||
Net income (loss) attributable to AIG common shareholders | $ | $ | ( | $ | ||
Denominator for EPS: |
|
|
|
|
|
|
Weighted average common shares outstanding – basic |
|
|
| |||
Dilutive common shares |
|
|
| |||
Weighted average common shares outstanding – diluted(a)(b) |
|
|
| |||
Income (loss) per common share attributable to AIG common shareholders: |
|
|
|
|
|
|
Basic: |
|
|
|
|
|
|
Income (loss) from continuing operations | $ | $ | ( | $ | ||
Income from discontinued operations | $ | $ | $ | |||
Income (loss) attributable to AIG common shareholders | $ | $ | ( | $ | ||
Diluted: |
|
|
|
|
|
|
Income (loss) from continuing operations | $ | $ | ( | $ | ||
Income from discontinued operations | $ | $ | $ | |||
Income (loss) attributable to AIG common shareholders | $ | $ | ( | $ |
For information regarding the Blackstone option to exchange all or a portion of its ownership interest in SAFG for AIG common shares, see Note 1. For information regarding our repurchases of AIG Common Stock, see Note 16.
298 AIG | 2021 Form 10-K
ITEM 8 | Notes to Consolidated Financial Statements | 18. Statutory Financial Data and Restrictions
18. Statutory Financial Data and Restrictions
The following table presents statutory net income (loss) and capital and surplus for our General Insurance companies and our Life and Retirement companies in accordance with statutory accounting practices:
(in millions) |
| 2021 |
| 2020 |
| 2019 |
Years Ended December 31, |
|
|
|
|
|
|
Statutory net income (loss)(a)(b): |
|
|
|
|
|
|
General Insurance companies: |
|
|
|
|
|
|
Domestic | $ | $ | $ | |||
Foreign |
|
|
| |||
Total General Insurance companies | $ | $ | $ | |||
Life and Retirement companies: |
|
|
|
|
|
|
Domestic | $ | $ | $ | |||
Foreign |
| ( |
|
| ||
Total Life and Retirement companies | $ | $ | $ | |||
|
|
|
|
|
|
|
At December 31, |
|
|
|
|
|
|
Statutory capital and surplus(a)(b): |
|
|
|
|
|
|
General Insurance companies: |
|
|
|
|
|
|
Domestic | $ | $ |
|
| ||
Foreign |
|
|
|
| ||
Total General Insurance companies | $ | $ |
|
| ||
Life and Retirement companies: |
|
|
|
|
|
|
Domestic | $ | $ |
|
| ||
Foreign |
|
|
|
| ||
Total Life and Retirement companies | $ | $ |
|
| ||
Aggregate minimum required statutory capital and surplus: |
|
|
|
|
|
|
General Insurance companies: |
|
|
|
|
|
|
Domestic | $ | $ |
|
| ||
Foreign |
|
|
|
| ||
Total General Insurance companies | $ | $ |
|
| ||
Life and Retirement companies: |
|
|
|
|
|
|
Domestic | $ | $ |
|
| ||
Foreign |
|
|
|
| ||
Total Life and Retirement companies | $ | $ |
|
|
(a) Excludes discontinued operations and other divested businesses. Statutory capital and surplus and net income (loss) with respect to foreign operations are as of November 30.
(b)
The 2021 amounts reflect our best estimate of the statutory net income, capital and surplus as of the date of AIG’s Form 10-K filing. In aggregate, the 2020 General Insurance companies and Life and Retirement companies statutory net income decreased by $
Our insurance subsidiaries file financial statements prepared in accordance with statutory accounting practices prescribed or permitted by domestic and foreign insurance regulatory authorities. The principal differences between statutory financial statements and financial statements prepared in accordance with U.S. GAAP for domestic companies are that statutory financial statements do not reflect DAC, some bond portfolios may be carried at amortized cost, investment impairments are determined in accordance with statutory accounting practices, assets and liabilities are presented net of reinsurance, policyholder liabilities are generally valued using more conservative assumptions and certain assets are non-admitted.
For domestic insurance subsidiaries, aggregate minimum required statutory capital and surplus is based on the greater of the RBC level that would trigger regulatory action or minimum requirements per state insurance regulation. Capital and surplus requirements of our foreign subsidiaries differ from those prescribed in the U.S., and can vary significantly by jurisdiction. At both December 31, 2021 and 2020, all domestic and foreign insurance subsidiaries individually exceeded the minimum required statutory capital and surplus requirements and all domestic insurance subsidiaries individually exceeded RBC minimum required levels.
AIG | 2021 Form 10-K 299
ITEM 8 | Notes to Consolidated Financial Statements | 18. Statutory Financial Data and Restrictions
At December 31, 2021 and 2020, our domestic insurance subsidiaries used the following permitted practices that resulted in reported statutory surplus or risk-based capital that is significantly different from the statutory surplus or risk based capital that would have been reported had NAIC statutory accounting practices or the prescribed regulatory accounting practices of their respective state regulator been followed in all respects:
Effective December 31, 2019 and subsequent reporting periods through September 30, 2020, a domestic life insurance subsidiary domiciled in Texas adopted a permitted statutory accounting practice to recognize an admitted asset related to the notional value of coverage defined in an excess of loss reinsurance agreement, net of specified amounts. This reinsurance agreement has a 20-year term and provides coverage to the subsidiary for aggregate claims incurred during the agreement term associated with guaranteed minimum withdrawal benefits on certain fixed index annuities generally issued prior to April 2019 (Block 1) exceeding an attachment point defined in the treaty.
Effective October 1, 2020 and subsequent reporting periods through September 30, 2023, this permitted practice was expanded to similarly recognize an additional admitted asset related to the notional value of coverage defined in a separate excess of loss reinsurance agreement, net of specified amounts. This additional reinsurance agreement has a 25-year term and provides coverage to the subsidiary for aggregate excess of loss claims associated with guaranteed minimum withdrawal benefits on a block of fixed index annuities generally issued in April 2019 or later, including new business issued after the effective date (Block 2). In addition, effective December 31, 2020, this expanded permitted practice also extended the term of the permitted practice for Block 1 from September 30, 2020 to September 30, 2023. The reinsurance agreement covering contracts in Block 1 was also amended to conform certain provisions to be consistent with the Block 2 reinsurance agreement. The permitted practice allows the subsidiary to manage its reserves in a manner more in line with anticipated principle-based reserving requirements once they have been developed. This permitted practice resulted in an increase in the statutory surplus of this subsidiary of approximately $
As described in Note 12, our domestic property and casualty insurance subsidiaries domiciled in New York, Pennsylvania and Delaware discount non-tabular workers’ compensation reserves based on applicable prescribed or approved regulations, or in the case of our Delaware subsidiary, based on a permitted practice. This practice did not have a material impact on our statutory surplus, statutory net income (loss) or risk-based capital.
Regulation XXX requires U.S. life insurers to establish additional statutory reserves for term life insurance policies with long-term premium guarantees and universal life policies with secondary guarantees (ULSGs). In addition, Guideline AXXX clarifies the application of Regulation XXX as to these guarantees, including certain ULSGs.
Our domestic life insurance subsidiaries manage the capital impact of statutory reserve requirements under Regulation XXX and Guideline AXXX through unaffiliated and affiliated reinsurance transactions. The affiliated life insurers providing reinsurance capacity for such transactions are fully licensed insurance companies and are not formed under captive insurance laws.
Under the other intercompany reinsurance arrangement, certain Regulation XXX and Guideline AXXX reserves related to a closed block of in-force business are ceded to an affiliated off-shore life insurer, which is licensed as a class E insurer under Bermuda law. This reinsurance arrangement does not meet the criteria for reinsurance accounting under U.S. GAAP; therefore, deposit accounting is applied by the assuming off-shore life insurer. Letters of credit are used to support the credit for reinsurance provided by the affiliated off-shore life insurer.
For additional information regarding these letters of credit see Note 7.
Subsidiary Dividend Restrictions
Payments of dividends to us by our insurance subsidiaries are subject to certain restrictions imposed by regulatory authorities. With respect to our domestic insurance subsidiaries, the payment of any dividend requires formal notice to the insurance department in which the particular insurance subsidiary is domiciled. For example, unless permitted by the Superintendent of Financial Services, property casualty companies domiciled in New York generally may not pay dividends to shareholders that, in any 12-month period, exceed the lesser of
300 AIG | 2021 Form 10-K
ITEM 8 | Notes to Consolidated Financial Statements | 18. Statutory Financial Data and Restrictions
Largely as a result of these restrictions, approximately $
To our knowledge, no AIG insurance company is currently on any regulatory or similar “watch list” with regard to solvency.
Parent Company Dividend Restrictions
At December 31, 2021, our ability to pay dividends is not subject to any significant contractual restrictions, but remains subject to regulatory restrictions.
19. Share-Based Compensation Plans
The following table presents our total share-based compensation expense:
Years Ended December 31, |
|
|
|
|
|
|
|
(in millions) |
|
| 2021 |
| 2020 |
| 2019 |
Share-based compensation expense - pre-tax(a) |
| $ | $ | $ | |||
Share-based compensation expense - after tax(b) |
|
|
|
|
Employee Plans
The Company sponsors several stock compensation programs under the AIG Long Term Incentive Plan (LTIP) (as amended) from which performance share units (PSUs), restricted stock units (RSUs), stock options and deferred stock units (DSUs) (collectively units) are issued. In addition, off-cycle grants are made from time to time during the year generally as sign-on awards to new hires or as a result of a change in employee status. The LTIP was governed by the AIG 2013 Omnibus Incentive Plan (2013 Omnibus Plan), until it was replaced by the 2021 Omnibus Plan, which was adopted at the annual shareholders’ meeting in May 2021. The adoption occurred after the annual 2021 LTI awards were granted.
Our share-settled awards are settled with previously acquired shares held in AIG’s treasury.
AIG Omnibus Incentive Plan
The 2013 Omnibus Plan, which replaced the AIG 2010 Stock Incentive Plan (2010 Plan), provided for the grants of share-based awards to our employees and non-employee directors. The total number of shares granted under the 2013 Omnibus Plan (the reserve) was the sum of 1)
Upon the adoption of the 2021 Omnibus Plan,
AIG | 2021 Form 10-K 301
ITEM 8 | Notes to Consolidated Financial Statements | 19. Share-Based Compensation Plans
AIG Long Term Incentive Plan
Long-Term Incentive (LTI) Awards
The LTIP provides for an annual award to certain employees, including our senior executive officers and other highly compensated employees that may be comprised of a combination of one or more of the following units: PSUs, RSUs or stock options.
The number of PSUs issued on the grant date (the target) provides the opportunity for LTIP participants (usually senior management) to receive shares of AIG Common Stock based on AIG achieving specified performance goals at the end of a performance period. These performance goals are pre-established by AIG’s Compensation and Management Resources Committee (CMRC) for each annual grant and may differ from year to year. The actual number of PSUs earned can vary from
RSUs and stock options are earned based solely on continued service by the participant.
Vesting occurs on January 1 of the year immediately following the end of the performance period. Recipients must be employed at each vesting date to be entitled to share delivery, except upon the occurrence of an accelerated vesting event, such as an involuntary termination without cause, disability, retirement eligibility or death during the vesting period.
Prior to 2021, LTI awards accrued dividend equivalent units (DEUs) in the form of additional PSUs and RSUs whenever a cash dividend was declared on shares of AIG Common Stock; the DEUs are subject to the same vesting terms and conditions as the underlying unit. Beginning in 2021, PSUs and RSUs granted via the annual 2021 LTI award (as of the date of grant), and those existing from the 2020 and 2019 LTI awards (as of the third quarter) accrue dividend equivalent rights (DERs) as AIG’s dividends are declared. These DERs will be settled in cash only if the underlying units’ vesting conditions are met; previously accrued DEUs were not impacted by this change.
Unit Valuation
The fair value of time-vesting RSUs as well as PSUs that are earned based on certain company-specific metrics was based on the closing price of AIG Common Stock on the grant date; while the fair value of PSUs that are earned based on AIG’s relative total shareholder return (TSR) was determined on the grant date using a Monte Carlo simulation.
The following table presents the assumptions used to estimate the fair value of PSUs that vest based on AIG’s TSR:
|
|
|
|
| 2021 |
|
Expected dividend yield(a) |
|
|
|
| % | |
Expected volatility(b) |
|
|
|
| % | |
Risk-free interest rate(c) |
|
|
|
| % |
(a) The award agreement provides that TSR for AIG and each member of the Peer Group will be calculated assuming dividends distributed are reinvested on the ex-dividend date.
(b)We used the historical volatility over the most recent
(c)We converted the semi-annual zero-coupon U.S. Treasury rates as of the Valuation Date to continuously compounded rates. We then chose the continuously compounded risk-free rate that is commensurate with the length of the remaining performance period as of the valuation date and interpolated between the yields of the and the continuously compounded rates to determine the yield.
Modification of LTI awards
During the third quarter of 2019, we added a modifier to the 2019 performance share units awarded to certain senior executives to cap payout at
During the third quarter of 2020, we reduced the performance goals from
302 AIG | 2021 Form 10-K
ITEM 8 | Notes to Consolidated Financial Statements | 19. Share-Based Compensation Plans
The following table summarizes outstanding share-settled LTI awards(a):
|
|
|
|
| Weighted Average | |||||
As of or for the Year | Number of Units |
| Grant-Date Fair Value | |||||||
Ended December 31, 2021(b) | 2021 LTI | 2020 LTI | 2019 LTI |
| 2021 LTI | 2020 LTI | 2019 LTI | |||
Unvested, beginning of year |
| $ | $ | $ | ||||||
Granted |
|
|
|
| ||||||
Vested(c) | ( | ( | ( |
|
|
|
| |||
Forfeited | ( | ( | ( |
|
|
|
| |||
Unvested, end of year(d) |
| $ | $ | $ | ||||||
(b) PSUs represent target amount granted and does not reflect potential increases or decreases that could result from the final outcome of the performance goals for the respective awards, which is determined by the CMRC in the quarter after the applicable performance period ends.
(c) Also reflects units that vest as a result of an accelerated vesting event that occurred prior to the specified vesting date.
(d)
At December 31, 2021, the total unrecognized compensation cost for outstanding RSUs and PSUs was $
Stock Options
Stock options were issued as part of the 2021, 2020 and 2019 LTI awards, and to certain newly hired senior executives in 2017 and 2018. Option awards are generally granted with an exercise price equal to the market price of the company’s stock on the grant date. The fair value of the options was estimated on the grant date using the Black-Scholes model for the time-vesting options, and a Monte Carlo simulation for the hurdle-vesting options using the assumptions noted in the following table.
| 2021 |
| 2020 |
| 2019 |
|
Expected annual dividend yield(a) | % | % | % | |||
Expected volatility(b) | % | % | % | |||
Risk-free interest rate(c) | % | % | % | |||
Expected term(d) | years | years | years |
(b)
The expected volatility is based on the implied volatility of
(c) The risk-free interest rate is the continuously compounded interest rate for the term between the valuation date and the expiration date that is assumed to be constant and equal to the interpolated value between the closest data points on the U.S. dollar LIBOR-swap curve as of the valuation date.
(d)
The contractual terms are
|
|
|
|
| Weighted Average |
|
| Aggregate | |
As of or for the Year |
|
|
| Weighted Average |
| Remaining |
|
| Intrinsic Values |
Ended December 31, 2021 | Units |
|
| Exercise Price | Contractual Life |
| (in millions) | ||
Outstanding, beginning of year |
| $ |
|
|
|
| |||
Granted |
|
|
|
|
|
|
| ||
Exercised | ( |
|
|
|
|
|
|
| |
Forfeited or expired | ( |
|
|
|
|
|
|
| |
Outstanding, end of year |
| $ |
|
| $ | ||||
Exercisable, end of year |
| $ |
|
| $ | ||||
The weighted average grant-date fair value of stock options granted during 2021, 2020 and 2019 was $
AIG | 2021 Form 10-K 303
ITEM 8 | Notes to Consolidated Financial Statements | 19. Share-Based Compensation Plans
Other RSU Grants
The Company may issue time-vesting RSUs for various reasons including, as a sign-on bonus, retention grant or replacement award in an acquisition. Vesting for these awards generally ranges from
The following table summarizes outstanding share-settled RSU grants.
|
|
|
|
| Weighted Average | |||||
As of or for the Year | Number of Units |
| Grant-Date Fair Value | |||||||
Ended December 31, | 2021 | 2020 | 2019 |
|
| 2021 |
| 2020 |
| 2019 |
Unvested, beginning of year |
| $ | $ | $ | ||||||
Granted |
|
|
|
| ||||||
Vested | ( | ( | ( |
|
|
|
| |||
Forfeited | ( | ( | ( |
|
|
|
| |||
Unvested, end of year |
| $ | $ | $ | ||||||
We recognized $
Non-Employee Plan
Our non-employee directors, who serve on our Board of Directors, receive share-based compensation in the form of fully vested DSUs with delivery deferred until retirement from the Board. DSUs granted in 2021, 2020 and 2019 accrue dividend equivalents in the form of additional DSUs equal to the amount of any regular quarterly dividend that would have been paid by AIG if the shares of AIG Common Stock underlying the DSUs had been outstanding. In 2021, 2020 and 2019, we granted to non-employee directors
20. Employee Benefits
Pension Plans
We offer various defined benefit plans to eligible employees. Effective January 1, 2016, the U.S. defined benefit pension plans were frozen. Consequently, these plans are closed to new participants and current participants no longer earn benefits.
The U.S. AIG Retirement Plan (the qualified plan) is a noncontributory defined benefit plan subject to the provisions of ERISA. In 2012, the qualified plan was converted to a cash balance formula comprised of pay credits based on percent of a plan participant’s annual compensation (subject to IRS limitations) and annual interest credits. Although benefits are frozen, these interest credits continue to accrue on the cash balance accounts of active participants, who also accrue years of service for purposes of early retirement eligibility and subsidies. Employees can take their vested benefits when they leave AIG as a lump sum or an annuity option.
Employees satisfying certain age and service requirements (i.e., grandfathered employees) remain covered under the average pay formula that was in effect prior to the conversion. The final average pay formula is based upon a percentage of final average compensation multiplied by years of credited service, up to
In the U.S. we also sponsor non-qualified unfunded defined benefit plans, such as the AIG Non-Qualified Retirement Income Plan (AIG NQRIP) for certain employees, including key executives, designed to supplement pension benefits provided by the qualified plan. The AIG NQRIP provides a benefit equal to the reduction in benefits under the qualified plan as a result of federal tax limitations on compensation and benefits payable.
Non-U.S. defined benefit plans generally are either based on the employee’s years of credited service and compensation in the years preceding retirement or on points accumulated based on the employee’s job grade and other factors during each year of service.
304 AIG | 2021 Form 10-K
Postretirement Plans
U.S. postretirement medical and life insurance benefits are based upon the employee attaining the age of
Postretirement benefits are offered in certain non-U.S. countries and vary by geographic location.
The following table presents the funded status of the plans reconciled to the amount reported in the Consolidated Balance Sheets. The measurement date for most of the non-U.S. defined benefit pension and postretirement plans is November 30, consistent with the fiscal year end of the sponsoring companies. For all other plans, measurement occurs as of December 31.
As of or for the Years Ended |
| Pension |
| Postretirement | ||||||||||||||
December 31, |
| U.S. Plans(a) |
| Non-U.S. Plans(a) |
| U.S. Plans |
| Non-U.S. Plans | ||||||||||
(in millions) |
| 2021 |
| 2020 |
|
| 2021 |
| 2020 |
| 2021 |
| 2020 |
|
| 2021 |
| 2020 |
Change in projected benefit obligation: |
|
|
|
|
|
|
|
|
|
|
|
|
|
|
|
|
|
|
Benefit obligation, beginning of year | $ | $ |
| $ | $ | $ | $ |
| $ | $ | ||||||||
Service cost |
|
|
|
|
|
|
|
|
|
| ||||||||
Interest cost |
|
|
|
|
|
|
|
|
|
| ||||||||
Actuarial (gain) loss(b) |
| ( |
|
|
|
|
| ( |
|
|
| ( |
| |||||
Benefits paid: |
|
|
|
|
|
|
|
|
|
|
|
|
|
|
|
|
|
|
AIG assets |
| ( |
| ( |
|
| ( |
| ( |
| ( |
| ( |
|
| ( |
| ( |
Plan assets |
| ( |
| ( |
|
| ( |
| ( |
|
|
|
|
| ||||
Plan amendment |
|
|
|
|
|
|
|
|
| ( |
| |||||||
Curtailments |
|
|
|
|
|
|
|
|
| ( |
| |||||||
Settlements |
| ( |
|
|
| ( |
| ( |
|
|
|
|
| |||||
Foreign exchange effect |
|
|
|
| ( |
|
|
|
|
|
| |||||||
Other |
| ( |
| ( |
|
|
|
|
|
|
|
| ||||||
Projected benefit obligation, end of year | $ | $ |
| $ | $ | $ | $ |
| $ | $ | ||||||||
Change in plan assets: |
|
|
|
|
|
|
|
|
|
|
|
|
|
|
|
|
|
|
Fair value of plan assets, beginning |
|
|
|
|
|
|
|
|
|
|
|
|
|
|
|
|
|
|
of year | $ | $ |
| $ | $ | $ | $ |
| $ | $ | ||||||||
Actual return on plan assets, net of expenses |
|
|
|
|
|
|
|
|
|
| ||||||||
AIG contributions |
|
|
|
|
|
|
|
|
|
| ||||||||
Benefits paid: |
|
|
|
|
|
|
|
|
|
|
|
|
|
|
|
|
|
|
AIG assets |
| ( |
| ( |
|
| ( |
| ( |
| ( |
| ( |
|
| ( |
| ( |
Plan assets |
| ( |
| ( |
|
| ( |
| ( |
|
|
|
|
| ||||
Settlements |
| ( |
|
|
| ( |
| ( |
|
|
|
|
| |||||
Foreign exchange effect |
|
|
|
| ( |
|
|
|
|
|
| |||||||
Fair value of plan assets, end of year | $ | $ |
| $ | $ | $ | $ |
| $ | $ | ||||||||
Funded status, end of year | $ | ( | $ | ( |
| $ | ( | $ | ( | $ | ( | $ | ( |
| $ | ( | $ | ( |
Amounts recognized in the balance |
|
|
|
|
|
|
|
|
|
|
|
|
|
|
|
|
|
|
sheet: |
|
|
|
|
|
|
|
|
|
|
|
|
|
|
|
|
|
|
Assets | $ | $ |
| $ | $ | $ | $ |
| $ | $ | ||||||||
Liabilities |
| ( |
| ( |
|
| ( |
| ( |
| ( |
| ( |
|
| ( |
| ( |
Total amounts recognized | $ | ( | $ | ( |
| $ | ( | $ | ( | $ | ( | $ | ( |
| $ | ( | $ | ( |
Pre-tax amounts recognized in Accumulated |
|
|
|
|
|
|
|
|
|
|
|
|
|
|
|
|
|
|
other comprehensive income (loss): |
|
|
|
|
|
|
|
|
|
|
|
|
|
|
|
|
|
|
Net gain (loss) | $ | ( | $ | ( |
| $ | ( | $ | ( | $ | $ | ( |
| $ | $ | ( | ||
Prior service (cost) credit |
|
|
|
| ( |
| ( |
|
|
|
|
| ||||||
Total amounts recognized | $ | ( | $ | ( |
| $ | ( | $ | ( | $ | $ | ( |
| $ | $ | ( | ||
(a)
Includes non-qualified unfunded plans of which the aggregate projected benefit obligation was $
AIG | 2021 Form 10-K 305
(b) The significant gain in 2021 is primarily due to the changes in discount rates and the mortality projection scale for the U.S. AIG Retirement Plan.
At December 31, |
|
|
|
|
(in millions) |
| 2021 |
| 2020 |
U.S. pension benefit plans | $ | $ | ||
Non-U.S. pension benefit plans | $ | $ |
At December 31, | PBO Exceeds Fair Value of Plan Assets | ABO Exceeds Fair Value of Plan Assets | ||||||||||||||
|
| U.S. Plans |
| Non-U.S. Plans |
| U.S. Plans |
| Non-U.S. Plans | ||||||||
(in millions) |
| 2021 |
| 2020 |
| 2021 |
| 2020 |
| 2021 |
| 2020 |
| 2021 |
| 2020 |
Projected benefit obligation | $ | $ | $ | $ | $ | - | $ | - | $ | - | $ | - | ||||
Accumulated benefit obligation |
| - |
| - |
| - |
| - |
|
|
|
| ||||
Fair value of plan assets |
|
|
|
|
|
|
|
| ||||||||
Years Ended December 31, | Pension |
| Postretirement | ||||||||||||||||||||||||
| U.S. Plans |
| Non-U.S. Plans |
| U.S. Plans |
| Non-U.S. Plans | ||||||||||||||||||||
(in millions) |
| 2021 |
| 2020 |
| 2019 |
|
| 2021 |
| 2020 |
| 2019 |
|
| 2021 |
| 2020 |
| 2019 |
|
| 2021 |
| 2020 |
| 2019 |
Components of net periodic benefit |
|
|
|
|
|
|
|
|
|
|
|
|
|
|
|
|
|
|
|
|
|
|
|
|
|
|
|
cost: |
|
|
|
|
|
|
|
|
|
|
|
|
|
|
|
|
|
|
|
|
|
|
|
|
|
|
|
Service cost* | $ | $ | $ |
| $ | $ | $ |
| $ | $ | $ |
| $ | $ | $ | ||||||||||||
Interest cost |
|
|
|
|
|
|
|
|
|
|
|
|
|
|
| ||||||||||||
Expected return on assets |
| ( |
| ( |
| ( |
|
| ( |
| ( |
| ( |
|
|
|
|
|
|
|
| ||||||
Amortization of prior service cost (credit) |
|
|
|
|
|
|
|
|
|
|
|
|
|
| ( |
| ( | ||||||||||
Amortization of net (gain) loss |
|
|
|
|
|
|
|
|
|
|
| ( |
|
|
|
| |||||||||||
Net periodic benefit cost (credit) |
| ( |
| ( |
| ( |
|
|
|
|
|
|
|
|
|
|
|
| |||||||||
Settlement (credit) charges |
|
|
|
|
|
|
| ( |
|
|
|
|
|
|
|
| |||||||||||
Net benefit cost (credit) | $ | ( | $ | ( | $ | ( |
| $ | $ | $ |
| $ | $ | $ |
| $ | $ | $ | |||||||||
Total recognized in Accumulated other |
|
|
|
|
|
|
|
|
|
|
|
|
|
|
|
|
|
|
|
|
|
|
|
|
|
|
|
comprehensive income (loss) | $ | $ | ( | $ |
| $ | $ | ( | $ | ( |
| $ | $ | ( | $ | ( |
| $ | $ | ( | $ | ( | |||||
Total recognized in net periodic benefit |
|
|
|
|
|
|
|
|
|
|
|
|
|
|
|
|
|
|
|
|
|
|
|
|
|
|
|
cost and other comprehensive |
|
|
|
|
|
|
|
|
|
|
|
|
|
|
|
|
|
|
|
|
|
|
|
|
|
|
|
income (loss) | $ | $ | $ |
| $ | $ | ( | $ | ( |
| $ | $ | ( | $ | ( |
| $ | $ | ( | $ | ( | ||||||
Interest cost for pension and postretirement benefits for our U.S. plans and largest non-U.S. plans is measured using the spot rate approach, which applies specific spot rates along the yield curve to a plan’s corresponding discounted cash flows that comprise the obligation. This method provides a more precise measurement of interest cost by aligning the timing of the plans’ discounted cash flows to the corresponding spot rates on the yield curve. For certain non-U.S. plans, interest cost is measured utilizing a single weighted-average discount rate derived from the yield curve used to measure the benefit obligations.
A 100 basis point increase in the expected long-term rate of return would decrease the 2022 pension expense by approximately $
306 AIG | 2021 Form 10-K
Assumptions
The following table summarizes the weighted average assumptions used to determine the benefit obligations:
| Pension |
| Postretirement | |||||||||||
| U.S. Plans |
|
| Non-U.S. Plans | (a) |
| U.S. Plans |
| Non-U.S. Plans(a) |
| ||||
December 31, 2021 |
|
|
|
|
|
|
|
|
|
|
|
|
|
|
Discount rate | % |
|
|
| % |
| % |
|
| % | ||||
Interest crediting rate | % |
|
|
| %(b) |
| N/A |
|
|
| N/A |
| ||
Rate of compensation increase | N/A | (c) |
|
|
| % |
| N/A |
|
|
| N/A |
| |
December 31, 2020 |
|
|
|
|
|
|
|
|
|
|
|
|
|
|
Discount rate | % |
|
|
| % |
| % |
|
| % | ||||
Interest crediting rate | % |
|
|
| %(b) |
| N/A |
|
|
| N/A |
| ||
Rate of compensation increase | N/A | (c) |
|
|
| % |
| N/A |
|
|
| N/A |
| |
(a) The non-U.S. plans reflect those assumptions that were most appropriate for the local economic environments of each of the subsidiaries providing such benefits.
(b) Represents the weighted average interest crediting rate of non-U.S. cash balance plans primarily in Japan and Switzerland.
(c) Compensation increases are no longer applicable as the plan is frozen effective January 1, 2016.
The following table summarizes assumed health care cost trend rates for the U.S. plans:
At December 31, | 2021 | 2020 |
Following year: |
|
|
Medical (before age 65) | ||
Medical (age 65 and older) | ||
Ultimate rate to which cost increase is assumed to decline | ||
Year in which the ultimate trend rate is reached: |
|
|
Medical (before age 65) | ||
Medical (age 65 and older) |
| Pension |
| Postretirement | ||||||||||
| U.S. Plans |
| Non-U.S. Plans(a) |
|
| U.S. Plans |
| Non-U.S. Plans(a) |
| ||||
For the Year Ended December 31, 2021 |
|
|
|
|
|
|
|
|
|
|
|
|
|
Discount rate | % |
|
| % |
| % |
|
| % | ||||
Interest crediting rate | % |
|
| %(b) |
| N/A |
|
|
| N/A |
| ||
Rate of compensation increase | N/A |
|
|
| % |
| N/A |
|
|
| N/A |
| |
Expected return on assets | % |
|
| % |
| N/A |
|
|
| N/A |
| ||
For the Year Ended December 31, 2020 |
|
|
|
|
|
|
|
|
|
|
|
|
|
Discount rate | % |
|
| % |
| % |
|
| % | ||||
Interest crediting rate | % |
|
| %(b) |
| N/A |
|
|
| N/A |
| ||
Rate of compensation increase | N/A |
|
|
| % |
| N/A |
|
|
| % | ||
Expected return on assets | % |
|
| % |
| N/A |
|
|
| N/A |
| ||
For the Year Ended December 31, 2019 |
|
|
|
|
|
|
|
|
|
|
|
|
|
Discount rate | % |
|
| % |
| % |
|
| % | ||||
Interest crediting rate | % |
|
| %(b) |
| N/A |
|
|
| N/A |
| ||
Rate of compensation increase | N/A |
|
|
| % |
| N/A |
|
|
| % | ||
Expected return on assets | % |
|
| % |
| N/A |
|
|
| N/A |
| ||
(a) The non-U.S. plans reflect those assumptions that were most appropriate for the local economic environments of each of the subsidiaries providing such benefits.
(b) Represents the weighted average interest crediting rate of non-U.S. cash balance plans primarily in Japan and Switzerland.
AIG | 2021 Form 10-K 307
Discount Rate Methodology
The projected benefit cash flows under the U.S. AIG Retirement Plan were discounted using the spot rates derived from the Mercer U.S. Pension Discount Yield Curve (Mercer Yield Curve) at December 31, 2021 and 2020, which resulted in a single discount rate that would produce the same liability at the respective measurement dates. The discount rates were
In general, the discount rates for the non-U.S. plans were developed using a similar methodology to the U.S. AIG Retirement plan, by using country-specific Mercer Yield Curves.
The projected benefit obligation for AIG’s Japan pension plans represents approximately
Plan Assets
The investment strategy with respect to assets relating to our U.S. and non-U.S. pension plans is designed to achieve investment returns that will provide for the benefit obligations of the plans over the long term, limit the risk of short-term funding shortfalls and maintain liquidity sufficient to address cash needs. Accordingly, the asset allocation strategy is designed to maximize the investment rate of return while managing various risk factors, including, but not limited to, volatility relative to the benefit obligations, liquidity, and concentration, and incorporates the risk/return profile applicable to each asset class.
There were
U.S. Pension Plan
The assets of the qualified plan are monitored by the AIG U.S. Investment Committee and actively managed by the investment managers, which involves allocating the plan’s assets among approved asset classes within ranges as permitted by the strategic allocation. The long-term strategic asset allocation historically has been reviewed and revised approximately every three years. The investment strategy is focused on de-risking the qualified plan via regular monitoring through liability driven investing and the glide path approach, where the glide path defines the target allocation for the “Return-Seeking” portion of the portfolio (i.e., growth assets) based on the funded ratio and level of interest rates. Under this approach, the allocation to growth assets is reduced and the allocation to liability-hedging assets is increased as the plan’s funded ratio increases in accordance with the defined glide path.
The following table presents the asset allocation percentage by major asset class for the U.S. qualified plan and the target allocation for 2022 based on the plan’s funded status at December 31, 2021:
| Target |
| Actual |
| Actual |
|
At December 31, | 2022 |
| 2021 |
| 2020 |
|
Asset class: |
|
|
|
|
|
|
Equity securities | % | % | % | |||
Fixed maturity securities |
|
|
| |||
Other investments |
|
|
| |||
Total | % | % | % |
The expected weighted average long-term rate of return for the plan was
Non-U.S. Pension Plans
The assets of the non-U.S. pension plans are held in various trusts in multiple countries and are invested primarily in equities and fixed maturity securities to maximize the long-term return on assets for a given level of risk.
308 AIG | 2021 Form 10-K
The following table presents the asset allocation percentage by major asset class for non-U.S. pension plans and the target allocation:
| Target |
| Actual |
| Actual |
|
At December 31, | 2022 |
| 2021 |
| 2020 |
|
Asset class: |
|
|
|
|
|
|
Equity securities | % | % | % | |||
Fixed maturity securities |
|
|
| |||
Other investments |
|
|
| |||
Cash and cash equivalents |
|
|
| |||
Total | % | % | % |
The assets of AIG’s Japan pension plans represent approximately
The expected weighted average long-term rate of return for all our non-U.S. pension plans was
Assets Measured at Fair Value
The following table presents information about our plan assets and indicates the level of the fair value measurement based on the observability of the inputs used. The inputs and methodology used in determining the fair value of these assets are consistent with those used to measure our assets as discussed in Note 4 to the Consolidated Financial Statements.
| U.S. Plans |
| Non-U.S. Plans |
| ||||||||||||||
(in millions) | Level 1 | Level 2 | Level 3 | Total |
| Level 1 | Level 2 | Level 3 | Total |
| ||||||||
At December 31, 2021 |
|
|
|
|
|
|
|
|
|
|
|
|
|
|
|
|
|
|
Assets: |
|
|
|
|
|
|
|
|
|
|
|
|
|
|
|
|
|
|
Cash and cash equivalents | $ | $ | $ | $ |
| $ | $ | $ | $ |
| ||||||||
Equity securities: |
|
|
|
|
|
|
|
|
|
|
|
|
|
|
|
|
|
|
U.S.(a) |
|
|
|
|
|
|
|
|
|
| ||||||||
International(b) |
|
|
|
|
|
|
|
|
|
| ||||||||
Fixed maturity securities: |
|
|
|
|
|
|
|
|
|
|
|
|
|
|
|
|
|
|
U.S. investment grade(c) |
|
|
|
|
|
|
|
|
|
| ||||||||
International investment grade(c) |
|
|
|
|
|
|
|
|
|
| ||||||||
U.S. and international high yield(d) |
|
|
|
|
|
|
|
|
|
| ||||||||
Mortgage and other asset-backed |
|
|
|
|
|
|
|
|
|
|
|
|
|
|
|
|
|
|
securities |
|
|
|
|
|
|
|
|
|
| ||||||||
Other fixed maturity securities |
|
|
|
|
|
|
|
|
|
| ||||||||
Other investment types(e): |
|
|
|
|
|
|
|
|
|
|
|
|
|
|
|
|
|
|
Futures |
|
|
|
|
|
|
|
|
|
| ||||||||
Direct private equity(f) |
|
|
|
|
|
|
|
|
|
| ||||||||
Insurance contracts |
|
|
|
|
|
|
|
|
|
| ||||||||
Mutual funds(g) |
|
|
|
|
|
|
|
|
|
| ||||||||
Total | $ | $ | $ | $ |
| $ | $ | $ | $ |
| ||||||||
At December 31, 2020 |
|
|
|
|
|
|
|
|
|
|
|
|
|
|
|
|
|
|
Assets: |
|
|
|
|
|
|
|
|
|
|
|
|
|
|
|
|
|
|
Cash and cash equivalents | $ | $ | $ | $ |
| $ | $ | $ | $ |
| ||||||||
Equity securities: |
|
|
|
|
|
|
|
|
|
|
|
|
|
|
|
|
|
|
U.S.(a) |
|
|
|
|
|
|
|
|
|
| ||||||||
International(b) |
|
|
|
|
|
|
|
|
|
| ||||||||
Fixed maturity securities: |
|
|
|
|
|
|
|
|
|
|
|
|
|
|
|
|
|
|
U.S. investment grade(c) |
|
|
|
|
|
|
|
|
|
| ||||||||
International investment grade(c) |
|
|
|
|
|
|
|
|
|
| ||||||||
U.S. and international high yield(d) |
|
|
|
|
|
|
|
|
|
| ||||||||
AIG | 2021 Form 10-K 309
Mortgage and other asset-backed |
|
|
|
|
|
|
|
|
|
|
|
|
|
|
|
|
|
|
securities |
|
|
|
|
|
|
|
|
|
| ||||||||
Other investment types(e): |
|
|
|
|
|
|
|
|
|
|
|
|
|
|
|
|
|
|
Futures |
|
| ( |
|
| ( |
|
|
|
|
|
| ||||||
Direct private equity(f) |
|
|
|
|
|
|
|
|
|
| ||||||||
Insurance contracts |
|
|
|
|
|
|
|
|
|
| ||||||||
Mutual funds(g) |
|
|
|
|
|
|
|
|
|
| ||||||||
Total | $ | $ | $ | $ |
| $ | $ | $ | $ |
|
(a) Includes passive and active U.S. equity strategies.
(b) Includes passive and active international equity strategies.
(c) Includes investments in U.S. and non-U.S. government issued bonds, U.S. government agency or sponsored agency bonds, and investment grade corporate bonds.
(d) Consists primarily of investments in securities or debt obligations that have a rating below investment grade.
(e)
Excludes investments that are measured at fair value using the NAV per share (or its equivalent), which totaled $
(f) Comprised of private capital financing including private debt and private equity securities.
(g) Comprised of mutual fund investing in variety of equity, derivatives, and bonds.
The inputs or methodologies used for valuing securities are not necessarily an indication of the risk associated with investing in these securities. Based on our investment strategy, we had no significant concentrations of risks at December 31, 2021.
Changes in Level 3 Fair Value Measurements
The following table presents changes in our U.S. and non-U.S. Level 3 plan assets measured at fair value:
|
|
|
| Net |
|
|
|
|
|
|
|
|
|
|
|
|
|
|
| Changes in | Changes in Unrealized | |
|
|
|
| Realized |
|
|
|
|
|
|
|
|
|
|
|
|
|
|
| Unrealized | Gains (Losses) Included | |
|
|
|
| and |
|
|
|
|
|
|
|
|
|
|
|
|
|
| Gains (Losses) | in Other Comprehensive | ||
|
| Balance | Unrealized |
|
|
|
|
|
|
|
|
|
|
|
|
| Balance |
| on Instruments | Income (Loss) for Recurring | ||
At December 31, 2021 |
| Beginning |
| Gains |
|
|
|
|
|
|
|
|
| Transfers |
| Transfers |
| at End | Held at | Level 3 Instruments | ||
(in millions) |
| of Year |
| (Losses) |
| Purchases |
| Sales | Issuances | Settlements |
| In |
| Out |
| of Year |
| End of Year | Held at End of Year | |||
U.S. Plan Assets: |
|
|
|
|
|
|
|
|
|
|
|
|
|
|
|
|
|
|
|
|
|
|
Fixed maturity securities |
|
|
|
|
|
|
|
|
|
|
|
|
|
|
|
|
|
|
|
|
|
|
U.S. investment grade | $ | $ | $ | $ | ( | $ | $ | $ | $ | $ | $ | $ | ||||||||||
Mortgage and other |
|
|
|
|
|
|
|
|
|
|
|
|
|
|
|
|
|
|
|
|
|
|
asset-backed securities |
|
|
|
|
|
|
|
|
|
|
| |||||||||||
Direct private equity |
|
|
|
|
|
|
|
|
|
|
| |||||||||||
Total | $ | $ | $ | $ | ( | $ | $ | $ | $ | $ | $ | $ | ||||||||||
Non-U.S. Plan Assets: |
|
|
|
|
|
|
|
|
|
|
|
|
|
|
|
|
|
|
|
|
|
|
Insurance contracts | $ | $ | ( | $ | $ | $ | $ | $ | $ | $ | $ | $ | ||||||||||
Total | $ | $ | ( | $ | $ | $ | $ | $ | $ | $ | $ | $ | ||||||||||
|
|
|
|
|
|
|
|
|
|
|
|
|
|
|
|
|
|
|
|
|
|
|
|
|
|
| Net |
|
|
|
|
|
|
|
|
|
|
|
|
|
|
| Changes in | Changes in Unrealized | |
|
|
|
| Realized |
|
|
|
|
|
|
|
|
|
|
|
|
|
|
| Unrealized | Gains (Losses) Included | |
|
|
|
| and |
|
|
|
|
|
|
|
|
|
|
|
|
|
|
| Gains (Losses) | in Other Comprehensive | |
|
| Balance | Unrealized |
|
|
|
|
|
|
|
|
|
|
|
|
| Balance |
| on Instruments | Income (Loss) for Recurring | ||
At December 31, 2020 |
| Beginning |
| Gains |
|
|
|
|
|
|
|
|
| Transfers |
| Transfers |
| at End |
| Held at | Level 3 Instruments | |
(in millions) |
| of year |
| (Losses) |
| Purchases |
| Sales | Issuances | Settlements |
| In |
| Out |
| of year |
| End of year | Held at End of Year | |||
U.S. Plan Assets: |
|
|
|
|
|
|
|
|
|
|
|
|
|
|
|
|
|
|
|
|
|
|
Fixed maturity securities |
|
|
|
|
|
|
|
|
|
|
|
|
|
|
|
|
|
|
|
|
|
|
U.S. investment grade | $ | $ | $ | $ | $ | $ | $ | $ | $ | $ | $ | |||||||||||
Direct private equity |
|
| ( |
|
| ( |
|
|
|
|
|
| ( |
| ||||||||
Total | $ | $ | ( | $ | $ | ( | $ | $ | $ | $ | $ | $ | ( | $ | ||||||||
Non-U.S. Plan Assets: |
|
|
|
|
|
|
|
|
|
|
|
|
|
|
|
|
|
|
|
|
|
|
Insurance contracts | $ | $ | $ | $ | $ | $ | $ | $ | $ | $ | $ | |||||||||||
Total | $ | $ | $ | $ | $ | $ | $ | $ | $ | $ | $ | |||||||||||
310 AIG | 2021 Form 10-K
Expected Cash Flows
Funding for the qualified plan ranges from the minimum amount required by ERISA to the maximum amount that would be deductible for U.S. tax purposes. Contributed amounts in excess of the minimum amounts are deemed voluntary. Amounts in excess of the maximum amount would be subject to an excise tax and may not be deductible under the Internal Revenue Code. There are
Our annual pension contribution in 2022 is expected to be approximately $
The expected future benefit payments, net of participants’ contributions, with respect to the defined benefit pension plans and other postretirement benefit plans, are as follows:
|
| Pension |
| Postretirement | |||||
|
| U.S. |
| Non-U.S. |
|
| U.S. |
| Non-U.S. |
(in millions) |
| Plans |
| Plans |
|
| Plans |
| Plans |
2022 | $ | $ |
| $ | $ | ||||
2023 |
|
|
|
|
| ||||
2024 |
|
|
|
|
| ||||
2025 |
|
|
|
|
| ||||
2026 |
|
|
|
|
| ||||
2027-2031 |
|
|
|
|
| ||||
Defined Contribution Plans
We sponsor several defined contribution plans for U.S. employees that provide for pre-tax salary reduction contributions by employees. The most significant plan is the AIG Incentive Savings Plan, for which the matching contribution is
AIG | 2021 Form 10-K 311
21. Income Taxes
U.S. TAX LAW CHANGES
The IRS has continued to issue new guidance in relation to the Tax Cuts and Jobs Act (the Tax Act) enacted in 2017. Guidance has been issued covering provisions for Global Intangible Low-Taxed Income (GILTI) under which taxes are imposed on the excess of a deemed return on tangible assets of certain foreign subsidiaries, foreign tax credits by which the U.S. mitigates double taxation of foreign operations, and other elements of tax law. Changes to this guidance, and other provisions of tax law, are expected in future periods. Such guidance may result in changes to the interpretations and assumptions we made and actions we may take, which may impact amounts recorded with respect to international provisions of the Tax Act, possibly materially. Consistent with accounting guidance, we have made an accounting policy election to treat GILTI taxes as a period tax charge in the period the tax is incurred.
On March 27, 2020, the U.S. enacted the Coronavirus Aid, Relief, and Economic Security (CARES) Act to mitigate the economic impacts of the COVID-19 pandemic. The tax provisions of the CARES Act have not had and are currently not expected to have a material impact on AIG’s U.S. federal tax liabilities.
On November 15, 2021, the U.S. enacted the Infrastructure Investment and Jobs Act to improve infrastructure in the U.S. The tax provisions of the Infrastructure Investment and Jobs Act have not had and are currently not expected to have a material impact on AIG’s U.S. federal tax liabilities.
Reclassification of Certain Tax Effects from AOCI
We use an item-by-item approach to release the stranded or disproportionate income tax effects in AOCI related to our available-for-sale securities. Under this approach, a portion of the disproportionate tax effects is assigned to each individual security lot at the date the amount becomes lodged. When the individual securities are sold, mature, or are otherwise impaired on an other-than-temporary basis, the assigned portion of the disproportionate tax effect is reclassified from AOCI to income (loss) from continuing operations.
EFFECTIVE TAX RATE
The following table presents income (loss) from continuing operations before income tax expense (benefit) by U.S. and foreign location in which such pre-tax income (loss) was earned or incurred:
Years Ended December 31, |
|
|
|
|
|
|
(in millions) |
| 2021 |
| 2020 |
| 2019 |
U.S. | $ | $ | ( | $ | ||
Foreign |
|
|
| |||
Total | $ | $ | ( | $ |
Years Ended December 31, |
|
|
|
|
|
|
(in millions) |
| 2021 |
| 2020 |
| 2019 |
Foreign and U.S. components of actual income tax expense (benefit): |
|
|
|
|
|
|
U.S.: |
|
|
|
|
|
|
Current | $ | ( | $ | ( | $ | |
Deferred |
|
| ( |
| ||
Foreign: |
|
|
|
|
|
|
Current |
|
|
| |||
Deferred |
|
| ( |
| ( | |
Total | $ | $ | ( | $ |
312 AIG | 2021 Form 10-K
Years Ended December 31, | 2021 |
| 2020 |
| 2019 | ||||||||||||||||||
|
| Pre-Tax |
| Tax |
| Percent of |
|
|
| Pre-Tax |
| Tax |
| Percent of |
|
|
| Pre-Tax |
| Tax |
| Percent of |
|
|
| Income |
| Expense/ |
| Pre-Tax |
|
|
| Income |
| Expense/ |
| Pre-Tax |
|
|
| Income |
| Expense/ |
| Pre-Tax |
|
(dollars in millions) |
| (Loss) |
| (Benefit) |
| Income (Loss) |
|
|
| (Loss) |
| (Benefit) | Income (Loss) |
|
|
| (Loss) |
| (Benefit) | Income (Loss) |
| ||
U.S. federal income tax at statutory |
|
|
|
|
|
|
|
|
|
|
|
|
|
|
|
|
|
|
|
|
|
|
|
rate | $ | $ |
| % |
| $ | ( | $ | ( |
| % |
| $ | $ |
| % | |||||||
Adjustments: |
|
|
|
|
|
|
|
|
|
|
|
|
|
|
|
|
|
|
|
|
|
|
|
Tax exempt interest |
|
|
| ( |
| ( |
|
|
|
|
| ( |
|
|
|
|
|
| ( |
| ( |
| |
Uncertain tax positions* |
|
|
| ( |
| ( |
|
|
|
|
|
| ( |
|
|
|
|
|
|
| |||
Reclassifications from AOCI |
|
|
| ( |
| ( |
|
|
|
|
| ( |
|
|
|
|
|
| ( |
| ( |
| |
Dispositions of subsidiaries |
|
|
|
|
|
|
|
|
|
| ( |
|
|
|
|
|
|
| |||||
Non-controlling interest |
|
|
| ( |
| ( |
|
|
|
|
| ( |
|
|
|
|
|
| ( |
| ( |
| |
Non-deductible transfer pricing |
|
|
|
|
|
|
|
|
|
|
|
|
|
|
|
|
|
|
|
|
|
|
|
charges |
|
|
|
|
|
|
|
|
|
| ( |
|
|
|
|
|
|
| |||||
Dividends received deduction |
|
|
| ( |
| ( |
|
|
|
|
| ( |
|
|
|
|
|
| ( |
| ( |
| |
Effect of foreign operations |
|
|
|
|
|
|
|
|
|
| ( |
|
|
|
|
|
|
| |||||
Share-based compensation |
|
|
|
|
|
|
|
|
|
|
|
|
|
|
|
|
|
|
|
|
|
|
|
payments excess tax effect |
|
|
|
|
|
|
|
|
|
| ( |
|
|
|
|
|
|
| |||||
State income taxes |
|
|
|
|
|
|
|
|
|
| ( |
|
|
|
|
|
|
| |||||
Expiration of tax attribute |
|
|
|
|
|
|
|
|
|
|
|
|
|
|
|
|
|
|
|
|
|
|
|
carryforwards |
|
|
|
|
|
|
|
|
|
| ( |
|
|
|
|
|
|
| |||||
Tax audit resolution |
|
|
| ( |
| ( |
|
|
|
|
| ( |
|
|
|
|
|
|
|
| |||
Other* |
|
|
| ( |
| ( |
|
|
|
|
| ( |
|
|
|
|
|
| ( |
| ( |
| |
Effect of discontinued operations |
|
|
|
|
|
|
|
|
|
|
|
|
|
|
| ( |
| ( |
| ||||
Valuation allowance: |
|
|
|
|
|
|
|
|
|
|
|
|
|
|
|
|
|
|
|
|
|
|
|
Continuing operations |
|
|
|
|
|
|
|
|
| ( |
|
|
|
|
|
| ( |
| ( |
| |||
Consolidated total amounts |
|
|
|
|
|
| ( |
| ( |
|
|
|
|
|
|
| |||||||
Amounts attributable to discontinued |
|
|
|
|
|
|
|
|
|
|
|
|
|
|
|
|
|
|
|
|
|
|
|
operations |
|
|
|
|
|
|
|
|
|
|
|
|
|
| |||||||||
Amounts attributable to continuing |
|
|
|
|
|
|
|
|
|
|
|
|
|
|
|
|
|
|
|
|
|
|
|
operations | $ | $ |
| % |
| $ | ( | $ | ( |
| % |
| $ | $ |
| % | |||||||
For the year ended December 31, 2021, the effective tax rate on income (loss) from continuing operations was
For the year ended December 31, 2020, the effective tax rate on income (loss) from continuing operations was
AIG | 2021 Form 10-K 313
tax years 1991-2006. The impact of receiving the final settlement agreement resulted in a remeasurement of tax principal, penalties and interest based on agreed upon settlement amounts.
For the year ended December 31, 2019, the effective tax rate on income (loss) from continuing operations was
For the year ended December 31, 2021, we consider our foreign earnings with respect to certain operations in Canada, South Africa, Japan, Latin America, Bermuda as well as the European, Asia Pacific and Middle East regions to be indefinitely reinvested. These earnings relate to ongoing operations and have been reinvested in active business operations. While, following the enactment of the Tax Act, distributions from foreign affiliates are, generally, not subject to U.S. income tax, such distributions may be subject to non-U.S. withholding taxes. A deferred tax liability of approximately $
December 31, |
|
|
|
|
(in millions) |
| 2021 |
| 2020 |
Deferred tax assets: |
|
|
|
|
Losses and tax credit carryforwards | $ | $ | ||
Basis differences on investments |
|
| ||
Fortitude Re funds withheld embedded derivative |
|
| ||
Life policy reserves |
|
| ||
Accruals not currently deductible, and other |
|
| ||
Investments in foreign subsidiaries |
|
| ||
Loss reserve discount |
|
| ||
Loan loss and other reserves |
|
| ||
Unearned premium reserve reduction |
|
| ||
Fixed assets and intangible assets |
|
| ||
Other |
|
| ||
Employee benefits |
|
| ||
Total deferred tax assets |
|
| ||
Deferred tax liabilities: |
|
|
|
|
Investments in foreign subsidiaries |
| ( |
| |
Deferred policy acquisition costs |
| ( |
| ( |
Unrealized gains related to available for sale debt securities |
| ( |
| ( |
Other |
|
| ( | |
Total deferred tax liabilities |
| ( |
| ( |
Net deferred tax assets before valuation allowance |
|
| ||
Valuation allowance |
| ( |
| ( |
Net deferred tax assets (liabilities) | $ | $ |
314 AIG | 2021 Form 10-K
|
|
|
|
|
|
|
|
|
|
|
|
|
|
|
|
|
|
|
| Unlimited |
|
|
|
|
|
|
|
|
|
|
|
|
|
|
|
|
|
|
| Carryforward | |
|
|
|
|
|
|
|
|
|
|
|
|
|
|
|
|
|
|
|
| Period and |
December 31, 2021 |
|
|
|
|
|
|
|
|
|
|
|
|
|
|
|
|
|
| Carryforward | |
|
|
|
| Tax |
| Carryforward Period Ending Tax Year(b) |
|
| Periods(b) | |||||||||||
(in millions) |
| Gross |
| Effected |
|
| 2022 |
| 2023 |
| 2024 |
| 2025 |
| 2026 |
| 2027 |
| 2028 - After | |
Net operating loss carryforwards | $ | $ |
| $ | $ | $ | $ | $ | $ |
| $ | |||||||||
Capital loss carryforwards | $ |
|
|
|
|
|
|
|
|
|
| |||||||||
Foreign tax credit carryforwards |
|
|
|
|
|
|
|
|
|
|
|
| ||||||||
Other carryforwards |
|
|
|
|
|
|
|
|
|
|
|
| ||||||||
Total AIG U.S. consolidated federal income |
|
|
|
|
|
|
|
|
|
|
|
|
|
|
|
|
|
|
|
|
tax group tax losses and credits |
|
|
|
|
|
|
|
|
|
|
|
|
|
|
|
|
|
|
|
|
carryforwards on a U.S. GAAP basis(a) |
|
| $ |
| $ | $ | $ | $ | $ | $ |
| $ | ||||||||
Assessment of Deferred Tax Asset Valuation Allowance
The evaluation of the recoverability of our deferred tax asset and the need for a valuation allowance requires us to weigh all positive and negative evidence to reach a conclusion that it is more likely than not that all or some portion of the deferred tax asset will not be realized. The weight given to the evidence is commensurate with the extent to which it can be objectively verified. The more negative evidence that exists, the more positive evidence is necessary and the more difficult it is to support a conclusion that a valuation allowance is not needed.
Our framework for assessing the recoverability of the deferred tax asset requires us to consider all available evidence, including:
the nature, frequency, and amount of cumulative financial reporting income and losses in recent years;
the sustainability of recent operating profitability of our subsidiaries;
the predictability of future operating profitability of the character necessary to realize the net deferred tax asset, including forecasts of future income for each of our businesses and actual and planned business and operational changes;
the carryforward periods for the net operating loss, capital loss and foreign tax credit carryforwards, including the effect of reversing taxable temporary differences; and
prudent and feasible actions and tax planning strategies that would be implemented, if necessary, to protect against the loss of the deferred tax asset.
In performing our assessment of the recoverability of the deferred tax asset under this framework, we consider tax laws governing the utilization of the net operating loss, capital loss and foreign tax credit carryforwards in each applicable jurisdiction. Under U.S. tax law, a company generally must use its net operating loss carryforwards before it can use its foreign tax credit carryforwards, even though the carryforward period for the foreign tax credit is shorter than for the net operating loss. Our U.S. consolidated federal income tax group includes both life companies and non-life companies. While the U.S. taxable income of our non-life companies can be offset by our net operating loss carryforwards, only a portion (no more than 35 percent) of the U.S. taxable income of our life companies can be offset by those net operating loss carryforwards. The remaining tax liability of our life companies can be offset by the foreign tax credit carryforwards. Accordingly, we are able to utilize both the net operating loss and foreign tax credit carryforwards concurrently.
Recent events, including the impact of the recent completion of audit activity by the IRS, the COVID-19 pandemic, changes in target interest rates by the Board of Governors of the Federal Reserve System, and significant market volatility, continue to impact actual and projected results of our business operations as well as our views on potential effectiveness of certain prudent and feasible tax planning strategies. In order to demonstrate the predictability and sufficiency of future taxable income necessary to support the realizability of the net operating losses and foreign tax credit carryforwards, we have considered forecasts of future income for each of our businesses, including assumptions about future macro-economic and AIG-specific conditions and events, and any impact these conditions and events may have on our prudent and feasible tax planning strategies. We also subjected the forecasts to a variety of stresses of key assumptions and evaluated the effect on tax attribute utilization.
The carryforward period of our foreign tax credit carryforwards runs through 2023. Carryforward periods for our net operating losses extend from 2028 forward. However, utilization of a portion of our net operating losses is limited under separate return limitation year rules. During the first quarter of 2021, the recent completion of audit activity by the IRS and subsequent release of certain reserves for uncertain tax positions resulted in an initial recognition of additional net operating loss and foreign tax credit carryforwards arising in
AIG | 2021 Form 10-K 315
prior years. Taking into account this initial recognition of additional carryforwards as well as other events and our analysis of their potential impact on utilization of our tax attributes, for the three months ended March 31, 2021, we recorded an increase of $
As of December 31, 2021, the balance sheet reflects a valuation allowance of $
Estimates of future taxable income, including income generated from prudent and feasible actions and tax planning strategies, impact of settlements with taxing authorities, and any changes to interpretations and assumptions related to the impact of the Tax Act could change in the near term, perhaps materially, which may require us to consider any potential impact to our assessment of the recoverability of the deferred tax asset. Additionally, estimates of future taxable income, including prudent and feasible tax planning strategies, may be further impacted by market developments arising from the COVID-19 pandemic and uncertainty regarding its outcome. Such potential impact could be material to our consolidated financial condition or results of operations for an individual reporting period.
Further, the planned separation of the Life and Retirement business from AIG, if completed, would result in tax deconsolidation of these entities from the AIG Consolidated Federal Tax Group and potentially impact our ability to utilize certain tax loss and credit carryforwards. Such potential impact could result in valuation allowance being established with respect to such tax attributes in the reporting period in which tax deconsolidation occurs.
For the year ended December 31, 2021, recent changes in market conditions, including the COVID-19 pandemic and interest rate fluctuations, impacted the unrealized tax gains and losses in the available for sale securities portfolios of both our U.S. Life Insurance and non-life insurance companies, resulting in deferred tax liabilities related to net unrealized tax capital gains. As of December 31, 2021, based on all available evidence, we concluded that no valuation allowance is necessary related to our available for sale securities portfolios.
For the year ended December 31, 2021, we recognized a net $
The following table presents the net deferred tax assets (liabilities) at December 31, 2021 and 2020 on a U.S. GAAP basis:
December 31, |
|
|
|
|
| |
(in millions) |
|
|
| 2021 |
| 2020 |
Net U.S. consolidated return group deferred tax assets |
|
| $ | $ | ||
Net deferred tax assets (liabilities) in AOCI |
|
|
| ( |
| ( |
Valuation allowance |
|
|
| ( |
| ( |
Subtotal |
|
|
|
| ||
Net foreign, state and local deferred tax assets |
|
|
|
| ||
Valuation allowance |
|
|
| ( |
| ( |
Subtotal |
|
|
|
| ||
Subtotal - Net U.S., foreign, state and local deferred tax assets |
|
|
|
| ||
Net foreign, state and local deferred tax liabilities |
|
|
| ( |
| ( |
Total AIG net deferred tax assets (liabilities) |
|
| $ | $ | ||
Deferred Tax Asset of U.S. Consolidated FEDERAL Income Tax Group
At December 31, 2021 and 2020, our U.S. consolidated federal income tax group had net deferred tax assets after valuation allowance of $
316 AIG | 2021 Form 10-K
Deferred Tax ASSET – Foreign, State and Local
At December 31, 2021 and 2020, we had net deferred tax assets (liabilities) of $
At both December 31, 2021 and 2020, we had deferred tax asset valuation allowances of $
Tax Examinations and Litigation
We file a consolidated U.S. federal income tax return with our eligible U.S. subsidiaries. Income earned by subsidiaries operating outside the U.S. is taxed, and income tax expense is recorded, based on applicable U.S. and foreign laws.
We are currently under examination by the IRS for the tax years 2011 through 2013.
In September 2020, we received the IRS Revenue Agent Report containing agreed and disagreed issues for the audit of tax years 2007-2010. In October 2020, we filed a protest of the disagreed issues with the IRS Independent Office of Appeals (IRS Appeals). In March 2021, the IRS audit team issued their rebuttal to the protest of disagreed issues to IRS Appeals. We had an IRS Appeals conference in October 2021 and are continuing to engage in the Appeals process.
In 2009, after paying amounts due on a statutory notice of deficiency related to the disallowance of foreign tax credits associated with cross border financing transactions, we filed a refund lawsuit in the Southern District of New York (Southern District) with respect to tax year 1997. During the fourth quarter of 2020, the parties executed a binding settlement agreement with respect to the underlying issues in the lawsuit. On October 22, 2020, the Southern District dismissed the case based upon the settlement reached between AIG and the government. The parties continue to review the related interest calculations based on the settlement agreement, which will become due upon the IRS’ issuance of a Notice and Demand for Payment. During June 2021 and October 2021, AIG made additional payments of $
Accounting For Uncertainty in Income Taxes
The following table presents a reconciliation of the beginning and ending balances of the total amounts of gross unrecognized tax benefits:
Years Ended December 31, |
|
|
|
|
|
|
(in millions) |
| 2021 |
| 2020 |
| 2019 |
Gross unrecognized tax benefits, beginning of year | $ | $ | $ | |||
Increases in tax positions for prior years |
|
|
| |||
Decreases in tax positions for prior years |
| ( |
| ( |
| ( |
Increases in tax positions for current year |
|
|
| |||
Settlements |
| ( |
| ( |
| ( |
Gross unrecognized tax benefits, end of year | $ | $ | $ |
At December 31, 2021, 2020 and 2019, our unrecognized tax benefits, excluding interest and penalties, were $
At December 31, 2021, 2020 and 2019, our unrecognized tax benefits related to tax positions that, if recognized, would not affect the effective tax rate because they relate to such factors as the timing, rather than the permissibility, of the deduction were $
AIG | 2021 Form 10-K 317
Interest and penalties related to unrecognized tax benefits are recognized in income tax expense. At December 31, 2021, 2020, and 2019, we had accrued liabilities of $
We believe it is reasonably possible that our unrecognized tax benefits could decrease within the next 12 months by as much as $
Listed below are the tax years that remain subject to examination by major tax jurisdictions:
At December 31, 2021 | Open Tax Years |
Major Tax Jurisdiction |
|
United States | |
Australia | |
Canada | |
France | |
Japan | |
Korea | |
Singapore | |
United Kingdom |
22. Subsequent Events
DIVIDENDS DECLARED
On
REPURCHASE OF COMMON STOCK
Pursuant to an Exchange Act Rule 10b5-1 repurchase plan, from January 1, 2022 to February 15, 2022, we repurchased approximately
318 AIG | 2021 Form 10-K
Part II
ITEM 9 | Changes in and Disagreements with Accountants on Accounting and Financial Disclosure
None.
ITEM 9A | Controls and Procedures
EVALUATION OF DISCLOSURE CONTROLS AND PROCEDURES
Disclosure controls and procedures are designed to ensure that information required to be disclosed in reports filed or submitted under the Securities Exchange Act of 1934, as amended (the Exchange Act), is recorded, processed, summarized and reported within the time periods specified in SEC rules and forms and that such information is accumulated and communicated to management, including the Chief Executive Officer and Chief Financial Officer, to allow timely decisions regarding required disclosures. In connection with the preparation of this Annual Report on Form 10-K, an evaluation was carried out by AIG management, with the participation of AIG’s Chief Executive Officer and Chief Financial Officer, of the effectiveness of our disclosure controls and procedures (as defined in Rules 13a-15(e) and 15d-15(e) under the Exchange Act), as of December 31, 2021. Based on this evaluation, AIG’s Chief Executive Officer and Chief Financial Officer concluded that our disclosure controls and procedures were effective as of December 31, 2021.
Management’s Report on Internal Control Over Financial Reporting
Management of AIG is responsible for establishing and maintaining adequate internal control over financial reporting. AIG’s internal control over financial reporting is a process, under the supervision of AIG’s Chief Executive Officer and Chief Financial Officer, designed to provide reasonable assurance regarding the reliability of financial reporting and the preparation of AIG’s financial statements for external purposes in accordance with U.S. GAAP.
Because of its inherent limitations, internal control over financial reporting may not prevent or detect misstatements. Also, projections of any evaluation of effectiveness to future periods are subject to the risk that controls may become inadequate because of changes in conditions, or that the degree of compliance with the policies or procedures may deteriorate.
AIG management conducted an assessment of the effectiveness of our internal control over financial reporting as of December 31, 2021 based on the criteria established in the 2013 Internal Control – Integrated Framework issued by the Committee of Sponsoring Organizations of the Treadway Commission (COSO).
AIG management has concluded that, as of December 31, 2021, our internal control over financial reporting was effective based on the criteria articulated in the 2013 Internal Control – Integrated Framework issued by the COSO. The effectiveness of our internal control over financial reporting as of December 31, 2021 has been audited by PricewaterhouseCoopers LLP, an independent registered public accounting firm, as stated in their report, which is included in this Annual Report on Form 10-K.
Changes in Internal Control Over Financial Reporting
There have been no changes in our internal control over financial reporting that have occurred during the quarter ended December 31, 2021 that have materially affected, or are reasonably likely to materially affect, our internal control over financial reporting.
ITEM 9C | Disclosure Regarding Foreign Jurisdictions that Prevent Inspections
Not applicable.
AIG | 2021 Form 10-K 319
Part III
ITEM 10 | Directors, Executive Officers and Corporate Governance
All information required by Items 10, 11, 12, 13 and 14 of this Form 10-K is incorporated by reference from the definitive proxy statement for AIG’s 2022 Annual Meeting of Shareholders, which will be filed with the SEC not later than 120 days after the close of the fiscal year pursuant to Regulation 14A.
ITEM 11 | Executive Compensation
See Item 10 herein.
ITEM 12 | Security Ownership of Certain Beneficial Owners and Management and Related Stockholder Matters
See Item 10 herein.
ITEM 13 | Certain Relationships and Related Transactions, and Director Independence
See Item 10 herein.
ITEM 14 | Principal Accounting Fees and Services
See Item 10 herein.
Part IV
ITEM 15 | Exhibits, Financial Statement Schedules
(a) Financial Statements and Schedules. See accompanying Index to Financial Statements.
320 AIG | 2021 Form 10-K
Exhibit Index
Exhibit | Description | Location |
2 | Plan of acquisition, reorganization, arrangement, liquidation or succession |
|
| Incorporated by reference to Exhibit 2.1 to AIG’s Current Report on Form 8-K filed with the SEC on November 25, 2019 (File No. 1-8787). | |
| Incorporated by reference to Exhibit 10.3 to AIG’s Quarterly Report on Form 10-Q filed with the SEC on August 6, 2021 (File No. 1-8787). | |
| Incorporated by reference to Exhibit 10.4 to AIG’s Quarterly Report on Form 10-Q filed with the SEC on August 6, 2021 (File No. 1-8787). | |
3 | Articles of incorporation and by-laws |
|
3(i) | Amended and Restated Certificate of Incorporation of AIG, amended and restated May 14, 2020 | Incorporated by reference to Exhibit 3.1 to AIG’s Current Report on Form 8-K filed with the SEC on May 15, 2020 (File No. 1-8787). |
3(ii) | Incorporated by reference to Exhibit 3.1 to AIG’s Current Report on Form 8-K filed with the SEC on December 9, 2020 (File No. 1-8787). | |
4 | Instruments defining the rights of security holders, including indentures | Certain instruments defining the rights of holders of long-term debt securities of AIG and its subsidiaries are omitted pursuant to Item 601(b)(4)(iii) of Regulation S-K. AIG hereby undertakes to furnish to the Commission, upon request, copies of any such instruments. |
| Incorporated by reference to Exhibit 4.1 to AIG’s Current Report on Form 8-K filed with the SEC on March 9, 2011 (File No. 1-8787). | |
| Incorporated by reference to Exhibit 4.1 to AIG’s Current Report on Form 8-K filed with the SEC on January 8, 2014 (File No. 1-8787). | |
| Incorporated by reference to Exhibit 4.1 to AIG’s Current Report on Form 8-K filed with the SEC on December 14, 2016 (File No. 1-8787). | |
| Incorporated by reference to Exhibit 4.1 to AIG’s Current Report on Form 8-K filed with the SEC on December 11, 2019 (File No. 1-8787). | |
| Filed herewith. | |
| Incorporated by reference to Exhibit 4.2 to AIG’s Current Report on Form 8-K filed with the SEC on March 14, 2019 (File No. 1-8787). | |
| (7) Form of depositary receipt representing the Depository Shares (included in Exhibit A to Exhibit 4.7) |
|
| Incorporated by reference to Exhibit 4 to AIG’s Quarterly Report on Form 10-Q, filed with the SEC on August 6, 2021 (File No. 1-8787). |
AIG | 2021 Form 10-K 321
9 | Voting Trust Agreement | None. |
10 | Material contracts |
|
| (1) American International Group, Inc. 2010 Stock Incentive Plan* | Incorporated by reference to Appendix B in AIG’s Definitive Proxy Statement, dated April 12, 2010 (Filed No. 1-8787). |
| (2) AIG Amended Form of 2010 Stock Incentive Plan DSU Award Agreement* | Incorporated by reference to Exhibit 10.14 to AIG’s Quarterly Report on Form 10-Q for the quarter ended March 31, 2012 (File No. 1-8787). |
| (3) Letter Agreement, dated August 14, 2013, between AIG and Kevin Hogan* | Incorporated by reference to Exhibit 10.2 to AIG’s Quarterly Report on Form 10-Q for the quarter ended March 31, 2015 (File No. 1-8787). |
| (4) Non-Solicitation and Non-Disclosure Agreement, dated August 14, 2013, between AIG and Kevin Hogan* | Incorporated by reference to Exhibit 10.3 to AIG’s Quarterly Report on Form 10-Q for the quarter ended March 31, 2015 (File No. 1-8787). |
| (5) Executive Officer Form of Release and Restrictive Covenant Agreement* | Incorporated by reference to Exhibit 10.5 to AIG’s Quarterly Report on Form 10-Q for the quarter ended March 31, 2016 (File No. 1-8787). |
| Incorporated by reference to Exhibit 10.6 to AIG’s Quarterly Report on Form 10-Q for the quarter ended March 31, 2011 (File No. 1-8787). | |
| (7) AIG 2013 Long-Term Incentive Plan (as amended September 2015)* | Incorporated by reference to Exhibit 10.35 to AIG’s Annual Report on Form 10-K for the year ended December 31, 2015 (File No. 1-8787). |
| Incorporated by reference to Exhibit 10.5 to AIG’s Quarterly Report on Form 10-Q for the quarter ended March 31, 2015 (File No. 1-8787). | |
| Incorporated by reference to Exhibit 10.3 to AIG’s Current Report on Form 8-K filed with the SEC on March 27, 2013 (File No. 1-8787). | |
| (10) AIG Annual Short-Term Incentive Plan (as amended and restated effective March 1, 2016)* | Incorporated by reference to Exhibit 10.43 on AIG’s Annual Report on Form 10-K for the year ended December 31, 2016 (File No. 1-8787). |
| Incorporated by reference to Appendix B in AIG’s Definitive Proxy Statement on Schedule 14A, dated April 4, 2013 (File No. 1-8787). | |
| (12) Form of AIG 2013 Omnibus Incentive Plan Non-Employee Director DSU Award Agreement* | Incorporated by reference to Exhibit 10.52 to AIG’s Annual Report on Form 10-K for the year ended December 31, 2016 (File No. 1-8787). |
322 AIG | 2021 Form 10-K
| Incorporated by reference to Exhibit 10.1 to AIG's Current Report on Form 8-K filed with the SEC on February 14, 2017 (File No. 1-8787). | |
| Incorporated by reference to Exhibit 10.2 to AIG's Current Report on Form 8-K filed with the SEC on February 14, 2017 (File No. 1-8787). | |
| Incorporated by reference to Exhibit 10.3 to AIG's Current Report on Form 8-K filed with the SEC on February 14, 2017 (File No. 1-8787). | |
| (16) Form of AIG Long Term Incentive Award Agreement (as of March 2017)* | Incorporated by reference to Exhibit 10.2 to AIG’s Current Report on Form 8-K filed with the SEC on March 17, 2017 (File No. 1-8787). |
| (17) Letter Agreement, dated July 22, 2015, between AIG and Douglas A. Dachille* | Incorporated by reference to Exhibit 10.9 to AIG’s Quarterly Report on Form 10-Q for the quarter ended March 31, 2017 (File No. 1-8787). |
| Incorporated by reference to Exhibit 10.10 to AIG’s Quarterly Report on Form 10-Q for the quarter ended March 31, 2017 (File No. 1-8787). | |
| Incorporated by reference to Exhibit 10.2 to AIG’s Current Report on Form 8-K filed with the SEC on May 15, 2017 (File No. 1-8787). | |
| Incorporated by reference to Exhibit 10.1 to AIG’s Current Report on Form 8-K filed with the SEC on July 6, 2017 (File No. 1-8787). | |
| (21) Form of Stock Option Award Agreement, between American International Group, Inc. and Peter Zaffino* | Incorporated by reference to Exhibit 10.2 to AIG’s Current Report on Form 8-K filed with the SEC on July 6, 2017 (File No. 1-8787). |
| (22) Form of Long Term Incentive Stock Option Award Agreement* | Incorporated by reference to Exhibit 10.60 to AIG’s Annual Report on Form 10-K for the year ended December 31, 2017 (File No. 1-8787). |
| Incorporated by reference to Exhibit 10.2 to AIG’s Quarterly Report on Form 10-Q for the quarter ended March 31, 2018 (File No. 1-8787). | |
| Incorporated by reference to “Compensation of Directors” in AIG’s Definitive Proxy Statement on Schedule 14A, dated March 30, 2021 (File No. 1-8787). | |
| (25) Letter Agreement, dated May 10, 2018, between AIG and Mark Lyons* | Incorporated by reference to Exhibit 10.1 to AIG’s Current Report on Form 8-K/A, Amendment No. 1, filed with the SEC on December 14, 2018 (File No. 1-8787). |
| (26) Non-Solicitation and Non-Disclosure Agreement, dated May 13, 2018, between AIG and Mark Lyons* | Incorporated by reference to Exhibit 10.2 to AIG’s Current Report on Form 8-K/A, Amendment No. 1, filed with the SEC on December 14, 2018 (File No. 1-8787). |
| (27) Form of AIG Long Term Incentive Award Agreement (as of April 2019)* | Incorporated by reference to Exhibit 10.1 to AIG’s Quarterly Report on Form 10-Q, filed with the SEC on May 7, 2019 (File No. 1-8787). |
AIG | 2021 Form 10-K 323
| (28) Form of AIG Long Term Incentive Award Agreement (as of January 2020)* | Incorporated by reference to Exhibit 10.49 to AIG’s Annual Report on Form 10-K, filed with the SEC on February 21, 2020 (File No. 1-8787). |
| Incorporated by reference to Exhibit 10.1 to AIG’s Quarterly Report on Form 10-Q, filed with the SEC on August 4, 2020 (File No. 1-8787). | |
| (30) Amended and Restated Non-Qualified Pension Plan (as amended July 2020) | Incorporated by reference to Exhibit 10.2 to AIG’s Quarterly Report on Form 10-Q, filed with the SEC on August 4, 2020 (File No. 1-8787). |
| (31) AIG 2012 Executive Severance Plan (as amended and restated February 2021)* | Incorporated by reference to Exhibit 10.35 to AIG’s Annual Report on Form 10-K, filed with the SEC on February 19, 2021 (File No. 1-8787). |
| (32) AIG Long Term Incentive Plan (as amended and restated February 2021)* | Incorporated by reference to Exhibit 10.36 to AIG’s Annual Report on Form 10-K, filed with the SEC on February 19, 2021 (File No. 1-8787). |
| (33) AIG Non-Qualified Retirement Income Plan (as amended and restated February 2021)* | Incorporated by reference to Exhibit 10.37 to AIG’s Annual Report on Form 10-K, filed with the SEC on February 19, 2021 (File No. 1-8787). |
| (34) Letter Agreement, dated February 11, 2021, between AIG and Peter Zaffino* | Incorporated by reference to Exhibit 10.38 to AIG’s Annual Report on Form 10-K, filed with the SEC on February 19, 2021 (File No. 1-8787). |
| (35) Letter Agreement, dated February 11, 2021, between AIG and Brian Duperreault* | Incorporated by reference to Exhibit 10.39 to AIG’s Annual Report on Form 10-K, filed with the SEC on February 19, 2021 (File No. 1-8787). |
| (36) American International Group, Inc. 2021 Omnibus Incentive Plan | Incorporated by reference to Appendix B to AIG’s Definitive Proxy Statement filed with the Commission on March 30, 2021 (File No. 001-08787). |
| (37) AIG Long Term Incentive Plan (as amended and restated April 2021)* | Incorporated by reference to Exhibit 10.6 to AIG’s Quarterly Report on Form 10-Q, filed with the SEC on May 7, 2021 (File No. 1-8787). |
| (38) AIG Long Term Incentive Plan Form of Award Agreement (April 2021)* | Incorporated by reference to Exhibit 10.7 to AIG’s Quarterly Report on Form 10-Q, filed with the SEC on May 7, 2021 (File No. 1-8787). |
| (39) AIG Long Term Incentive Plan (as amended and restated September 2021)* | Incorporated by reference to Exhibit 10.3 to AIG’s Quarterly Report on Form 10-Q, filed with the SEC on November 5, 2021 (File No. 1-8787). |
| (40) AIG Long Term Incentive Plan Form of Award Agreement (September 2021)* | Incorporated by reference to Exhibit 10.4 to AIG’s Quarterly Report on Form 10-Q, filed with the SEC on November 5, 2021 (File No. 1-8787). |
| (41) Form of AIG 2021 Omnibus Incentive Plan Non-Employee Director DSU Award Agreement* | Filed herewith. |
| Incorporated by reference to Exhibit 10.1 to AIG’s Current Report on Form 8-K filed with the SEC on November 22, 2021 (File No. 1-8787). | |
| (43) Letter Agreement, dated December 7, 2021, between AIG and Shane Fitzsimons* | Incorporated by reference to Exhibit 10.1 to AIG’s Current Report on Form 8-K/A, Amendment No. 1, filed with the SEC on December 9, 2021 (File No. 1-8787). |
21 | Filed herewith. | |
22 | Guaranteed Securities | None. |
23 | Filed herewith. | |
24 | Included on signature page and filed herewith. |
324 AIG | 2021 Form 10-K
31 | Filed herewith. | |
32 | Filed herewith. | |
101 | Interactive data files pursuant to Rule 405 of Regulation S-T: (i) the Consolidated Balance Sheets as of December 31, 2021 and December 31, 2020, (ii) the Consolidated Statements of Income (Loss) for the three years ended December 31, 2021, (iii) the Consolidated Statements of Equity for the three years ended December 31, 2021, (iv) the Consolidated Statements of Cash Flows for the three years ended December 31, 2021, (v) the Consolidated Statements of Comprehensive Income (Loss) for the three years ended December 31, 2021 and (vi) the Notes to the Consolidated Financial Statements. | Filed herewith. |
* This exhibit is a management contract or a compensatory plan or arrangement.
** This information is furnished and not filed for purposes of Sections 11 and 12 of the Securities Act of 1933 and Section 18 of the Securities Exchange Act of 1934.
ITEM 16 | Form 10-K Summary
None.
AIG | 2021 Form 10-K 325
Signatures
Pursuant to the requirements of Section 13 or 15(d) of the Securities Exchange Act of 1934, as amended, the Registrant has duly caused this Annual Report on Form 10-K to be signed on its behalf by the undersigned, thereunto duly authorized, on the 17th of February, 2022.
| AMERICAN INTERNATIONAL GROUP, INC. | |
|
|
|
| By | /S/ PETER ZAFFINO |
|
| (Peter Zaffino, Chairman and Chief Executive Officer) |
KNOW ALL PERSONS BY THESE PRESENTS, that each person whose signature appears below constitutes and appoints Peter Zaffino and Shane Fitzsimons, and each of them severally, his or her true and lawful attorney-in-fact, with full power of substitution and resubstitution, to sign in his or her name, place and stead, in any and all capacities, to do any and all things and execute any and all instruments that such attorney may deem necessary or advisable under the Securities Exchange Act of 1934, as amended, and any rules, regulations and requirements of the U.S. Securities and Exchange Commission in connection with this Annual Report on Form 10-K and any and all amendments hereto, as fully for all intents and purposes as he or she might or could do in person, and hereby ratifies and confirms all said attorneys-in-fact and agents, each acting alone, and his or her substitute or substitutes, may lawfully do or cause to be done by virtue hereof.
Pursuant to the requirements of the Securities Exchange Act of 1934, as amended, this Annual Report on Form 10-K has been signed below by the following persons on behalf of the Registrant and in the capacities indicated on the 17th of February, 2022.
326 AIG | 2021 Form 10-K
SIGNATURE |
| TITLE |
/S/ PETER ZAFFINO |
| Chairman and Chief Executive Officer and Director |
(Peter Zaffino) |
| |
/S/ SHANE FITZSIMONS |
| Executive Vice President and Chief Financial Officer (Principal Financial Officer) |
(Shane Fitzsimons) |
| |
/S/ ELIAS F. HABAYEB |
| Senior Vice President, Chief Financial Officer, Life and Retirement and Chief Accounting Officer, AIG (Principal Accounting Officer) |
(Elias F. Habayeb) |
| |
/S/ JAMES COLE JR. |
| Director |
(James Cole Jr.) |
| |
/S/ W. DON CORNWELL |
| Director |
(W. Don Cornwell) |
| |
/S/ JOHN H. FITZPATRICK |
| Director |
(John H. Fitzpatrick) |
| |
/S/ WILLIAM G. JURGENSEN |
| Director |
(William G. Jurgensen) |
| |
/S/ CHRISTOPHER S. LYNCH |
| Director |
(Christopher S. Lynch) |
| |
/S/ LINDA A. MILLS |
| Director |
(Linda A. Mills) |
| |
/S/ THOMAS F. MOTAMED |
| Director |
(Thomas F. Motamed) |
| |
/S/ PETER R. PORRINO |
| Director |
(Peter R. Porrino) |
| |
/S/ AMY L. SCHIOLDAGER |
| Director |
(Amy L. Schioldager) |
| |
/S/ DOUGLAS M. STEENLAND |
| Director |
(Douglas M. Steenland) |
| |
/S/ THERESE M. VAUGHAN |
| Director |
(Therese M. Vaughan) |
|
AIG | 2021 Form 10-K 327
|
|
|
|
|
| Schedule I |
|
|
|
|
|
|
|
|
|
|
|
|
| Amount at |
At December 31, 2021 |
|
|
|
|
| which shown in |
(in millions) |
| Cost(a) |
| Fair Value |
| the Balance Sheet |
Fixed maturities: |
|
|
|
|
|
|
U.S. government and government sponsored entities | $ | $ | $ | |||
Obligations of states, municipalities and political subdivisions |
|
|
| |||
Non-U.S. governments |
|
|
| |||
Public utilities |
|
|
| |||
All other corporate debt securities |
|
|
| |||
Mortgage-backed, asset-backed and collateralized |
|
|
| |||
Total fixed maturity securities |
|
|
| |||
Equity securities and mutual funds: |
|
|
|
|
|
|
Common stock: |
|
|
|
|
|
|
Public utilities |
|
|
| |||
Banks, trust and insurance companies |
|
|
| |||
Industrial, miscellaneous and all other |
|
|
| |||
Total common stock |
|
|
| |||
Preferred stock |
|
|
| |||
Mutual funds |
|
|
| |||
Total equity securities and mutual funds |
|
|
| |||
Mortgage and other loans receivable, net of allowance |
|
|
| |||
Other invested assets |
|
|
| |||
Short-term investments, at cost (approximates fair value) |
|
|
| |||
Derivative assets(b) |
|
|
| |||
Total investments | $ | $ | $ |
(a) Original cost of fixed maturities is reduced by repayments and adjusted for amortization of premiums or accretion of discounts.
(b) The balance is reported in Other assets.
328 AIG | 2021 Form 10-K
Condensed Financial Information of Registrant
Balance Sheets – Parent Company Only
|
| Schedule II | ||
|
|
|
|
|
December 31, |
|
|
|
|
(in millions) |
| 2021 |
| 2020 |
Assets: |
|
|
|
|
Short-term investments | $ | $ | ||
Other investments |
|
| ||
Total investments |
|
| ||
Cash |
|
| ||
Loans to subsidiaries(a) |
|
| ||
Due from affiliates - net(a) |
|
| ||
Intercompany tax receivable(a) |
|
| ||
Deferred income taxes |
|
| ||
Investment in consolidated subsidiaries(a) |
|
| ||
Other assets(b) |
|
| ||
Total assets | $ | $ | ||
Liabilities: |
|
|
|
|
Due to affiliates(a) | $ | $ | ||
Intercompany tax payable(a) |
|
| ||
Notes and bonds payable |
|
| ||
Junior subordinated debt |
|
| ||
Series AIGFP matched notes and bonds payable |
|
| ||
Loans from subsidiaries(a) |
|
| ||
Other liabilities |
|
| ||
Total liabilities |
|
| ||
AIG Shareholders’ equity: |
|
|
|
|
Preferred stock |
|
| ||
Common stock |
|
| ||
Treasury stock |
| ( |
| ( |
Additional paid-in capital |
|
| ||
Retained earnings |
|
| ||
Accumulated other comprehensive income |
|
| ||
Total AIG shareholders’ equity |
|
| ||
Total liabilities and equity | $ | $ | ||
(a) Eliminated in consolidation.
(b)
At December 31, 2021 and 2020, included restricted cash of $
See accompanying Notes to Condensed Financial Information of Registrant.
AIG | 2021 Form 10-K 329
Condensed Financial Information of Registrant (Continued) |
|
|
|
|
|
|
Statements of Income – Parent Company Only |
|
|
|
|
|
|
|
|
|
|
|
|
|
|
|
|
| Schedule II | ||
|
|
|
|
|
|
|
Years Ended December 31, |
|
|
|
|
|
|
(in millions) |
| 2021 |
| 2020 |
| 2019 |
Revenues: |
|
|
|
|
|
|
Equity in undistributed net income (loss) of consolidated subsidiaries(a) | $ | ( | $ | ( | $ | |
Dividend income from consolidated subsidiaries(a) |
|
|
| |||
Interest income(b) |
|
|
| |||
Net realized losses |
| ( |
| ( |
| ( |
Other income (loss) |
| ( |
| ( |
| |
Expenses: |
|
|
|
|
|
|
Interest expense |
|
|
| |||
Net loss on extinguishment of debt |
|
|
| |||
Net (gain) loss on divestitures |
| ( |
|
| ||
Other expenses |
|
|
| |||
Income (loss) from continuing operations before income tax benefit |
|
| ( |
| ||
Income tax benefit |
| ( |
| ( |
| ( |
Net income (loss) |
|
| ( |
| ||
Loss from discontinued operations |
|
| ( |
| ( | |
Net income (loss) attributable to AIG Parent Company | $ | $ | ( | $ | ||
(b)
Includes interest income on intercompany borrowings of $
See accompanying Notes to Condensed Financial Information of Registrant.
Condensed Financial Information of Registrant (Continued) |
|
|
|
|
|
|
|
Statements of Comprehensive Income – Parent Company Only |
|
|
|
|
|
|
|
|
|
|
|
|
|
|
|
|
|
|
|
| Schedule II | ||
|
|
|
|
|
|
|
|
Years Ended December 31, |
|
|
|
|
|
|
|
(in millions) |
|
| 2021 |
| 2020 |
| 2019 |
Net income (loss) |
| $ | $ | ( | $ | ||
Other comprehensive income (loss) |
|
| ( |
|
| ||
Total comprehensive income attributable to AIG |
| $ | $ | $ | |||
|
|
|
|
|
|
|
|
See accompanying Notes to Condensed Financial Information of Registrant. | |||||||
330 AIG | 2021 Form 10-K
Condensed Financial Information of Registrant (Continued) |
|
|
|
|
|
|
Statements of Cash Flows – Parent Company Only |
|
|
|
|
|
|
|
|
|
|
|
|
|
|
|
|
| Schedule II | ||
|
|
|
|
|
|
|
Years Ended December 31, |
|
|
|
|
|
|
(in millions) |
| 2021 |
| 2020 |
| 2019 |
Net cash provided by (used in) operating activities | $ | $ | ( | $ | ||
Cash flows from investing activities: |
|
|
|
|
|
|
Sales and maturities of investments |
|
|
| |||
Sales of divested businesses |
|
|
| |||
Purchase of investments |
| ( |
| ( |
| ( |
Net change in short-term investments |
|
| ( |
| ( | |
Contributions from (to) subsidiaries - net |
|
| ( |
| ( | |
Loans to subsidiaries - net |
| ( |
| ( |
| |
Other, net |
| ( |
| ( |
| |
Net cash provided by (used in) investing activities |
|
| ( |
| ( | |
Cash flows from financing activities: |
|
|
|
|
|
|
Issuance of long-term debt |
|
|
| |||
Repayments of long-term debt |
| ( |
| ( |
| ( |
Issuance of preferred stock |
|
|
| |||
Cash dividends paid on preferred stock |
| ( |
| ( |
| ( |
Cash dividends paid on common stock |
| ( |
| ( |
| ( |
Loans from subsidiaries - net |
|
|
| |||
Purchase of common stock |
| ( |
| ( |
| |
Other, net |
|
| ( |
| ( | |
Net cash provided by (used in) financing activities |
| ( |
|
| ( | |
Change in cash and restricted cash |
|
| ( |
| ( | |
Cash and restricted cash at beginning of year |
|
|
| |||
Cash and restricted cash at end of year | $ | $ | $ | |||
|
|
|
|
|
|
|
Supplementary disclosure of cash flow information: |
|
|
|
|
|
|
| Years Ended December 31, | |||||
(in millions) |
| 2021 |
| 2020 |
| 2019 |
Cash | $ | $ | $ | |||
Restricted cash included in Short-term investments |
|
|
| |||
Restricted cash included in Other assets |
|
|
| |||
Total cash and restricted cash shown in Statements of Cash Flows – Parent Company Only | $ | $ | $ | |||
|
|
|
|
|
|
|
Cash (paid) received during the period for: |
|
|
|
|
|
|
Interest: |
|
|
|
|
|
|
Third party | $ | ( | $ | ( | $ | ( |
Intercompany |
|
|
| ( | ||
Taxes: |
|
|
|
|
|
|
Income tax authorities |
| ( |
| ( |
| ( |
Intercompany |
|
|
| |||
Intercompany non-cash financing and investing activities: |
|
|
|
|
|
|
Capital contributions |
|
|
| |||
Return of capital |
|
|
| |||
Dividend received in the form of intercompany note |
|
|
| |||
Dividends received in the form of securities |
|
|
| |||
|
|
|
|
|
|
|
See accompanying Notes to Condensed Financial Information of Registrant. | ||||||
AIG | 2021 Form 10-K 331
Notes to Condensed Financial Information of Registrant
American International Group, Inc.’s (the Registrant) investments in consolidated subsidiaries are stated at cost plus equity in undistributed income of consolidated subsidiaries. The accompanying condensed financial statements of the Registrant should be read in conjunction with the consolidated financial statements and notes thereto of American International Group, Inc. and subsidiaries included in the Registrant’s 2021 Annual Report on Form 10-K for the year ended December 31, 2021 (Annual Report on Form 10-K) filed with the Securities and Exchange Commission on February 17, 2022.
The Registrant includes in its Statement of Income dividends from its subsidiaries and equity in undistributed income (loss) of consolidated subsidiaries, which represents the net income (loss) of each of its wholly-owned subsidiaries.
The five-year debt maturity schedule is incorporated by reference from Note 14 to Consolidated Financial Statements.
The Registrant files a consolidated federal income tax return with certain subsidiaries and acts as an agent for the consolidated tax group when making payments to the Internal Revenue Service. The Registrant and its subsidiaries have adopted, pursuant to a written agreement, a method of allocating consolidated Federal income taxes. Amounts allocated to the subsidiaries under the written agreement are included in Due from affiliates in the accompanying Condensed Balance Sheets.
Income taxes in the accompanying Condensed Balance Sheets are composed of the Registrant’s current and deferred tax assets, the consolidated group’s current income tax receivable and deferred taxes related to tax attribute carryforwards of AIG’s U.S. consolidated federal income tax group.
For additional information see Note 21 to the Consolidated Financial Statements.
The consolidated U.S. deferred tax asset for net operating loss and tax credit carryforwards are recorded by the Parent Company, which files the consolidated U.S. Federal income tax return, and are not allocated to its subsidiaries. Generally, as, and if, the consolidated net operating losses and other tax attribute carryforwards are utilized, the intercompany tax balance will be settled with the subsidiaries.
332 AIG | 2021 Form 10-K
|
|
|
|
|
|
|
|
|
|
| Schedule III | |
|
|
|
|
|
|
|
|
|
|
|
|
|
At December 31, 2021 and 2020 | ||||||||||||
|
|
|
|
|
|
|
|
|
|
|
|
|
|
|
|
|
|
|
|
| Liability |
|
|
|
|
|
|
|
|
|
|
|
| for Unpaid |
|
|
|
|
|
|
|
|
|
|
|
| Losses and |
|
|
|
|
|
|
|
|
|
|
|
| Loss |
|
|
|
|
|
|
|
|
|
| Deferred |
| Adjustment |
|
|
| Policy |
|
|
|
|
|
| Policy |
| Expenses, |
|
|
| and |
|
|
|
|
|
| Acquisition |
| Future Policy |
| Unearned |
| Contract |
Segment (in millions) |
|
|
|
|
| Costs |
| Benefits |
| Premiums |
| Claims |
2021 |
|
|
|
|
|
|
|
|
|
|
|
|
General Insurance |
|
| $ | $ | $ | $ | ||||||
Life and Retirement |
|
|
|
|
|
|
|
| ||||
Other Operations(a) |
|
|
|
|
|
|
|
| ||||
|
|
|
|
| $ | $ | $ | $ | ||||
2020 |
|
|
|
|
|
|
|
|
|
|
|
|
General Insurance |
|
| $ | $ | $ | $ | ||||||
Life and Retirement |
|
|
|
|
|
|
|
| ||||
Other Operations(a) |
|
|
|
|
|
|
|
| ||||
|
|
|
|
| $ | $ | $ | $ | ||||
|
|
|
|
|
|
|
|
|
|
|
|
|
|
|
|
|
|
|
|
|
|
|
|
|
|
For the years ended December 31, 2021, 2020 and 2019 |
|
|
|
|
|
| ||||||
|
|
|
|
|
|
|
|
|
|
|
|
|
|
|
|
|
|
| Losses |
| Amortization |
|
|
|
|
|
| Premiums |
|
|
| and Loss |
| of Deferred |
|
|
|
|
|
| and |
| Net |
| Expenses |
| Policy |
| Other |
| Net |
|
| Policy |
| Investment |
| Incurred, |
| Acquisition |
| Operating |
| Premiums |
Segment (in millions) |
| Fees |
| Income |
| Benefits |
| Costs |
| Expenses |
| Written(b) |
2021 |
|
|
|
|
|
|
|
|
|
|
|
|
General Insurance | $ | $ | $ | $ | $ | $ | ||||||
Life and Retirement |
|
|
|
|
|
| ||||||
Other Operations(a) |
|
|
| ( |
|
|
| |||||
| $ | $ | $ | $ | $ | $ | ||||||
2020 |
|
|
|
|
|
|
|
|
|
|
|
|
General Insurance | $ | $ | $ | $ | $ | $ | ||||||
Life and Retirement |
|
|
|
|
|
| ||||||
Other Operations(a) |
|
|
|
|
|
| ||||||
| $ | $ | $ | $ | $ | $ | ||||||
2019 |
|
|
|
|
|
|
|
|
|
|
|
|
General Insurance | $ | $ | $ | $ | $ | $ | ||||||
Life and Retirement |
|
|
|
|
|
| ||||||
Other Operations(a) |
|
|
|
|
|
| ||||||
| $ | $ | $ | $ | $ | $ | ||||||
(a) Includes consolidation and elimination entries and reconciling items from adjusted pre-tax income to pre-tax income. See Note 3 to the Consolidated Financial Statements.
(b) Balances reflect the segment changes discussed in Note 3 to the Consolidated Financial Statements.
AIG | 2021 Form 10-K 333
|
|
|
|
|
|
|
|
|
| Schedule IV | |
|
|
|
|
|
|
|
|
|
|
|
|
At December 31, 2021, 2020 and 2019 and for the years then ended | |||||||||||
|
|
|
|
|
|
|
|
|
|
|
|
|
|
|
|
|
|
|
|
|
| Percent of |
|
|
|
|
| Ceded to |
| Assumed |
|
|
| Amount |
|
|
| Gross |
| Other |
| from Other |
|
|
| Assumed |
|
(in millions) |
| Amount |
| Companies |
| Companies |
| Net Amount |
| to Net |
|
2021 |
|
|
|
|
|
|
|
|
|
|
|
Long-duration insurance in force | $ | $ | $ | $ |
| % | |||||
Premiums Earned: |
|
|
|
|
|
|
|
|
|
|
|
General Insurance companies | $ | $ | $ | $ |
| % | |||||
Life and Retirement companies |
|
|
|
|
|
| |||||
Total | $ | $ | $ | $ |
| % | |||||
2020 |
|
|
|
|
|
|
|
|
|
|
|
Long-duration insurance in force* | $ | $ | $ | $ |
| % | |||||
Premiums Earned: |
|
|
|
|
|
|
|
|
|
|
|
General Insurance companies | $ | $ | $ | $ |
| % | |||||
Life and Retirement companies |
|
|
|
|
|
| |||||
Total | $ | $ | $ | $ |
| % | |||||
2019 |
|
|
|
|
|
|
|
|
|
|
|
Long-duration insurance in force | $ | $ | $ | $ |
| % | |||||
Premiums Earned: |
|
|
|
|
|
|
|
|
|
|
|
General Insurance companies | $ | $ | $ | $ |
| % | |||||
Life and Retirement companies |
|
|
|
|
|
| |||||
Total | $ | $ | $ | $ |
| % | |||||
334 AIG | 2021 Form 10-K
|
|
|
|
|
|
|
|
|
|
|
| Schedule V | ||
|
|
|
|
|
|
|
|
|
|
|
|
|
|
|
For the years ended December 31, 2021, 2020 and 2019 |
|
|
|
|
|
| ||||||||
|
|
|
|
|
|
|
|
|
|
|
|
|
|
|
|
|
|
| Initial |
|
|
|
|
|
|
|
|
|
|
|
| Balance, | Allowance |
| Charged to |
|
|
|
|
|
|
|
| |
|
| Beginning | Upon CECL |
| Costs and |
|
|
|
|
| Other |
| Balance, | |
(in millions) |
| of year | Adoption |
| Expenses |
| Charge Offs |
| Divestitures |
| Changes* |
| End of year | |
2021 |
|
|
|
|
|
|
|
|
|
|
|
|
|
|
Allowance for mortgage and |
|
|
|
|
|
|
|
|
|
|
|
|
|
|
other loans receivable | $ | $ | $ | ( | $ | ( | $ | ( | $ | $ | ||||
Allowance for premiums and |
|
|
|
|
|
|
|
|
|
|
|
|
|
|
insurances balances receivable |
|
|
| ( |
| ( |
|
| ( |
| ||||
Allowance for reinsurance assets |
|
|
|
| ( |
|
|
| ||||||
Federal and foreign valuation |
|
|
|
|
|
|
|
|
|
|
|
|
|
|
allowance for deferred tax assets |
|
|
|
|
|
| ( |
| ||||||
2020 |
|
|
|
|
|
|
|
|
|
|
|
|
|
|
Allowance for mortgage and |
|
|
|
|
|
|
|
|
|
|
|
|
|
|
other loans receivable | $ | $ | $ | $ | ( | $ | $ | $ | ||||||
Allowance for premiums and |
|
|
|
|
|
|
|
|
|
|
|
|
|
|
insurances balances receivable |
|
|
|
| ( |
|
| ( |
| |||||
Allowance for reinsurance assets |
|
|
|
| ( |
|
|
| ||||||
Federal and foreign valuation |
|
|
|
|
|
|
|
|
|
|
|
|
|
|
allowance for deferred tax assets |
|
|
| ( |
|
|
| ( |
| |||||
2019 |
|
|
|
|
|
|
|
|
|
|
|
|
|
|
Allowance for mortgage and |
|
|
|
|
|
|
|
|
|
|
|
|
|
|
other loans receivable | $ | $ | $ | $ | ( | $ | $ | $ | ||||||
Allowance for premiums and |
|
|
|
|
|
|
|
|
|
|
|
|
|
|
insurances balances receivable |
|
|
| ( |
| ( |
|
|
| |||||
Allowance for reinsurance assets |
|
|
|
| ( |
|
|
| ||||||
Federal and foreign valuation |
|
|
|
|
|
|
|
|
|
|
|
|
|
|
allowance for deferred tax assets |
|
|
| ( |
|
|
| ( |
| |||||
AIG | 2021 Form 10-K 335
Exhibit 4.5
American International Group, Inc.
Description of Registrant’s Securities
As of December 31, 2021, AIG had the following classes of securities registered under Section 12 of the Securities Exchange Act of 1934 (the “Exchange Act”): (i) our common stock; (ii) stock purchase rights; (iii) depositary shares (the “Depositary Shares”), each representing a 1/1,000th interest in a share of 5.85% non-cumulative perpetual preferred stock, Series A (the “Series A Preferred Stock”); and (iv) 5.75% Series A-2 Junior Subordinated Debentures and 4.875% Series A-3 Junior Subordinated Debentures. All of our registered securities are listed on the New York Stock Exchange.
I. Common Stock, Par Value $2.50 Per Share
The following description of the Company’s common stock and the relevant provisions of the Company’s amended and restated certificate of incorporation and amended and restated bylaws are summaries and are qualified in their entirety by reference to the Company’s amended and restated certificate of incorporation and amended and restated bylaws.
General
Under our amended and restated certificate of incorporation, we are authorized to issue 5,000,000,000 shares of common stock a par value of $2.50 per share. All of the outstanding shares of our common stock are fully paid and nonassessable.
Dividends
Subject to the prior rights of the holders of shares of preferred stock that may be issued and outstanding, the holders of common stock are entitled to receive dividends when, as and if declared by our board of directors out of funds legally available for the payment of dividends.
Ranking
Subject to the prior rights of the holders of shares of preferred stock that may be issued and outstanding, in the event of dissolution of AIG, the holders of common stock are entitled to share ratably in all assets legally available for distribution to our stockholders.
Voting Rights
Each holder of common stock is entitled to one vote for each share held of record on all matters presented to a vote at a shareholders meeting, including the election of directors (except for preferred stock directors, as defined below under “Description of Preferred Stock-Voting Rights-Right to Elect Two Directors on Nonpayment of Dividends”). Holders of common stock have no cumulative voting rights or preemptive rights to purchase or subscribe for any additional shares of common stock or other securities, and there are no conversion rights or redemption or sinking fund provisions with respect to the common stock. Authorized but unissued shares of common stock may be issued without shareholder approval, subject to NYSE listing rules.
Certification
AIG has adopted direct company registration of its common stock. Holders of shares of common stock will not receive stock certificates evidencing their share ownership. Instead, they are provided with a statement reflecting the number of shares registered in their accounts.
The transfer agent for our common stock is Equiniti Trust Company, as successor to Wells Fargo Shareowner Services, a former division of Wells Fargo Bank, N.A.
II. Stock Purchase Rights
Our board of directors adopted our Tax Asset Protection Plan on March 9, 2011 and amendments thereto on January 8, 2014, December 14, 2016 and December 11, 2019, all of which were ratified by our shareholders at our annual meetings of shareholders for 2011, 2014, 2017 and 2020, respectively (as so amended, the “Tax Asset Protection Plan”). Subject to certain limited exceptions, the Tax Asset Protection Plan is intended to act as a deterrent to any person or group acquiring 4.99 percent or more of our outstanding common stock (an “Acquiring Person”) without the approval of our board of directors. Our board of directors may, in its sole discretion, exempt any person or group from being deemed an Acquiring Person for purposes of the Tax Asset Protection Plan with respect to which it receives, at its request, a report from our advisors to the effect that such exemption would not create a significant risk of material adverse tax consequences to us, or our board of directors otherwise determines it is in our best interests. The following is a summary of the Tax Asset Protection Plan and does not purport to be complete. It is qualified in its entirety by reference to the Tax Asset Protection Plan, which we encourage you to read for additional information.
The Rights
In connection with the initial adoption of the Tax Asset Protection Plan, our board of directors previously issued a dividend of one right per each outstanding share of our common stock payable to our shareholders of record as of the close of business on March 18, 2011 and to holders of AIG common stock issued after that date. Subject to the terms, provisions and conditions of the Tax Asset Protection Plan, if these rights become exercisable, each right would initially represent the right to purchase from us one ten-thousandth of a share of our Participating Preferred Stock, par value $5.00 per share (the “Participating Preferred Stock”), for a purchase price of $185.00 per right (the “Exercise Price”). If issued, each one ten-thousandth of a share of Participating Preferred Stock would generally give a shareholder approximately the same dividend, voting and liquidation rights as does one share of our common stock. However, prior to exercise, a right does not give its holder any rights as a shareholder, including without limitation any dividend, voting or liquidation rights.
Exercisability
The rights are not exercisable until the earlier of (i) a public announcement by us that a person or group has become an Acquiring Person (the date of such public announcement is referred to herein as the “Stock Acquisition Date”) and (ii) 10 business days after the commencement of a tender or exchange offer by a person or group if upon consummation of the offer the person or group would Beneficially Own 4.99 percent or more of our outstanding common stock. We refer to the date on which the rights become exercisable as the “Separation Time”.
Until the Separation Time, our common stock certificates (or the registration of uncertificated shares on our stock transfer books) will evidence the rights and may contain a notation to that effect. Any transfer of shares of our common stock prior to the Separation Time will constitute a transfer of the associated rights. After the Separation Time, the rights may be transferred other than in connection with the transfer of the underlying shares of our common stock.
If there is an Acquiring Person on the Separation Time or a person or group becomes an Acquiring Person after the Separation Time, each holder of a right, other than rights that are or were Beneficially Owned by an Acquiring Person (which will be void), will thereafter have the right to receive upon exercise of a right and payment of the Exercise Price that number of shares of our common stock (or, at AIG’s election, Participating Preferred Stock) having a market value of two times the exercise price of the right.
Exchange
At any time after the Stock Acquisition Date, provided the Acquiring Person does not hold 50 percent or more of the outstanding common stock, our board of directors may exchange the rights, other than rights that are or were Beneficially Owned by an Acquiring Person (which will be void), in whole or in part, at an exchange ratio equal to one share of our common stock (or one ten-thousandth of a share of Participating Preferred Stock) per right.
Redemption
At any time until the Stock Acquisition Date, the board of directors may redeem all of the then-outstanding rights in whole, but not in part, at a price of $0.001 per right, subject to adjustment (the “Redemption Price”). Immediately upon action of the board of directors ordering redemption of the rights, the right to exercise the rights will terminate, and the only right of the holders of rights will be to receive the Redemption Price.
Anti-Dilution Provisions
The Exercise Price and the number of outstanding rights are subject to anti-dilution adjustment under the following circumstances: (i) we declare or pay a dividend on common stock payable in common stock, (ii) we subdivide the outstanding common stock (iii) we combine the outstanding common stock into a smaller number of shares of common stock, or (iv) we issue or distribute any securities or assets in respect of, in lieu of or in exchange for common stock (other than pursuant to any non-extraordinary periodic cash dividend or a dividend paid solely in common stock) whether by dividend, in a reclassification or recapitalization.
Amendments
Any of the provisions of the Tax Asset Protection Plan may be amended by our board of directors at any time and in any manner.
Expiration
The rights issued pursuant to the Tax Asset Protection Plan will expire on the earliest of (i) the close of business on December 11, 2022, provided that the board of directors may determine to extend the Tax Asset Protection Plan prior to such date as long as the extension is submitted to our stockholders for ratification at the next succeeding annual meeting, (ii) the time at which the rights are redeemed, (iii) the time at which the rights are exchanged and (iv) the time at which our board of directors receives, at its request, a report from our advisors that the Tax Attributes (as defined in the Tax Asset Protection Plan) are utilized in all material respects or no longer available in any material aspect or that an ownership change under Section 382 or any applicable state law would not adversely impact in any material respect the time period in which we could use the Tax Attributes, or materially impair the amount of the Tax Attributes that could be used.
III. Depositary Shares (each representing a 1/1000th interest in a share of Series A 5.85% Non-Cumulative Perpetual Preferred Stock)
The following description of our Series A 5.85% Non-Cumulative Perpetual Preferred Stock (“Series A Preferred Stock”) and the Depositary Shares (each representing a 1/1000th interest in a share of Series A Preferred Stock, the “Depositary Shares”) is a summary and does not purport to be complete. It is qualified in its entirety by reference to the Company’s amended and restated certificate of incorporation and amended and restated bylaws and the certificate of designations with respect to the Series A Preferred Stock.
Description of the Preferred Stock
General
Under our amended and restated certificate of incorporation, we have authority to issue up to 100,000,000 shares of serial preferred stock, par value $5.00 per share. Our board of directors (or a duly authorized committee of the board) is authorized without further stockholder action to cause the issuance of shares of preferred stock, including the Series A Preferred Stock.
Any additional preferred stock may be issued from time to time in one or more series, each with such voting powers, such designations, preferences and relative, participating, optional or other special rights, and qualifications, limitations or restrictions thereof, as our board (or a duly authorized committee of the board) may determine prior to the time of issuance. We have the right to create and issue additional classes or series of stock ranking equally with or junior to the Series A Preferred Stock as to dividends and distribution of assets upon our liquidation, dissolution, or winding up without the consent of the holders of the Series A Preferred Stock, or the holders of the related Depositary Shares
The Series A Preferred Stock represents a single series of our authorized preferred stock. Shares of Series A Preferred Stock are fully paid and nonassessable.
The Series A Preferred Stock do not have any preemptive rights and is not convertible into, or exchangeable for, property or shares of our common stock or any other class or series of our other securities and is not subject to any sinking fund or any other obligation of us for their repurchase or retirement.
The number of authorized shares of the Series A Preferred Stock initially was 20,000 and the “stated amount” per share is $25,000. The number of authorized shares may from time to time be increased (but not in excess of the total number of authorized shares of preferred stock, excluding shares of any other series of preferred stock authorized at the time of such increase) or decreased (but not below the number of shares of Series A Preferred Stock then outstanding) by resolution of the board (or a duly authorized committee of the board), without the vote or consent of the holders of the Series A Preferred Stock. Shares of Series A Preferred Stock that are redeemed, purchased or otherwise acquired by us will be cancelled and will revert to authorized but unissued shares of preferred stock undesignated as to series.
Ranking
With respect to the payment of dividends and distributions of assets upon any liquidation, dissolution or winding up, the Series A Preferred Stock ranks:
| • | senior to our common stock and any class or series of our stock that ranks junior to the Series A Preferred Stock in the payment of dividends or in the distribution of assets upon our voluntary or involuntary liquidation, dissolution or winding up (for purposes of this section, together with our common stock, “junior stock”); |
| • | senior to or on a parity with each other series of our preferred stock we may issue (except for any senior series that may be issued upon the requisite vote or consent of the holders of at least two thirds of the shares of the Series A Preferred Stock at the time outstanding and entitled to vote, voting together with any other series of preferred stock that would be adversely affected by such issuance substantially in the same manner and entitled to vote as a single class in proportion to their respective stated amounts) with respect to the payment of dividends and distributions of assets upon any voluntary or involuntary liquidation, dissolution or winding up of AIG; and |
| • | junior to all existing and future indebtedness and other non-equity claims on us. |
Dividends
Holders of the Series A Preferred Stock are entitled to receive, when, as and if declared by our board (or a duly authorized committee of the board), but only out of funds legally available therefor, noncumulative cash dividends at the annual rate of 5.85% of the stated amount per share, and no more, payable quarterly in arrears on the fifteenth day of March, June, September and December, respectively, in each year (for purposes of this section, each, a “dividend payment date”), with respect to the dividend period (or portion thereof) ending on the day preceding such respective dividend payment date, to holders of record on the 15th calendar day before such dividend payment date or such other record date not more than 30 nor less than 10 days preceding such dividend payment date fixed for that purpose by our board (or a duly authorized committee of the board) in advance of payment of each particular dividend. The amount of the dividend per share of the Series A Preferred Stock for each dividend period (or portion thereof) is calculated on the basis of a 360-day year consisting of twelve 30-day months. If any dividend payment date is not a business day, the applicable dividend will be paid on the first business day following that day without adjustment. We will not pay interest or any sum of money instead of interest on any dividend payment that may be in arrears on the Series A Preferred Stock.
For purposes of this section, “dividend period” means each period commencing on (and including) a dividend payment date and continuing to (but not including) the next succeeding dividend payment date.
For purposes of this section, a “business day” means each Monday, Tuesday, Wednesday, Thursday or Friday on which banking institutions in The City of New York are not authorized or obligated by law, regulation or executive order to close.
Dividends on shares of the Series A Preferred Stock are not cumulative and are not mandatory. If our board (or a duly authorized committee of the board) does not declare a dividend on the Series A Preferred Stock in respect of a dividend period, then holders of the Series A Preferred Stock will not be entitled to receive any dividends not declared by the board (or a duly authorized committee of the board) and no interest, or sum of money in lieu of interest, will be payable in respect of any dividend not so declared, whether or not our board (or a duly authorized committee of the board) declares a dividend on the Series A Preferred Stock or any other series of our preferred stock or on our common stock for any future dividend period.
Restrictions on Dividends, Redemption and Repurchases
So long as any share of the Series A Preferred Stock remains outstanding, unless dividends on all outstanding shares of the Series A Preferred Stock for the most recently completed dividend period have been paid in full or declared and a sum sufficient for the payment thereof has been set aside for payment, no dividend may be declared or paid or set aside for payment, and no distribution may be made, on any junior stock, including our common stock, other than a dividend payable solely in stock that ranks junior to the Series A Preferred Stock in the payment of dividends and in the distribution of assets on any liquidation, dissolution or winding up of AIG.
If our board (or a duly authorized committee of the board) elects to declare only partial instead of full dividends for a dividend payment date and related dividend period on the shares of Series A Preferred Stock or any class or series of our stock that ranks on a parity with the Series A Preferred Stock in the payment of current dividends (“dividend parity stock”), then to the extent permitted by the terms of the Series A Preferred Stock and each outstanding series of dividend parity stock such partial dividends will be declared on shares of the Series A Preferred Stock and dividend parity stock, and dividends so declared will be paid, as to any such dividend payment date and related dividend period in amounts such that the ratio of the partial dividends declared and paid on each such series to full dividends on each such series is the same. As used in this paragraph, “full dividends” means, as to any dividend parity stock that bears dividends on a cumulative basis, the amount of dividends that would need to be declared and paid to bring such dividend parity stock current in dividends, including undeclared dividends for past dividend periods. To the extent a dividend period with respect to the Series A Preferred Stock or any series of dividend parity stock (in either case, the “first series”) coincides with more than one dividend period with respect to another series as applicable (in either case, a “second series”), for purposes of the immediately preceding sentence, our board (or a duly authorized committee of the board) may, to the extent permitted by the terms of each affected series, treat such dividend period for the first series as two or more consecutive dividend periods, none of which coincides with more than one dividend period with respect to the second series, or may treat such dividend period(s) with respect to any dividend parity stock and dividend period(s) with respect to the Series A Preferred Stock for purposes of the immediately preceding sentence in any other manner that it deems to be fair and equitable in order to achieve ratable payments of dividends on such dividend parity stock and the Series A Preferred Stock.
Subject to the foregoing, and not otherwise, such dividends (payable in cash, stock or otherwise) as may be determined by our board (or a duly authorized committee of the board) may be declared and paid on any common stock or junior stock from time to time out of any funds legally available therefor, and the shares of Series A Preferred Stock will not be entitled to participate in any such dividend.
So long as any share of the Series A Preferred Stock remains outstanding, unless dividends on all outstanding shares of the Series A Preferred Stock for the most recently completed dividend period have been paid in full or declared and a sum sufficient for the payment thereof has been set aside for payment, no monies may be paid or made available for a sinking fund for the redemption or retirement of junior stock, nor will any shares of junior stock be purchased, redeemed or otherwise acquired for consideration by us, directly or indirectly, other than:
| • | as a result of (x) a reclassification of junior stock, or (y) the exchange or conversion of one share of junior stock for or into another share of stock that ranks junior to the Series A Preferred Stock in the payment of dividends and in the distribution of assets on any liquidation, dissolution or winding up of AIG; or |
| • | through the use of the proceeds of a substantially contemporaneous sale of other shares of stock that ranks junior to the Series A Preferred Stock in the payment of dividends and in the distribution of assets on any liquidation, dissolution or winding up of AIG. |
Redemption
The Series A Preferred Stock is perpetual and has no maturity date. We may redeem the Series A Preferred Stock at our option:
| • | in whole, but not in part, at any time prior to March 15, 2024, within 90 days after the occurrence of a “rating agency event,” at a redemption price equal to $25,500 per share of the Series A Preferred Stock (equivalent to $25.50 per Depositary Share), plus an amount equal to any dividends per share that have been declared but not paid prior to the redemption date (with no amount in respect of any dividends that have not been declared prior to such date), or |
| • | (i) in whole, but not in part, at any time prior to March 15, 2024, within 90 days after the occurrence of a “regulatory capital event,” or (ii) in whole or in part, from time to time, on or after March 15, 2024, in each case, at a redemption price equal to $25,000 per share of the Series A Preferred Stock (equivalent to $25.00 per Depositary Share), plus an amount equal to any dividends per share that have been declared but not paid prior to the redemption date (with no amount in respect of any dividends that have not been declared prior to such date). |
For purposes of this section, “rating agency event” means that any nationally recognized statistical rating organization within the meaning of Section 3(a)(62) of the Exchange Act that then publishes a rating for us (a “rating agency”) amends, clarifies or changes the criteria it uses to assign equity credit to securities such as the Series A Preferred Stock, which amendment, clarification or change results in:
| • | the shortening of the length of time the Series A Preferred Stock is assigned a particular level of equity credit by that rating agency as compared to the length of time it would have been assigned that level of equity credit by that rating agency or its predecessor on the initial issuance of the Series A Preferred Stock; or |
| • | the lowering of the equity credit (including up to a lesser amount) assigned to the Series A Preferred Stock by that rating agency as compared to the equity credit assigned by that rating agency or its predecessor on the initial issuance of the Series A Preferred Stock. |
For purposes of this section, “regulatory capital event” means our good faith determination that, as a result of:
| • | any amendment to, or change in, the laws, rules or regulations of the United States or any political subdivision of or in the United States or any other governmental agency or instrumentality as may then have group-wide oversight of AIG’s regulatory capital that is enacted or becomes effective after the initial issuance of the Series A Preferred Stock, |
| • | any proposed amendment to, or change in, those laws, rules or regulations that is announced or becomes effective after the initial issuance of the Series A Preferred Stock, or |
| • | any official administrative decision or judicial decision or administrative action or other official pronouncement interpreting or applying those laws, rules or regulations that is announced after the initial issuance of the Series A Preferred Stock, |
there is more than an insubstantial risk that the full liquidation preference (as defined below) per share of the Series A Preferred Stock outstanding from time to time would not qualify as capital (or a substantially similar concept) for purposes of any group capital standard to which we are or will be subject.
In case of any redemption of only part of the shares of Series A Preferred Stock at the time outstanding, the shares to be redeemed will be selected either pro rata from the holders of record of the Series A Preferred Stock in proportion to the number of shares of the Series A Preferred Stock held by such holders or by lot. Subject to the provisions of the certificate of designations relating to the Series A Preferred Stock, our board (or a duly authorized committee of the board) will have full power and authority to prescribe the terms and conditions on which shares of the Series A Preferred Stock will be redeemed from time to time. If we will have issued certificates for the Series A Preferred Stock and fewer than all shares represented by any certificates are redeemed, new certificates will be issued representing the unredeemed shares without charge to the holders thereof.
The Series A Preferred Stock is not subject to any mandatory redemption, sinking fund or other similar provisions. Holders of the Series A Preferred Stock have no right to require redemption of any shares of the Series A Preferred Stock.
Liquidation Rights
In the event of any liquidation, dissolution or winding up of the affairs of AIG, whether voluntary or involuntary, before any distribution or payment out of our assets may be made to or set aside for the holders of any junior stock, holders of the Series A Preferred Stock will be entitled to receive out of our assets legally available for distribution to our stockholders an amount equal to the stated amount per share, together with an amount equal to all dividends (if any) that have been declared but not paid prior to the date of payment (without any amount in respect of dividends that have not been declared prior to such payment date) (for purposes of this section, the “liquidation preference”).
If our assets are not sufficient to pay the liquidation preference in full to all holders of the Series A Preferred Stock and all holders of any class or series of our stock that ranks on a parity with the Series A Preferred Stock in the distribution of assets on liquidation, dissolution or winding up of AIG (for purposes of this section, the “liquidation preference parity stock”), the amounts paid to the holders of the Series A Preferred Stock and to the holders of all liquidation preference parity stock will be pro rata in accordance with the respective aggregate liquidation preferences of the Series A Preferred Stock and all such liquidation preference parity stock. In any such distribution, the “liquidation preference” of any holder of our stock other than the Series A Preferred Stock means the amount otherwise payable to such holder in such distribution (assuming no limitation on our assets available for such distribution), including an amount equal to any declared but unpaid dividends in the case of any holder of stock on which dividends accrue on a noncumulative basis and, in the case of any holder of stock on which dividends accrue on a cumulative basis, an amount equal to any unpaid, accrued, cumulative dividends, whether or not earned or declared, as applicable. If the liquidation preference has been paid in full to all holders of the Series A Preferred Stock and all holders of any liquidation preference parity stock, the holders of junior stock will be entitled to receive all of our remaining assets according to their respective rights and preferences.
For purposes of the liquidation rights, the merger, consolidation or other business combination of us with or into any other corporation, including a transaction in which the holders of the Series A Preferred Stock receive cash or property for their shares, or the sale, conveyance, lease, exchange or transfer (for cash, shares of stock, securities or other consideration) of all or substantially all of our assets, will not constitute a liquidation, dissolution or winding up of AIG.
Voting Rights
Except as indicated below or otherwise required by law, the holders of the Series A Preferred Stock do not have any voting rights.
Right to Elect Two Directors on Nonpayment of Dividends
If and whenever dividends payable on the Series A Preferred Stock or any class or series of dividend parity stock having voting rights equivalent to those described in this paragraph (for purposes of this section, “voting parity stock”) have not been declared and paid (or, in the case of voting parity stock bearing dividends on a cumulative basis, will be in arrears) in an aggregate amount equal to full dividends for at least six quarterly dividend periods or their equivalent (whether or not consecutive) (for purposes of this section, a “nonpayment event”), the number of directors then constituting our board will be automatically increased by two and the holders of the Series A Preferred Stock, together with the holders of any outstanding voting parity stock then entitled to vote for additional directors, voting together as a single class in proportion to their respective stated amounts, will be entitled to elect the two additional directors (for purposes of this section, the “preferred stock directors”); provided that our board will at no time include more than two preferred stock directors (including, for purposes of this limitation, all directors that the holders of any series of voting preferred stock are entitled to elect pursuant to like voting rights).
In the event that the holders of the Series A Preferred Stock and such other holders of voting parity stock will be entitled to vote for the election of the preferred stock directors following a nonpayment event, such directors will be initially elected following such nonpayment event only at a special meeting called at the request of the holders of record of at least 20% of the stated amount of the Series A Preferred Stock and each other series of voting parity stock then outstanding (unless such request for a special meeting is received less than 90 days before the date fixed for the next annual or special meeting of our stockholders, in which event such election will be held only at such next annual or special meeting of stockholders), and at each subsequent annual meeting of our stockholders. Such request to call a special meeting for the initial election of the preferred stock directors after a nonpayment event will be made by written notice, signed by the requisite holders of the Series A Preferred Stock or voting parity stock, and delivered to our secretary, or as may otherwise be required or permitted by applicable law. If our secretary fails to call a special meeting for the election of the preferred stock directors within 20 days of receiving proper notice, any holder of the Series A Preferred Stock may call such a meeting at our expense solely for the election of the preferred stock directors, and for this purpose and no other (unless provided otherwise by applicable law) such Series A Preferred Stock holder will have access to our stock ledger.
When (i) dividends have been paid regularly on the Series A Preferred Stock for at least one year after a nonpayment event, and (ii) the rights of holders of any voting parity stock to participate in electing the preferred stock directors will have ceased, the right of holders of the Series A Preferred Stock to participate in the election of preferred stock directors will cease (but subject always to the revesting of such voting rights in the case of any future nonpayment event), the terms of office of all the preferred stock directors will immediately terminate, and the number of directors constituting our board will automatically be reduced accordingly.
Any preferred stock director may be removed at any time without cause by the holders of record of a majority of the outstanding shares of the Series A Preferred Stock and voting parity stock, when they have the voting rights described above (voting together as a single class in proportion to their respective stated amounts). The preferred stock directors elected at any such special meeting will hold office until the next annual meeting of the stockholders if such office will not have previously terminated as above provided. In case any vacancy will occur among the preferred stock directors, a successor will be elected by our board to serve until the next annual meeting of the stockholders on the nomination of the then remaining preferred stock director or, if no preferred stock director remains in office, by the vote of the holders of record of a majority of the outstanding shares of the Series A Preferred Stock and such voting parity stock for which dividends have not been paid, voting as a single class in proportion to their respective stated amounts. The preferred stock directors will each be entitled to one vote per director on any matter that will come before our board for a vote.
Other Voting Rights
So long as any shares of the Series A Preferred Stock are outstanding, in addition to any other vote or consent of stockholders required by law or by our amended and restated certificate of incorporation, the vote or consent of the holders of at least two thirds of the shares of the Series A Preferred Stock at the time outstanding, voting together with any other series of preferred stock that would be adversely affected in substantially the same manner and entitled to vote as a single class in proportion to their respective stated amounts (to the exclusion of all other series of preferred stock), given in person or by proxy, either in writing without a meeting or by vote at any meeting called for the purpose, will be necessary for effecting or validating:
| • | Amendment of Certificate of Incorporation or By-laws. Any amendment, alteration or repeal of any provision of our amended and restated certificate of incorporation or by-laws that would alter or change the voting powers, preferences or special rights of the Series A Preferred Stock so as to affect them adversely; provided that the amendment of the amended and restated certificate of incorporation so as to authorize or create, or to increase the authorized amount of, any class or series of stock that does not rank senior to the Series A Preferred Stock in either the payment of dividends or in the distribution of assets on any liquidation, dissolution or winding up of AIG will not be deemed to affect adversely the voting powers, preferences or special rights of the Series A Preferred Stock; |
| • | Authorization of Senior Stock. Any amendment or alteration of the amended and restated certificate of incorporation to authorize or create, or increase the authorized amount of, any shares of any class or series or any securities convertible into shares of any class or series of our capital stock ranking senior to the Series A Preferred Stock in the payment of dividends or in the distribution of assets on any liquidation, dissolution or winding up of AIG; or |
| • | Share Exchanges, Reclassifications, Mergers and Consolidations and Other Transactions. Any consummation of (x) a binding share exchange or reclassification involving the Series A Preferred Stock, (y) a merger or consolidation of AIG with another entity (whether or not a corporation), or (z) a conversion, transfer, domestication or continuance of AIG into another entity or an entity organized under the laws of another jurisdiction, unless in each case (A) the shares of the Series A Preferred Stock remain outstanding or, in the case of any such merger or consolidation with respect to which we are not the surviving or resulting entity, or any such conversion, transfer, domestication or continuance, the shares of Series A Preferred Stock are converted into or exchanged for preference securities of the surviving or resulting entity or its ultimate parent, and (B) such shares remaining outstanding or such preference securities, as the case may be, have such rights, preferences, privileges and voting powers, and limitations and restrictions, and limitations and restrictions thereof, taken as a whole, as are not materially less favorable to the holders thereof than the rights, preferences, privileges and voting powers, and restrictions and limitations thereof, of the Series A Preferred Stock immediately prior to such consummation, taken as a whole. |
The foregoing voting provisions will not apply if, at or prior to the time when the act with respect to which the vote would otherwise be required will be effected, all outstanding shares of the Series A Preferred Stock have been redeemed or called for redemption on proper notice and sufficient funds have been set aside by us for the benefit of the holders of the Series A Preferred Stock to effect the redemption.
Under current provisions of the Delaware General Corporation Law, the holders of issued and outstanding preferred stock are entitled to vote as a class, with the consent of the majority of the class being required to approve an amendment to our amended and restated certificate of incorporation if the amendment would increase or decrease the aggregate number of authorized shares of such class or increase or decrease the par value of the shares of such class.
Transfer Agent and Registrar
Equiniti Trust Company is the transfer agent and registrar for the Series A Preferred Stock.
Description of the Depositary Shares
As described above under “Description of the Series A Preferred Stock”, we issued fractional interests in shares of the Series A Preferred Stock in the form of the Depositary Shares. Each Depositary Share represents a 1/1,000th interest in a share of the Series A Preferred Stock, and is evidenced by a depositary receipt. The shares of the Series A Preferred Stock represented by the Depositary Shares are deposited under a deposit agreement among us, Equiniti Trust Company, as the Depositary, and the holders from time to time of the depositary receipts evidencing the Depositary Shares. Subject to the terms of the deposit agreement, each holder of Depositary Shares is entitled, through the Depositary, in proportion to the applicable fraction of a share of the Series A Preferred Stock represented by such Depositary Shares, to all the rights and preferences of the Series A Preferred Stock represented thereby (including dividend, voting, redemption and liquidation rights).
Dividends and Other Distributions
The Depositary will distribute any cash dividends or other cash distributions received in respect of the deposited Series A Preferred Stock to the record holders of the Depositary Shares in proportion to the number of the Depositary Shares held by each holder on the relevant record date. The Depositary will distribute any property received by it other than cash to the record holders of the Depositary Shares entitled to those distributions, unless it determines that the distribution cannot be made proportionally among those holders or that it is not feasible to make a distribution. In that event, the Depositary may, with our approval, sell the property and distribute the net proceeds from the sale to the holders of the Depositary Shares in proportion to the number of the Depositary Shares they hold.
Record dates for the payment of dividends and other matters relating to the Depositary Shares are the same as the corresponding record dates for the Series A Preferred Stock.
The amounts distributed to holders of the Depositary Shares will be reduced by any amounts required to be withheld by the Depositary or by us on account of taxes or other governmental charges.
Redemption of the Depositary Shares
If we redeem the Series A Preferred Stock represented by the Depositary Shares, in whole or in part, a corresponding number of Depositary Shares will be redeemed from the proceeds received by the Depositary resulting from the redemption of the Series A Preferred Stock held by the Depositary. The redemption price per Depositary Share will be equal to 1/1,000th of the redemption price per share payable with respect to the Series A Preferred Stock, plus any declared and unpaid dividends, without accumulation of any undeclared dividends, on the shares of the Series A Preferred Stock. Whenever we redeem shares of the Series A Preferred Stock held by the Depositary, the Depositary will redeem, as of the same redemption date, the number of the Depositary Shares representing shares of the Series A Preferred Stock so redeemed.
In case of any redemption of less than all of the outstanding Depositary Shares, the Depositary Shares to be redeemed will be selected by the Depositary pro rata or by lot. In any such case, the Depositary will redeem the Depositary Shares only in increments of 1,000 shares and any integral multiple thereof.
Voting of the Depositary Shares
When the Depositary receives notice of any meeting at which the holders of the Series A Preferred Stock are entitled to vote, the Depositary will mail (or otherwise transmit by an authorized method) the information contained in the notice to the record holders of the Depositary Shares. Each record holder of Depositary Shares on the record date, which is the same date as the record date for the Series A Preferred Stock, may instruct the Depositary to vote the amount of the Series A Preferred Stock represented by the holder’s Depositary Shares. Although each Depositary Share is entitled to 1/1,000th of a vote, the Depositary can only vote whole shares of Series A Preferred Stock. To the extent possible, the Depositary will vote the amount of the Series A Preferred Stock represented by the Depositary Shares in accordance with the instructions it receives. We will agree to take all reasonable actions that the Depositary determines are necessary to enable the Depositary to vote as instructed. If the Depositary does not receive specific instructions from the holders of any Depositary Shares, it will not vote the amount of the Series A Preferred Stock represented by such Depositary Shares.
Form of the Depositary Shares
The Depositary Shares were issued in book-entry form through DTC. The Series A Preferred Stock is issued in registered form to the Depositary.
Depositary
Equiniti Trust Company is the Depositary for the Depositary Shares.
IV. 5.75% Series A-2 Junior Subordinated Debentures and 4.875% Series A-3 Junior Subordinated Debentures
The following description of the 5.75% Series A-2 Junior Subordinated Debentures, which we refer to in this section as the “Series A-2 Junior Subordinated Debentures”, and the 4.875% Series A-3 Junior Subordinated Debentures, which we refer to in this section as the “Series A-3 Junior Subordinated Debentures” and, together with the Series A-2 Junior Subordinated Debentures, the “Junior Subordinated Debentures”, is a summary and does not purport to be complete. It is qualified in its entirety by reference to the Junior Subordinated Indenture, dated as of March 13, 2007 (as supplemented, the “Junior Subordinated Indenture”), between American International Group, Inc. and The Bank of New York Mellon, as trustee, which is supplemented in the case of the Series A-2 Junior Subordinated Debentures by the Second Supplemental Indenture, dated as of March 15, 2007, and which is supplemented in the case of the Series A-3 Junior Subordinated Debentures by the Third Supplemental Indenture, dated as of March 15, 2007. We encourage you to read the above referenced indenture, as supplemented, for additional information.
General
The Series A-2 Junior Subordinated Debentures were originally issued in an initial aggregate principal amount of £750,000,000. The Series A-3 Junior Subordinated Debentures were originally issued in an initial aggregate principal amount of €1,000,000,000. We may, without the consent of the holders of the Junior Subordinated Debentures, increase the principal amount of each series of the Junior Subordinated Debentures by issuing additional debentures of each series on the same terms and conditions (except that the initial public offering price, issue date and initial interest payment date may vary) and with the same CUSIP number, ISIN and common code as each series of the Junior Subordinated Debentures, provided that the total principal amount of Series A-2 Junior Subordinated Debentures outstanding may not exceed £1,500,000,000 and the total principal amount of Series A-3 Junior Subordinated Debentures outstanding may not exceed €2,000,000,000 and any further issues must be fungible for United States federal income tax purposes.
We will be required to repay the principal amount of the Junior Subordinated Debentures on March 15, 2037, or, if that date is not a business day, on the next business day (for purposes of this section, the “scheduled maturity date”) only to the extent that we have sold “qualifying capital securities” during a 180-day period ending on a notice date not more than 30 or less than 10 business days prior to the scheduled maturity date. We will use our commercially reasonable efforts, subject to “market disruption events,” to sell enough qualifying capital securities to permit repayment of the Junior Subordinated Debentures in full on the scheduled maturity date. If any amount is not paid on the scheduled maturity date, it will remain outstanding and continue to bear interest at a floating rate and we will continue to use our commercially reasonable efforts to sell enough qualifying capital securities to permit the repayment of any remaining principal amount of the Junior Subordinated Debentures in full. On March 15, 2067, we must pay any remaining principal and interest on the Junior Subordinated Debentures in full whether or not we have sold qualifying capital securities. The Junior Subordinated Debentures are our unsecured, subordinated obligations and are junior in right of payment to all of our existing and future senior and subordinated indebtedness. Each of the Series A-2 Junior Subordinated Debentures and the Series A-3 Junior Subordinated Debentures rank pari passu with each other and with our Series A-1 and A-6 through A-9 Junior Subordinated Debentures (as used in this section, the “outstanding parity securities”).
The Junior Subordinated Debentures were issued in fully registered form and in denominations that are even multiples of €50,000.
Interest
The Series A-2 Junior Subordinated Debentures will bear interest from and including March 15, 2007 to but excluding March 15, 2017, at the annual rate of 5.75%, payable semi-annually in arrears on March 15 and September 15 of each year. The Series A-3 Junior Subordinated Debentures will bear interest from and including March 15, 2007 to but excluding March 15, 2017, at the annual rate of 4.875%, payable annually in arrears on March 15 of each year. Commencing on March 15, 2017, the Series A-2 Junior Subordinated Debentures will bear interest from and including March 15, 2017 at a rate equal to three-month Sterling LIBOR plus 1.705% and the Series A-3 Junior Subordinated Debentures will bear interest from and including March 15, 2017 at a rate equal to three-month EURIBOR plus 1.73%, each payable quarterly in arrears on each March 15, June 15, September 15 and December 15. We refer to these dates as “interest payment dates” and we refer to the period beginning on and including March 15, 2007 and ending on but excluding the first interest payment date and each successive period beginning on and including an interest payment date and ending on but excluding the next interest payment date as an “interest period.” The amount of interest payable for any interest period ending on or prior to March 15, 2017 will be computed on the basis of the number of days from and including the date on which the interest begins to accrue during the relevant interest period to but excluding the scheduled date on which the interest is payable, divided by the number of days in the relevant interest period (including the first day but excluding the last day of such interest period). The amount of interest payable for any interest period commencing on or after March 15, 2017 will be computed on the basis of, in the case of the Series A-2 Junior Subordinated Debentures, a 365-day year, and in the case of the Series A-3 Junior Subordinated Debentures, a 360-day year and the actual number of days elapsed. In the event that any interest payment date on or before March 15, 2017 would otherwise fall on a day that is not a business day, the interest payment due on that date will be postponed to the next day that is a business day and no interest will accrue as a result of that postponement. In the event that any interest payment date after March 15, 2017 would otherwise fall on a day that is not a business day, that interest payment date will be postponed to the next day that is a business day; however, if the postponement would cause the day to fall in the next calendar month, the interest payment date will instead be brought forward to the immediately preceding business day.
Accrued interest that is not paid on the applicable interest payment date will bear additional interest, to the extent permitted by law, at the interest rate in effect from time to time, from the relevant interest payment date, compounded on each subsequent interest payment date.
For the purposes of calculating interest due on the Series A-2 Junior Subordinated Debentures after March 15, 2017:
| · | “Three-month Sterling LIBOR,” with respect to any quarterly interest period, will be the rate (expressed as a percentage per annum) for deposits in pounds Sterling for a three-month period that appears on Reuters Screen LIBOR01 as of 11:00 a.m., London time, on the first day of such interest period. If three-month Sterling LIBOR cannot be determined as described above, the rate for such interest period will be determined on the basis of the rates at which deposits in pounds Sterling are offered by four leading banks selected by the calculation agent, at approximately 11:00 a.m., London time, on the first day of such interest period, to prime banks in the London interbank market for a period of three months commencing on the first day of such interest period. These quotations will be based upon a principal amount that is representative of a single transaction in pounds Sterling in such market at the time. If two or more quotations are provided, three-month Sterling LIBOR for the interest period will be the arithmetic mean of the quotations. If fewer than two quotations are provided, three-month Sterling LIBOR will be the arithmetic mean of the rates quoted by major banks in London, selected by the calculation agent, at approximately 11:00 a.m., London time, on the first day of such interest period. The rates quoted will be for loans in pounds Sterling for a three-month period to leading European banks commencing on the first day of such interest period. |
Rates quoted must be based on a principal amount that is representative of a single transaction in pounds Sterling in such market at that time. If fewer than three banks are quoting rates, three-month Sterling LIBOR for the applicable period will be the same as for the immediately preceding interest period, or, in the case of the quarterly interest period beginning on March 15, 2017, three-month Sterling LIBOR will be 5.53%.
| · | “Calculation agent” means AIG Financial Products Corp., or any other firm appointed by us, acting as calculation agent. |
| · | A “London banking day” means any day on which dealings in pounds Sterling are transacted in the London interbank market. |
| · | “Reuters Screen LIBOR01” means the display designated on Reuters Screen LIBOR01 or any successor service or page for the purpose of displaying LIBOR offered rates of major banks, as determined by the calculation agent. |
For the purposes of calculating interest due on the Series A-3 Junior Subordinated Debentures after March 15, 2017:
| · | “Three-month EURIBOR,” with respect to any quarterly interest period, will be the rate (expressed as a percentage per annum) for deposits in euro for a three-month period that appears on Reuters Screen EURIBOR01 as of 11:00 a.m., Brussels time, on the second TARGET settlement day (as defined below for purposes of this section) immediately preceding the first day of such interest period. If the Reuters Screen EURIBOR01 does not include such a rate or is unavailable on such date, the calculation agent (as defined below for purposes of this section) will request the principal London office of each of four major banks in the Euro-zone inter-bank market, as selected by the calculation agent (after consultation with us), to provide such bank’s offered quotation (expressed as a percentage per annum) as of approximately 11:00 am., Brussels time, on such date, to prime banks in the Euro-zone inter-bank market for deposits in an amount in euro that is representative for a single transaction in such market and for a three-month period beginning on the day that is two TARGET settlement days after such date. If at least two such offered quotations are so provided, the rate for the interest period will be the arithmetic mean of such quotations. If fewer than two such quotations are so provided, the calculation agent will request each of three major banks in London, as selected by the calculation agent, to provide such bank’s rate (expressed as a percentage per annum), as of approximately 11:00 a.m., London time, on such date. Rates quoted will be for loans in euro to leading European banks for a three-month period beginning on the day that is two TARGET settlement days after such date based on a principal amount that is representative of a single transaction in that market at that time. If at least two such rates are so provided, the rate for the interest period will be the arithmetic mean of such rates. If fewer than two such rates are so provided then the rate for the interest period will be the rate in effect with respect to the immediately preceding interest period, or, in the case of the quarterly interest period beginning on March 15, 2017, three-month EURIBOR will be 3.879%. |
| · | “Calculation agent” means AIG Financial Products Corp., or any other firm appointed by us, acting as calculation agent. |
| · | A “TARGET settlement day” means a day on which the Trans-European Automated Real-Time Gross Settlement Express Transfer (TARGET) System is open. |
| · | “Reuters Screen EURIBOR01” means the display designated on Reuters Screen EURIBOR01 or any successor service or page for the purpose of displaying EURIBOR offered rates of major banks, as determined by the calculation agent. |
All percentages resulting from any calculation of three-month Sterling LIBOR or three-month EURIBOR will be rounded upward or downward, as appropriate, to the next higher or lower one hundred-thousandth of a percentage point (for example, 9.876541% (or .09876541) would be rounded down to 9.87654% (or .0987654) and 9.876545% (or .09876545) would be rounded up to 9.87655% (or .0987655)). All amounts used in or resulting from any calculation will be rounded upward or downward, as appropriate, to the nearest cent, with one-half cent or more being rounded upward. The establishment of three-month Sterling LIBOR or three-month EURIBOR for each interest period by the calculation agent shall (in the absence of manifest error) be final and binding.
In determining three-month Sterling LIBOR or three-month EURIBOR during a particular interest period, the calculation agent may obtain rate quotes from various banks or dealers active in the relevant market. Those reference banks and dealers may include the calculation agent itself and our other affiliates.
Option to Defer Interest Payments
We may elect at one or more times to defer payment of interest on the Junior Subordinated Debentures for one or more consecutive interest periods that do not exceed 10 years. We may defer payment of interest prior to, on or after the scheduled maturity date. We may not defer interest beyond March 15, 2067 or the earlier redemption date of any Junior Subordinated Debentures being redeemed. We currently do not intend to exercise our option to defer interest on the Junior Subordinated Debentures.
Deferred interest on the Junior Subordinated Debentures will bear interest at the then applicable interest rate, compounded on each interest payment date, subject to applicable law. As used in this section, a “deferral period” refers to the period beginning on an interest payment date with respect to which we elect to defer interest and ending on the earlier of (i) the tenth anniversary of that interest payment date and (ii) the next interest payment date on which we have paid all accrued and previously unpaid interest on the Junior Subordinated Debentures.
We have agreed in the Junior Subordinated Indenture that:
| · | immediately following the first interest payment date during the deferral period on which we elect to pay current interest or, if earlier, the fifth anniversary of the beginning of the deferral period, we will be required to use commercially reasonable efforts to sell “common stock,” “qualifying warrants” and “qualifying non-cumulative preferred stock” pursuant to the alternative payment mechanism, unless we have delivered notice of a “market disruption event,” and apply the “eligible proceeds,” as these terms are defined in the Third Supplemental Indenture to the Junior Subordinated Indenture, to the payment of any deferred interest (and compounded interest) on the next interest payment date, and this requirement will continue in effect until the end of the deferral period; and |
| · | we will not pay deferred interest on the Junior Subordinated Debentures (and compounded interest thereon) prior to the final maturity date from any source other than eligible proceeds, unless otherwise required by an applicable regulatory authority, the deferral period is terminated on the interest payment date following certain business combinations described below or an event of default has occurred and is continuing. |
We may pay current interest at all times from any available funds.
If we are involved in a merger, consolidation, amalgamation, binding share exchange or conveyance, transfer or lease of assets substantially as an entirety to any other person or a similar transaction (a “business combination”) where immediately after the consummation of the business combination more than 50% of the surviving or resulting entity’s voting stock is owned by the shareholders of the other party to the business combination or continuing directors cease for any reason to constitute a majority of the directors of the surviving or resulting entity, then the foregoing rules will not apply to any deferral period that is terminated on the next interest payment date following the date of consummation of the business combination. For purposes of this section, “continuing director” means a director who was a director of AIG at the time the definitive agreement relating to the transaction was approved by the AIG board of directors.
Although our failure to comply with the foregoing rules with respect to the alternative payment mechanism and payment of interest during a deferral period will be a breach of the Junior Subordinated Indenture, it will not constitute an event of default under the Junior Subordinated Indenture or give rise to a right of acceleration or similar remedy.
We will give the holders of the Junior Subordinated Debentures and the indenture trustee written notice of our election to begin a deferral period at least one business day before the record date for the next interest payment date. However, our failure to pay interest on any interest payment date will itself constitute the commencement of a deferral period unless we pay such interest within five business days after the interest payment date, whether or not we provide a notice of deferral. A failure to pay interest will not give rise to an event of default unless we fail to pay interest, including compounded interest, in full for a period of 30 days after the conclusion of a 10-year period following the commencement of any deferral period.
If we have paid all deferred interest on the Junior Subordinated Debentures, we can again defer interest payments on the Junior Subordinated Debentures as described above. The Junior Subordinated Indenture does not limit the number or frequency of interest deferral periods.
Dividend and Other Payment Stoppages during Interest Deferral and under Certain Other Circumstances
We have agreed that, so long as any Junior Subordinated Debentures remain outstanding, if an event of default has occurred and is continuing or we have given notice of our election to defer interest payments but the related deferral period has not yet commenced or a deferral period is continuing, then we will not, and will not permit any of our subsidiaries to:
| · | declare or pay any dividends or distributions on, or redeem, purchase, acquire or make a liquidation payment with respect to, any shares of our capital stock; |
| · | make any payment of principal of, or interest or premium, if any, on, or repay, purchase or redeem any of our debt securities that upon our liquidation rank pari passu with, or junior to, the Junior Subordinated Debentures; or |
| · | make any guarantee payments regarding any guarantee by us of the junior subordinated debt securities of any of our subsidiaries if the guarantee ranks pari passu with, or junior in interest to, the Junior Subordinated Debentures. |
The restrictions listed above do not apply to:
| · | purchases, redemptions or other acquisitions of shares of our capital stock in connection with: |
| • | any employment benefit plan or other compensatory contract or arrangement; or the Assurance Agreement, dated as of June 27, 2005, by AIG in favor of eligible employees and relating to specified obligations of Starr International Company, Inc. (as such agreement may be amended, supplemented, extended, modified or replaced from time to time); or |
| • | a dividend reinvestment, stock purchase plan or other similar plan; |
| · | any exchange or conversion of any class or series of our capital stock (or any capital stock of a subsidiary of AIG) for any class or series of our capital stock or of any class or series of our indebtedness for any class or series of our capital stock; or |
| · | the purchase of fractional interests in shares of our capital stock in accordance with the conversion or exchange provisions of such capital stock or the security being converted or exchanged; or |
| · | any declaration of a dividend in connection with any stockholders’ rights plan, or the issuance of rights, equity securities or other property under any stockholders’ rights plan, or the redemption or repurchase of rights in accordance with any stockholders’ rights plan; or |
| · | any dividend in the form of equity securities, warrants, options or other rights where the dividend stock or the stock issuable upon exercise of the warrants, options or other rights is the same stock as that on which the dividend is being paid or ranks on a parity with or junior to such equity securities; or |
| · | any payment during a deferral period of current interest in respect of our debt securities that upon our liquidation rank pari passu with the Junior Subordinated Debentures that is made pro rata to the amounts due on such pari passu securities and on the Junior Subordinated Debentures and any payments of deferred interest on pari passu securities that, if not made, would cause us to breach the terms of the instrument governing such pari passu securities; or |
| · | any payment of principal in respect of pari passu securities having an earlier scheduled maturity date than the Junior Subordinated Debentures, as required under a provision of such pari passu securities that is substantially the same as the repayment provisions for the Junior Subordinated Debentures or any such payment in respect of pari passu securities having the same scheduled maturity date as the Junior Subordinated Debentures that is made on a pro rata basis among one or more series of such securities and the Junior Subordinated Debentures; or |
| · | any repayment or redemption of a security necessary to avoid a breach of the instrument governing the same. |
In addition, if any deferral period lasts longer than one year, neither we nor any of our subsidiaries will be permitted to purchase, redeem or otherwise acquire any securities ranking junior to or pari passu with any APM qualifying securities (for purposes of this section, as defined below under “Alternative Payment Mechanism”) the proceeds of which were used to settle deferred interest during the relevant deferral period until the first anniversary of the date on which all deferred interest has been paid, subject to the exceptions listed above. However, if we are involved in a business combination where immediately after its consummation more than 50% of the surviving or resulting entity’s voting stock is owned by the shareholders of the other party to the business combination or continuing directors cease for any reason to constitute a majority of the surviving or resulting entity’s board of directors, then the one-year restriction on repurchases described in the previous sentence will not apply to any deferral period that is terminated on the next interest payment date following the date of consummation of the business combination.
Alternative Payment Mechanism
Obligations and Limitations Applicable to All Deferral Periods
Subject to the conditions described under “Option to Defer Interest Payments” above and to the exclusions described in “Market Disruption Events” below, if we defer interest on the Junior Subordinated Debentures, we will be required, commencing not later than (i) the first interest payment date on which we elect to pay current interest or (ii) if earlier, the business day following the fifth anniversary of the commencement of the deferral period, to issue “APM qualifying securities,” as defined below for purposes of this section, subject to the limits described below, until we have raised an amount of “eligible proceeds,” as defined below for purposes of this section, at least equal to the aggregate amount of accrued and unpaid deferred interest on the Junior Subordinated Debentures. We refer to this period as the “APM period” and to this method of funding the payment of accrued and unpaid interest as the “alternative payment mechanism.”
We have agreed to apply eligible proceeds raised during any deferral period pursuant to the alternative payment mechanism to pay deferred interest on the Junior Subordinated Debentures.
“Eligible proceeds,” for each relevant interest payment date, means the net proceeds (after underwriters’ or placement agents’ fees, commissions or discounts and other expenses relating to the issuance or sale) that AIG has received during the 180 days prior to the related distribution date from the issuance of APM qualifying securities to persons that are not subsidiaries of AIG.
“APM qualifying securities” means common stock, qualifying warrants and qualifying non-cumulative preferred stock.
“Common stock,” under the alternative payment mechanism, means shares of AIG common stock, including treasury stock and shares of common stock sold pursuant to AIG’s dividend reinvestment plan and employee benefit plans up to the “maximum share number,” as defined below.
“Qualifying warrants” means net share settled warrants to purchase shares of common stock that:
| · | have an exercise price greater than the “current stock market price” of our common stock as of their date of pricing; |
| · | we are not entitled to redeem for cash and the holders are not entitled to require us to repurchase for cash in any circumstances; and |
| · | do not entitle the holders thereof to purchase a number of shares of our common stock in excess of the then applicable “maximum warrant number,” as defined below. |
We intend to issue qualifying warrants with exercise prices at least 10% above the current stock market price of our common stock on the date of pricing of the warrants. The “current stock market price” of our common stock on any date is the closing sale price per share (or if no closing sale price is reported, the average of the bid and ask prices or, if more than one in either case, the average of the average bid and the average ask prices) on that date as reported in composite transactions by the New York Stock Exchange or, if our common stock is not then listed on the New York Stock Exchange, as reported by the principal U.S. securities exchange on which our common stock is traded. If our common stock is not listed on any U.S. securities exchange on the relevant date, the “current stock market price” will be the average of the mid-point of the bid and ask prices for our common stock on the relevant date from each of at least three nationally recognized independent investment banking firms selected by us for this purpose.
“Qualifying non-cumulative preferred stock” means our non-cumulative perpetual preferred stock that (i) contains no remedies other than “permitted remedies” and (ii)(a) is redeemable, but is subject to “intent-based replacement disclosure,” as such terms are defined in the Replacement Capital Covenant with respect to each series of Junior Subordinated Debentures, and has a provision that prohibits AIG from making any distributions thereon upon its failure to satisfy one or more financial tests set forth therein or (b) is subject to a replacement capital covenant substantially similar to the replacement capital covenant applicable to the Junior Subordinated Debentures. We are not permitted to issue qualifying non-cumulative preferred stock for the purpose of paying deferred interest to the extent the net proceeds of such issuance applied to pay interest on the Junior Subordinated Debentures pursuant to the alternative payment mechanism, together with the net proceeds of all prior issuances of qualifying non-cumulative preferred stock applied during the current and all prior deferral periods, would exceed 25% of the aggregate principal amount of the Junior Subordinated Debentures initially issued under the junior debt indenture (the “preferred stock issuance cap”).
The “maximum share number” will initially equal 100 million and the “maximum warrant number” will initially equal 100 million. If the number of issued and outstanding shares of our common stock is changed into a different number of shares or a different class by reason of any stock split, reverse stock split, stock dividend, reclassification, recapitalization, split-up, combination, exchange of shares or other similar transaction, then the maximum share number and the maximum warrant number will be correspondingly adjusted. We may, at our discretion and without the consent of the holders of the Junior Subordinated Debentures, increase the maximum share number or the maximum warrant number or both (including through the increase of our authorized share capital, if necessary) if we determine that such increase is necessary to allow us to issue sufficient common stock and/or qualifying warrants to pay deferred interest on the Junior Subordinated Debentures.
Additional Limitations Applicable to the First Five Years of Any Deferral Period
We may become subject to the alternative payment mechanism prior to the fifth anniversary of the commencement of a deferral period if we elect to pay current interest prior to such date. In such event, we are not required to issue shares of common stock or qualifying warrants under the alternative payment mechanism for the purpose of paying deferred interest during the first five years of that deferral period to the extent the number of shares of common stock issued and the number of shares of common stock subject to such qualifying warrants, together with the number of shares of common stock previously issued and the number of shares of common stock subject to qualifying warrants previously issued during such deferral period to pay interest on the Junior Subordinated Debentures pursuant to the alternative payment mechanism would, in the aggregate, exceed 2% of the total number of issued and outstanding shares of our common stock as of the date of our then most recent publicly available consolidated financial statements (the “stock and warrant issuance cap”).
Once we reach the stock and warrant issuance cap for a deferral period, we will not be required to issue more shares of common stock or qualifying warrants under the alternative payment mechanism during the first five years of such deferral period even if the stock and warrant issuance cap subsequently increases because of a subsequent increase in the number of outstanding shares of our common stock. The stock and warrant issuance cap will cease to apply after the fifth anniversary of the commencement of any deferral period, at which point we must pay any deferred interest regardless of the time at which it was deferred, using the alternative payment mechanism, subject to the limitations described under “Obligations and Limitations Applicable to All Deferral Periods” above and any market disruption event. In addition, if the stock and warrant issuance cap is reached during a deferral period and we subsequently pay all deferred interest, the stock and warrant issuance cap will cease to apply at the termination of such deferral period, reset to zero and will not apply again unless and until we start a new deferral period. The preferred stock issuance cap, however, does not reset to zero even if we pay all deferred interest and the net proceeds from sales of qualifying non-cumulative preferred stock applied pursuant to the alternative payment mechanism during such deferral period and all prior deferral periods cumulate as qualifying non-cumulative preferred stock is issued to pay deferred interest.
Remedies and Market Disruptions
Although our failure to comply with our obligations with respect to the alternative payment mechanism will breach a covenant under the Junior Subordinated Indenture, it will not constitute an event of default thereunder or give rise to a right of acceleration or similar remedy.
If, due to a market disruption event or otherwise, we were able to raise some, but not all, eligible proceeds necessary to pay all deferred interest on any interest payment date, we will apply any available eligible proceeds to pay accrued and unpaid interest on the applicable interest payment date in chronological order based on the date each payment was first deferred, and you will be entitled to receive your pro rata share of any amounts so paid. If, in addition to the Junior Subordinated Debentures, other pari passu securities are outstanding under which we are obligated to sell common stock, qualifying warrants or qualifying non-cumulative preferred stock and apply the net proceeds to the payment of deferred interest or distributions, then on any date and for any period the amount of net proceeds received by us from those sales and available for payment of the deferred interest and distributions shall be applied to the Junior Subordinated Debentures and those other pari passu securities on a pro rata basis up to, in the case of common stock, the stock and warrant issuance cap and the maximum share number, in the case of qualifying warrants, the stock and warrant issuance cap and the maximum warrant number and, in the case of qualifying non-cumulative preferred stock, the preferred stock issuance cap (or comparable provisions in the instruments governing those pari passu securities) in proportion to the total amounts that are due on the Junior Subordinated Debentures and such pari passu securities. The Junior Subordinated Debentures permit pro rata payments to be made on any other series so long as we deposit with our paying agent or segregate and hold in trust for payment the pro rata proceeds applicable to such series that we have not paid.
Market Disruption Events
A “market disruption event” means, for purposes of sales of APM qualifying securities pursuant to the alternative payment mechanism or sales of qualifying capital securities, as applicable (collectively, the “permitted securities”), the occurrence or existence of any of the following events or sets of circumstances:
| · | trading in securities generally (or in our shares specifically) on the New York Stock Exchange or any other national securities exchange, or in the over-the-counter market, on which our capital stock is then listed or traded shall have been suspended or its settlement generally shall have been materially disrupted or minimum prices shall have been established on any such exchange or market by the relevant regulatory body or governmental agency having jurisdiction that materially disrupts or otherwise has a material adverse effect on trading in, or the issuance and sale of, permitted securities; |
| · | we would be required to obtain the consent or approval of our stockholders or a regulatory body (including, without limitation, any securities exchange) or governmental authority to issue permitted securities and we fail to obtain that consent or approval notwithstanding our commercially reasonable efforts to obtain that consent or approval; |
| · | an event occurs and is continuing as a result of which the offering document for the offer and sale of permitted securities would, in our reasonable judgment, contain an untrue statement of a material fact or omit to state a material fact required to be stated in that offering document or necessary to make the statements in that offering document not misleading, provided that one or more events described under this bullet point shall not constitute a market disruption event with respect to a period of more than 90 days in any 180-day period; |
| · | we reasonably believe that the offering document for the offer and the sale of permitted securities would not be in compliance with a rule or regulation of the Securities and Exchange Commission (for reasons other than those referred to in the immediately preceding bullet point) and we are unable to comply with such rule or regulation or such compliance is unduly burdensome, provided that one or more events described under this bullet point shall not constitute a market disruption event with respect to a period of more than 90 days in any 180-day period; |
| · | a banking moratorium shall have been declared by the federal or state authorities of the United States that results in a disruption of any of the markets on which our securities are trading; |
| · | a material disruption shall have occurred in commercial banking or securities settlement or clearance services in the United States; |
| · | the United States shall have become engaged in hostilities, there shall have been an escalation in hostilities involving the United States, there shall have been a declaration of a national emergency or war by the United States or there shall have occurred any other national or international calamity or crisis such that market trading in our capital stock has been materially disrupted; or |
| · | there shall have occurred such a material adverse change in general domestic or international economic, political or financial conditions, including without limitation as a result of terrorist activities, or the effect of international conditions on the financial markets in the United States, that materially disrupts the capital markets such as to make it, in our judgment, impracticable or inadvisable to proceed with the offer and sale of the permitted securities. |
We will be excused from our obligations under the alternative payment mechanism in respect of any interest payment date if we provide written certification to the indenture trustee (which the indenture trustee will promptly forward upon receipt to each holder of record of Junior Subordinated Debentures) no more than 30 and no less than 10 business days in advance of that interest payment date certifying that:
| · | a market disruption event occurred after the immediately preceding interest payment date; and |
| · | either (a) the market disruption event continued for the entire period from the business day immediately following the preceding interest payment date to the business day immediately preceding the date on which that certification is provided or (b) the market disruption event continued for only part of this period, but we were unable after commercially reasonable efforts to raise sufficient eligible proceeds during the rest of that period to pay all accrued and unpaid interest. |
We will not be excused from our obligations under the alternative payment mechanism or our obligations in connection with the repayment of principal if we determine not to pursue or complete the sale of permitted securities due to pricing, dividend rate or dilution considerations.
Limitation on Claims in the Event of Our Bankruptcy, Insolvency or Receivership
The Junior Subordinated Indenture provides that a holder of Junior Subordinated Debentures, by that holder’s acceptance of the Junior Subordinated Debentures, agrees that in the event of our bankruptcy, insolvency or receivership prior to the redemption or repayment of such holder’s Junior Subordinated Debentures, that holder of Junior Subordinated Debentures will only have a claim for deferred and unpaid interest (including compounded interest thereon) to the extent such interest (including compounded interest thereon) relates to the earliest two years of the portion of the deferral period for which interest has not so been paid.
Early Redemption
The Junior Subordinated Debentures:
| · | are redeemable, in whole, but not in part, at our option at any time prior to March 15, 2017, and, in whole or in part, on any interest payment date on or after March 15, 2017, as described below; |
| · | are redeemable at any time, in whole but not in part, upon the occurrence of a “rating agency event” or a “tax event”, as described below; |
| · | are redeemable at any time, in whole but not in part, if we become obligated to pay additional amounts, as described below under “Additional Amounts”; and |
| · | are not subject to any sinking fund, a holder’s right to require us to purchase such holder’s Junior Subordinated Debentures or similar provisions; |
provided that any redemption of Junior Subordinated Debentures will be subject to the restrictions described in the Replacement Capital Covenant with respect to each series of Junior Subordinated Debentures.
In the case of a redemption on or after March 15, 2017, or if we become obligated to pay “additional amounts” other than as a result of an event that would, upon receipt of the opinion required under “tax event,” constitute a tax event, the redemption price will be equal to 100% of the principal amount of the applicable series of Junior Subordinated Debentures, plus accrued interest thereon to the date of redemption.
In the case of a redemption prior to March 15, 2017, the redemption price will be equal to:
| · | 100% of the principal amount of the applicable series of Junior Subordinated Debentures; or |
| · | as determined by the calculation agent, if greater, the sum of the present values of the remaining scheduled payments of principal (assuming for this purpose that the Junior Subordinated Debentures are to be redeemed at their principal amount on March 15, 2017) discounted from March 15, 2017, and interest thereon that would have been payable to and including March 15, 2017 (not including any portion of any payment of interest accrued to the redemption date) discounted from the relevant interest payment date to the redemption date on, in the case of the Series A-2 Junior Subordinated Debentures, a semi-annual basis (assuming a 360-day year consisting of twelve 30-day months) at the Sterling gross redemption yield (as determined by reference to the middle market price) at 11:00 a.m., London time, on the reference date of the Sterling reference bond, and in the case of the Series A-3 Junior Subordinated Debentures, an annual basis at the then current yield on the comparable Bundesobligationen issue plus (i) 0.50% in the case of any redemption in whole upon the occurrence of a “rating agency event” or a “tax event” or (ii) 0.15% or 0.25% for the Series A-2 Junior Subordinated Debentures and Series A-3 Junior Subordinated Debentures, respectively, in all other cases; |
plus, in either case, accrued interest on the Junior Subordinated Debentures to the date of redemption.
If we redeem or repay the Junior Subordinated Debentures when any deferred interest remains unpaid, the unpaid deferred interest (including compounded interest thereon) may only be paid pursuant to the alternative payment mechanism, as described under “Alternative Payment Mechanism” above.
The definitions of certain terms used in the paragraph above are listed below.
“Comparable Bundesobligationen issue” means the 3.750% German Bundesobligationen due January 4, 2017 or, if such security is no longer in issue, the German Bundesobligationen security selected by an independent investment bank selected by the calculation agent as having a maturity comparable to the term remaining from the redemption date to March 15, 2017 that would be utilized, at the time of selection and in accordance with customary financial practice, in pricing new issues of corporate debt securities of comparable maturity.
“Reference date” means the date which is three business days prior to the date fixed for redemption.
“Sterling gross redemption yield” means, the gross redemption yield on such security (as calculated by the calculation agent on the basis set out in the United Kingdom Debt Management Office in the paper “Formulae for Calculating Gilt Prices from Yields” page 4, Section One: Price/Yield Formulae “Conventional Gilts; Double-dated and Undated Gilts with Assumed (or Actual) Redemption on a Quasi-Coupon Date” (published on June 8, 1998 and updated on March 15, 2002 and as further updated or amended) on a semi-annual compounding basis (converted on an annualized yield and rounded up (if necessary) to four decimal places)).
“Sterling reference bond” means the 4.00% Treasury Stock due September 7, 2016, or if such stock is no longer in issue such other United Kingdom government stock with a maturity date as near as possible to March 15, 2017, as the calculation agent may, with the advice of the Sterling reference market makers, determine to be appropriate by way of substitution for the 4.00% Treasury Stock due September 7, 2016.
“Sterling reference market makers” means three brokers or market makers of gilts selected by the calculation agent.
For purposes of the above, a “tax event” means that we have requested and received an opinion of counsel experienced in such matters to the effect that, as a result of any:
| · | amendment to or change in the laws or regulations of the United States or any political subdivision or taxing authority of or in the United States that is enacted or becomes effective after the date of the prospectus supplement relating to the Junior Subordinated Debentures; |
| · | proposed change in those laws or regulations that is announced after the date of the prospectus supplement relating to the Junior Subordinated Debentures; |
| · | official administrative decision or judicial decision or administrative action or other official pronouncement interpreting or applying those laws or regulations that is announced after the date of the prospectus supplement relating to the Junior Subordinated Debentures; or |
| · | threatened challenge asserted in connection with an audit of us, or a threatened challenge asserted in writing against any other taxpayer that has raised capital through the issuance of securities that are substantially similar to the Junior Subordinated Debentures; |
there is more than an insubstantial risk that interest payable by us on the Junior Subordinated Debentures is not, or will not be, deductible by us, in whole or in part, for United States federal income tax purposes.
For purposes of the above, a “rating agency event” means a change by any nationally recognized statistical rating organization within the meaning of Rule 15c3-1 under the Securities Exchange Act of 1934, as amended (the “Exchange Act”), that currently publishes a rating for us (a “rating agency”) to its equity credit criteria for securities such as the Junior Subordinated Debentures, as such criteria was in effect on the date of the prospectus supplement relating to the Junior Subordinated Debentures (the “current criteria”), which change results in a lower equity credit being given to the Junior Subordinated Debentures as of the date of such change than the equity credit that would have been assigned to the Junior Subordinated Debentures as of the date of such change by such rating agency pursuant to its current criteria.
If less than all of the applicable series of the Junior Subordinated Debentures are to be redeemed at any time, selection of Junior Subordinated Debentures of the applicable series for redemption will be made by the indenture trustee under the Junior Subordinated Indenture in compliance with the rules and requirements of the New York Stock Exchange or the principal securities exchange, if any, on which such series of the Junior Subordinated Debentures is listed at the time of redemption or, if the such series of the Junior Subordinated Debentures is not so listed or that exchange prescribes no method of selection, on a pro rata basis, by lot or by such other method as the indenture trustee may deem fair and appropriate and which may provide for the selection for redemption of a portion of the principal amount of such series of the Junior Subordinated Debenture; provided that Junior Subordinated Debentures with a principal amount of €50,000 or less will not be redeemed in part.
We will issue a notice of redemption at least 10 but not more than 60 days before the redemption date. If any Junior Subordinated Debentures are to be redeemed in part only, the notice of redemption will state the portion of the principal amount thereof to be redeemed. A new Junior Subordinated Debenture in principal amount equal to the unredeemed portion thereof will be issued and delivered to the indenture trustee, or its nominee, or, in the case of Junior Subordinated Debentures in definitive form, issued in the name of the holder thereof, in each case upon cancellation of the original Junior Subordinated Debenture.
Additional Amounts
Subject to the exemptions and limitations set forth below, we will pay additional amounts (“additional amounts”) on the Junior Subordinated Debentures with respect to any beneficial owner of the Junior Subordinated Debentures that is a non U.S. person to ensure that each net payment to that non U.S. person on the Junior Subordinated Debentures that it beneficially owns will not be less, due to the payment of U.S. withholding tax, than the amount then otherwise due and payable. For this purpose, a “net payment” on a Junior Subordinated Debenture means a payment by us or any paying agent, including payment of principal and interest, after deduction for any present or future tax, assessment, or other governmental charge on the additional amounts. As used in this section, “U.S.” means the United States of America, including each state of the United States and the District of Columbia, its territories, its possessions, and other areas within its jurisdiction. Additional amounts are included in the interest on the Junior Subordinated Debentures.
We will not be required to make any payment of any tax, assessment or other governmental charge imposed by any government, political subdivision, or taxing authority of that government, except as provided in the prior paragraph. In addition, if we become obligated to pay additional amounts, other than as a result of an event that would, upon receipt of the opinion required under “tax event,” constitute a tax event, we may redeem the Junior Subordinated Debentures at any time in whole but not in part at 100% of their principal amount plus accrued and unpaid interest through the date of redemption as described above under “Early Redemption.”
We will not be required to pay additional amounts, however, in any of the circumstances described in items (1) through (13) below.
(1) Additional amounts will not be payable if a payment on the Junior Subordinated Debentures is reduced as a result of any tax, assessment or other governmental charge that is imposed or withheld solely by reason of the beneficial owner:
| · | having a relationship with the U.S. as a citizen, resident, or otherwise; |
| · | having had such a relationship in the past; or |
| · | being considered as having had such a relationship. |
(2) Additional amounts will not be payable if a payment on the Junior Subordinated Debentures is reduced as a result of any tax, assessment or other governmental charge that is imposed or withheld solely by reason of the beneficial owner:
| · | being treated as present in or engaged in a trade or business in the U.S.; |
| · | being treated as having been present in or engaged in a trade or business in the U.S. in the past; or |
| · | having or having had a permanent establishment in the U.S. |
(3) Additional amounts will not be payable if a payment on the Junior Subordinated Debentures is reduced as a result of any tax, assessment or other governmental charge that is imposed or withheld solely by reason of the beneficial owner being or having been a:
| · | personal holding company; |
| · | foreign private foundation or other foreign tax-exempt organization; |
| · | passive foreign investment company; |
| · | controlled foreign corporation; or |
| · | corporation that has accumulated earnings to avoid U.S. federal income tax. |
(4) Additional amounts will not be payable if a payment on the Junior Subordinated Debentures is reduced as a result of any tax, assessment or other governmental charge that is imposed or withheld solely by reason of the beneficial owner owning or having owned, actually or constructively, 10% or more of the total combined voting power of all classes of our stock entitled to vote.
(5) Additional amounts will not be payable if a payment on the Junior Subordinated Debentures is reduced as a result of any tax, assessment or other governmental charge that is imposed or withheld solely by reason of the beneficial owner being a bank (i) purchasing Junior Subordinated Debentures in the ordinary course of its lending business or (ii) that is neither (A) buying the Junior Subordinated Debentures for investment purposes only nor (B) buying the Junior Subordinated Debentures for resale to a third-party that either is not a bank or holding the Junior Subordinated Debentures for investment purposes only.
For purposes of items (1) through (5) above, “beneficial owner” includes a fiduciary, settlor, partner, member, shareholder or beneficiary of the holder if the holder is an estate, trust, partnership, limited liability company, corporation or other entity, or a person holding a power over an estate or trust administered by a fiduciary holder.
(6) Additional amounts will not be payable to any beneficial owner of a Junior Subordinated Debenture that is:
| · | a fiduciary; |
| · | a partnership; |
| · | a limited liability company; |
| · | another fiscally transparent entity; or |
| · | not the sole beneficial owner of the Junior Subordinated Debenture, or any portion of the Junior Subordinate Debenture. |
However, this exception to the obligation to pay additional amounts will apply only to the extent that a beneficiary or settlor in relation to the fiduciary, or a beneficial owner, partner, or member of the partnership, limited liability company or other fiscally transparent entity, would not have been entitled to the payment of an additional amount had the beneficiary, settlor, beneficial owner, partner, or member received directly its beneficial or distributive share of the payment.
(7) Additional amounts will not be payable if a payment on the Junior Subordinated Debentures is reduced as a result of any tax, assessment or other governmental charge that is imposed or withheld by reason of the failure of the beneficial owner or any other person to comply with applicable certification, identification, documentation or other information reporting requirements. This exception to the obligation to pay additional amounts will apply only if compliance with these reporting requirements is required as a precondition to exemption from such tax, assessment or other governmental charge by statute or regulation of the U.S. or by an applicable income tax treaty to which the U.S. is a party.
(8) Additional amounts will not be payable if a payment on the Junior Subordinated Debentures is reduced as a result of any tax, assessment or other governmental charge that is collected or imposed by any method other than by withholding from a payment on the applicable Junior Subordinated Debentures by us or any withholding agent (within the meaning of the applicable rules).
(9) Additional amounts will not be payable if a payment on the Junior Subordinated Debentures is reduced as a result of any tax, assessment or other governmental charge that is imposed or withheld by reason of the presentation by the beneficial owner for payment more than 30 days after the date on which such payment becomes due or is duly provided for, whichever occurs later.
(10) Additional amounts will not be payable if a payment on the Junior Subordinated Debentures is reduced as a result of any:
| · | estate tax; |
| · | inheritance tax; |
| · | gift tax; |
| · | sales tax; |
| · | excise tax; |
| · | transfer tax; |
| · | wealth tax; |
| · | personal property tax; or |
| · | similar tax, assessment, withholding, deduction or other governmental charge. |
(11) Additional amounts will not be payable if a payment on the Junior Subordinated Debentures is reduced as a result of any tax, assessment or other governmental charge required to be withheld by any withholding agent (within the meaning of the applicable rules) from a payment of principal or interest on the Junior Subordinated Debentures if that payment can be made without such withholding by any other withholding agent.
(12) Additional amounts will not be payable if a payment on the Junior Subordinated Debentures is reduced as a result of any tax, assessment or other governmental charge that is required to be made pursuant to any EU Directive on the taxation of savings income or any law implementing or complying with, or introduced to conform to, any such Directive.
(13) Additional amounts will not be payable if a payment on the Junior Subordinated Debentures is reduced as a result of any combination of items (1) through (12) above.
As used in this section the term “non U.S. person” means any person who, for U.S. federal income tax purposes is:
| · | a nonresident alien individual; |
| · | a foreign corporation; |
| · | a foreign partnership, one or more of the members of which, for U.S. federal income tax purposes, is a foreign corporation, a nonresident alien individual or a nonresident alien fiduciary of a foreign estate or trust; or |
| · | a nonresident alien fiduciary of an estate or trust that is not subject to U.S. federal income tax on a net income basis on income or gain from a Junior Subordinated Debenture. |
Events of Default
The following events are “events of default” with respect to each series of Junior Subordinated Debentures:
| · | default in the payment of interest, including compounded interest, in full on such series of Junior Subordinated Debenture for a period of 30 days after the conclusion of a 10-year period following the commencement of any deferral period; or |
| · | default in the payment of the principal on such series of Junior Subordinated Debenture at the final maturity date or upon a call for redemption; or |
| · | certain events of bankruptcy, insolvency and reorganization involving AIG. |
Remedies If an Event of Default Occurs
All remedies available upon the occurrence of an event of default under the junior debt indenture will be subject to the restrictions described below under “Subordination.” If an event of default occurs, the indenture trustee will have special duties. In that situation, the indenture trustee will be obligated to use its rights and powers under the junior debt indenture, and to use the same degree of care and skill in doing so, that a prudent person would use in that situation in conducting his or her own affairs. If an event of default of the type described in the first bullet point in the definition of that term has occurred and has not been cured, the indenture trustee or the holders of at least 25% in principal amount of the applicable series of Junior Subordinated Debentures may declare the entire principal amount of all the then outstanding Junior Subordinated Debentures of such series to be due and immediately payable. This is called a declaration of acceleration of maturity. If an event of default described in the third bullet point in the definition has occurred, the principal amount of all then outstanding Junior Subordinated Debentures will immediately become due and payable. In the case of any other default or breach of the Junior Subordinated Indenture by AIG, including an event of default under the second bullet point in the definition of that term, there is no right to declare the principal amount of the applicable series of Junior Subordinated Debentures immediately due and payable.
The holders of a majority in aggregate outstanding principal amount of each series of Junior Subordinated Debentures may, on behalf of the holders of such series of Junior Subordinated Debentures, waive any default or event of default, except an event of default under the second or third bullet point above or a default with respect to a covenant or provision which under the Junior Subordinated Indenture cannot be modified or amended without the consent of the holder of the applicable outstanding Junior Subordinated Debenture.
Except in cases of an event of default, where the indenture trustee has the special duties described above, the indenture trustee is not required to take any action under the junior debt indenture at the request of any holders unless the holders offer the indenture trustee reasonable protection from expenses and liability called an indemnity. If indemnity reasonably satisfactory to the indenture trustee is provided, the holders of a majority in principal amount of the applicable series of outstanding Junior Subordinated Debentures may direct the time, method and place of conducting any lawsuit or other formal legal action seeking any remedy available to the indenture trustee. These majority holders may also direct the indenture trustee in performing any other action under the Junior Subordinated Indenture with respect to the applicable series of Junior Subordinated Debentures.
Before holders bypass the indenture trustee and bring their own lawsuit or other formal legal action or take other steps to enforce their rights or protect their interests under the Junior Subordinated Indenture, the following must occur:
| · | a holder of the applicable series of Junior Subordinated Debentures must give the indenture trustee written notice that an event of default has occurred and remains uncured; |
| · | the holders of 25% in principal amount of the applicable series of Junior Subordinated Debentures must make a written request that the indenture trustee take action because of the default, and they must offer reasonable indemnity to the indenture trustee against the cost, expenses and liabilities of taking that action; and |
| · | the indenture trustee must have not taken action for 60 days after receipt of the above notice and offer of indemnity. |
We will give to the indenture trustee every year a written statement of certain of our officers certifying that to their knowledge we are in compliance with the Junior Subordinated Indenture, or else specifying any default.
Subordination
Holders of the Junior Subordinated Debentures should recognize that contractual provisions in the junior debt indenture may prohibit us from making payments on the Junior Subordinated Debentures. The Junior Subordinated Debentures are subordinate and junior in right of payment, to the extent and in the manner stated in the junior debt indenture, to all of our senior debt, as defined in the Junior Subordinated Indenture.
The Junior Subordinated Indenture defines “senior debt” as all indebtedness and obligations of, or guaranteed or assumed by, us:
| · | for borrowed money; |
| · | evidenced by bonds, debentures, notes or other similar instruments; and |
| · | that represent obligations to policyholders of insurance or investment contracts |
in each case, whether existing now or in the future, and all amendments, renewals, extensions, modifications and refundings of any indebtedness or obligations of that kind. Senior debt will also include: any subordinated or junior subordinated debt that by its terms is not expressly pari passu or subordinated to the Junior Subordinated Debentures; all guarantees of securities issued by any trust, partnership or other entity affiliated with us that is, directly or indirectly, our financing vehicle; and intercompany debt. The Junior Subordinated Debentures will rank pari passu with the outstanding parity securities. The junior debt indenture does not restrict or limit in any way our ability to incur senior debt.
Senior debt excludes:
| · | trade accounts payable and accrued liabilities arising in the ordinary course of business; and |
| · | the outstanding parity securities and any other indebtedness, guarantee or other obligation that is specifically designated as being subordinate, or not superior, in right of payment to the Junior Subordinated Debentures. |
As a result, except upon the occurrence of an event described in the next paragraph, the Junior Subordinated Debentures will rank equally with trade accounts payable and accrued liabilities.
The Junior Subordinated Indenture provides that, unless all principal of and any premium or interest on the senior debt has been paid in full, no payment or other distribution may be made with respect to any Junior Subordinated Debentures in the following circumstances:
| · | in the event of any insolvency or bankruptcy proceedings, or any receivership, liquidation, reorganization, assignment for creditors or other similar proceedings or events involving us or our assets; or |
| · | any event of default with respect to any senior debt for borrowed money having at the relevant time an aggregate outstanding principal amount of at least $100 million has occurred and is continuing and has been accelerated (unless the event of default has been cured or waived or ceased to exist and such acceleration has been rescinded); or |
| · | in the event the Junior Subordinated Debentures have been declared due and payable prior to March 15, 2067. |
If the indenture trustee under the Junior Subordinated Indenture or any holders of the Junior Subordinated Debentures receive any payment or distribution that is prohibited under the subordination provisions, then the indenture trustee or the holders will have to repay that money to the holders of the senior debt.
The subordination provisions do not prevent the occurrence of an event of default. This means that the indenture trustee under the Junior Subordinated Indenture and the holders of the Junior Subordinated Debentures can take action against us, but they will not receive any money until the claims of the holders of senior debt have been fully satisfied.
Concerning the Trustee
The Bank of New York Mellon is the trustee under the Junior Subordinated Indenture and also the paying agent and the transfer agent and registrar for the Series A-9 Junior Subordinated Debentures. We have entered, and from time to time may continue to enter, into banking or other relationships with The Bank of New York Mellon or its affiliates.
Payment and Paying Agents
The paying agent for the Junior Subordinated Debentures will initially be the indenture trustee.
Notices
We and the indenture trustee will send notices regarding the Junior Subordinated Debentures only to holders, using their addresses as listed in the indenture trustee’s records.
Governing Law
The Junior Subordinated Indenture and the Junior Subordinated Debentures are be governed by, and construed in accordance with, the laws of the State of New York.
Exhibit 10.41
AMERICAN INTERNATIONAL
GROUP, INC.
2021 OMNIBUS INCENTIVE PLAN NON-EMPLOYEE DIRECTOR
DEFERRED STOCK UNITS AWARD AGREEMENT
This award agreement (this “Award Agreement”) sets forth the terms and conditions of an award (this “Award”) of deferred stock units (“DSUs”) in the amount and number set forth on Schedule A hereto (as amended or updated from time to time) granted to you under the American International Group, Inc. 2021 Omnibus Incentive Plan (as amended and restated from time to time, the “Plan”).
1. The Plan. This Award is made pursuant to the Plan, the terms of which are incorporated in this Award Agreement. Capitalized terms used in this Award Agreement which are not defined in this Award Agreement have the meanings as used or defined in the Plan.
2. Award. The number of DSUs set forth on Schedule A hereto are subject to this Award Agreement. The number of DSUs on Schedule A shall be determined by dividing the dollar amount of the Award (as set forth therein) by the closing sale price of Common Stock as reported by the New York Stock Exchange on the date of grant of such Award, without giving effect to extended or after hours trading, or, if the Common Stock is not traded on the New York Stock Exchange on the date of grant, by the Fair Market Value. Each DSU constitutes an unfunded and unsecured promise of AIG to deliver (or cause to be delivered) to you, subject to the terms of this Award Agreement, one share of Common Stock (a “Share” or “Shares” as the context requires) (or securities or other property equal to the Fair Market Value thereof) on the Payment Date as provided herein. Until such delivery, you have only the rights of a general unsecured creditor and no rights as a shareholder of AIG. In the event the calculation of the number of DSUs subject to this Award Agreement results in fractional shares, the number of Shares shall be rounded down to the next whole Share. THIS AWARD IS SUBJECT TO ALL TERMS, CONDITIONS AND PROVISIONS OF THE PLAN AND THIS AWARD AGREEMENT.
3. Payout.
(a) In General. Except as provided below in this Paragraph 3 and Paragraph 6, the Shares underlying the DSUs shall be paid on or promptly after the last Trading Day of the month in which you cease to provide services to the Company (the “Payment Date”), but no later than 90 days after you cease to provide services to the Company. Subject to the Plan, AIG may deliver securities or other property based on the Fair Market Value in lieu of all or any portion of the Shares otherwise deliverable on the Payment Date. You shall be the beneficial owner of any Shares at the close of business on the Payment Date and shall be entitled to any dividend or distribution that has not already been made with respect to such Shares if the record date for such dividend or distribution is on or after the close of business on the Payment Date. “Trading Day” means a day on which the Common Stock trades regular way on the New York Stock Exchange or, if the Common Stock is not then listed on the New York Stock Exchange, on the principal national or regional securities exchange on which the Common Stock is then listed or, if the Common Stock is not then listed on a national or regional securities exchange, on the principal other market on which the Common Stock is then traded.
(b) Death. Notwithstanding any other term or provision of this Award Agreement, if you die prior to the Payment Date, the Shares (or securities or other property in lieu of all or any portion thereof) corresponding to your outstanding DSUs shall be paid to the most recent beneficiary designated in writing by you to the Senior Vice President – Corporate Secretary and Deputy General Counsel or, in the absence of such a designation, to the representative of your estate promptly after your death (but no later than 90 days after your death).
(c) Delay of Payment. The Board may, in its sole discretion, determine to defer payment of DSUs or permit you to elect to defer payment of DSUs, in each case in a manner that conforms to the requirements of Section 409(a)(4) of the Code.
4. Dividend Equivalent Rights. On the last day of each calendar quarter before the payout of Shares (or securities or other property in lieu thereof) pursuant to this Award Agreement, you shall be paid an amount in incremental DSUs equal to any regular cash dividend payment that would have been distributed during such quarter in respect of the Shares (or securities or other property in lieu thereof) not yet delivered. The number of incremental DSUs awarded under this Paragraph 4 shall be based upon the closing sale price of a Share as reported by the New York Stock Exchange on the first day of the quarter succeeding the dividend payment date or, if the Common Stock is not then listed on the New York Stock Exchange, the Fair Market Value. In the event the calculation of the number of incremental DSUs to be awarded results in fractional DSUs (after taking into account all DSUs to be awarded to you in respect of such date), the number of incremental DSUs to be awarded shall be rounded down to the next whole number of DSUs. Incremental DSUs shall be DSUs subject to this Award Agreement, and payout of Shares (or securities or other property in lieu thereof) underlying incremental DSUs shall be made at the same time as for other DSUs in accordance with Paragraph 3. In the event that a regular cash dividend payment is paid during the calendar quarter in which you cease to provide services to the Company (but prior to the date on which you cease to provide services to the Company), you shall be entitled to receive an amount in cash equal to the actual dividend paid for that quarter in respect of the Shares not yet delivered, payment of which also shall be made at the same time as for DSUs in accordance with Paragraph 3.
5. Non-transferability. Except as may otherwise be provided in this Paragraph or as otherwise may be provided by the Board, the limitations set forth in Section 4.6 of the Plan shall apply. Any assignment in violation of the provisions of this Paragraph 5 shall be void. The Board may adopt procedures pursuant to which you may transfer some or all of your DSUs through a gift for no consideration to any child, stepchild, grandchild, parent, stepparent, grandparent, spouse, sibling, niece, nephew, mother-in-law, father-in-law, son-in-law, daughter-in-law, brother-in-law or sister-in-law, including adoptive relationships, any person sharing the recipient’s household (other than a tenant or employee), a trust in which these persons have more than 50% of the beneficial interest, and any other entity in which these persons (or the recipient) own more than 50% of the voting interests.
| -2- |
6. Withholding, Consents and Legends.
(a) The delivery of Shares is conditioned on your satisfaction of any applicable withholding taxes in accordance with Section 4.2 of the Plan.
(b) Your rights in respect of the DSUs are conditioned on the receipt to the full satisfaction of the Board of any required Consents (as defined in Section 4.3 of the Plan) that the Board may determine to be necessary or advisable; provided that if such Consent has not been so effected or obtained as of the latest date provided by this Award Agreement for the delivery of Shares (or securities or other property) in respect of any DSUs and further delay of delivery is not permitted in accordance with the requirements of Section 409A, such DSUs will be forfeited and terminate notwithstanding any prior vesting.
(c) AIG may affix to Certificates representing Shares issued pursuant to this Award Agreement any legend that the Board determines to be necessary or advisable. AIG may advise the transfer agent to place a stop order against any legended Shares.
7. Section 409A.
(a) DSUs awarded under this Award Agreement are intended to be “deferred compensation” subject to Section 409A of the Code, including any amendments or successor provisions to that section, and any regulations and other administrative guidance thereunder, in each case as they may be from time to time amended or interpreted through further administrative guidance (“Section 409A”), and this Award Agreement is intended to, and shall be interpreted, administered and construed to, comply with Section 409A with respect to the DSUs. The Board shall have full authority to give effect to the intent of this Paragraph 7(a). To the extent necessary to give effect to this intent, in the case of any conflict or potential inconsistency between the provisions of this Award Agreement and the provisions of the Plan, the Plan shall govern.
(b) Without limiting the generality of Paragraph 7(a), (i) references to your ceasing to provide services to the Company with respect to the DSUs shall mean your separation from service with the Company within the meaning of Section 409A (which, unless inconsistent with the foregoing, will mean your ceasing to be a director of the Board), and (ii) the right to payment of dividend equivalents pursuant to Paragraph 4 shall be treated separately from the right to payment of the Shares underlying the DSUs for all purposes of Section 409A.
(c) Any payment to be made under the DSUs in connection with termination of your Employment (and any other payment under the Plan) that would be subject to the limitations in Section 409A(a)(2)(b) of the Code shall be delayed until six months after termination of your Employment (or earlier death) in accordance with the requirements of Section 409A.
| -3- |
(d) To the extent necessary to comply with Paragraph 7(a), any securities or other property that the Company may deliver in respect of the DSUs shall not have the effect of deferring delivery or payment beyond the date on which such delivery or payment would occur with respect to the Shares that would otherwise have been deliverable (unless the Committee elects a later date for this purpose in accordance with Paragraph 3(c)).
(e) Each payment under the DSUs (including an award of incremental DSUs pursuant to Paragraph 4) shall be treated as a separate payment for purposes of Section 409A.
8. Successors and Assigns of AIG. The terms and conditions of this Award Agreement shall be binding upon and shall inure to the benefit of AIG and its successors and assigns.
9. Amendment. The Board reserves the right at any time to amend the terms and conditions set forth in this Award Agreement in any respect in accordance with Section 1.3 of the Plan, and the Board may amend the Plan in any respect in accordance with Section 4.1 of the Plan. Notwithstanding the foregoing and Sections 1.3 and 4.1 of the Plan, no such amendment shall materially adversely affect your rights and obligations under this Award Agreement without your consent (or the consent of your estate, if such consent is obtained after your death), and the Board may not accelerate or postpone the payout of the Shares (or securities or other property in lieu of any or all of the Shares) to occur at a time other than the applicable time provided for in this Award Agreement. Any amendment of this Award Agreement shall be in writing signed by an authorized member of the Board or any other person or persons authorized by the Board.
10. Governing Law. THIS AWARD SHALL BE GOVERNED BY AND CONSTRUED IN ACCORDANCE WITH THE LAWS OF THE STATE OF NEW YORK, WITHOUT REGARD TO PRINCIPLES OF CONFLICT OF LAWS.
11. Headings. The headings in this Award Agreement are for the purpose of convenience only and are not intended to define or limit the construction of the provisions hereof.
| -4- |
IN WITNESS WHEREOF, AIG and you have caused this Award Agreement to be duly executed and delivered.
| AMERICAN INTERNATIONAL GROUP, INC. | ||||
| By: | ||||
| Name: | Rose Marie E. Glazer | |||
Title: |
Executive Vice President, Chief Human Resources Officer and Corporate Secretary | |||
| Recipient: | ||
| Date: |
| Accepted and Agreed: | ||
| By: | ||
| -5- |
Schedule A
| Schedule of Awards | ||
| Date of Award | Award Amount | Number of DSUs1 |
| 1 | Determined by dividing the dollar amount listed in the applicable “Award Amount” column by the closing sale price of Common Stock on the New York Stock Exchange on the date of grant of such Award (or if the Common Stock is not traded on the New York Stock Exchange on the date of grant, by the Fair Market Value) rounded down to the nearest whole DSU. |
American International Group, Inc., and Subsidiaries
Subsidiaries of Registrant Exhibit 21
|
Percentage |
||||||||||||||||||||
|
of Voting |
||||||||||||||||||||
|
Securities |
||||||||||||||||||||
|
Jurisdiction of |
held by |
|||||||||||||||||||
|
Incorporation or |
Immediate |
|||||||||||||||||||
|
As of December 31, 2021 |
|
|
|
|
|
|
|
|
|
|
|
|
Organization |
|
Parent |
(1) |
||||
|
American International Group, Inc. |
Delaware |
0 |
(2) |
|||||||||||||||||
|
AIG Capital Corporation |
Delaware |
100 |
||||||||||||||||||
|
AIG Employee Services, Inc. |
Delaware |
100 |
||||||||||||||||||
|
AIG Federal Savings Bank |
Delaware |
100 |
||||||||||||||||||
|
AIG Financial Products Corp. |
Delaware |
100 |
||||||||||||||||||
|
AIG Matched Funding Corp. |
Delaware |
100 |
||||||||||||||||||
|
AIG-FP Pinestead Holdings Corp. |
Delaware |
100 |
||||||||||||||||||
|
AIG Markets, Inc. |
Delaware |
100 |
||||||||||||||||||
|
AIG Property Casualty Inc. |
Delaware |
100 |
||||||||||||||||||
|
AIG Claims, Inc. |
Delaware |
100 |
||||||||||||||||||
|
AIG PC Global Services, Inc. |
Delaware |
100 |
||||||||||||||||||
|
AIG Property Casualty International, LLC |
Delaware |
100 |
||||||||||||||||||
|
AIG Insurance Management Services, Inc. |
Vermont |
100 |
||||||||||||||||||
|
Grand Isle SAC Limited |
Bermuda |
100 |
||||||||||||||||||
|
AIG International Holdings GmbH |
Switzerland |
100 |
||||||||||||||||||
|
AIG APAC HOLDINGS PTE. LTD. |
Singapore |
100 |
||||||||||||||||||
|
AIG Asia Pacific Insurance Pte. Ltd. |
Singapore |
100 |
||||||||||||||||||
|
AIG Australia Limited |
Australia |
100 |
||||||||||||||||||
|
AIG Insurance Hong Kong Limited |
Hong Kong |
100 |
||||||||||||||||||
|
AIG Insurance New Zealand Limited |
New Zealand |
100 |
||||||||||||||||||
|
AIG Korea Inc. |
Korea, Republic of |
100 |
||||||||||||||||||
|
AIG Malaysia Insurance Berhad |
Malaysia |
100 |
||||||||||||||||||
|
AIG Philippines Insurance, Inc. |
Philippines |
100 |
||||||||||||||||||
|
AIG Re-Takaful (L) Berhad |
Malaysia |
100 |
||||||||||||||||||
|
AIG Vietnam Insurance Company Limited |
Vietnam |
100 |
||||||||||||||||||
|
PT AIG Insurance Indonesia |
Indonesia |
100 |
||||||||||||||||||
|
AIG Insurance (Thailand) Public Company Limited |
Thailand |
92.86 |
||||||||||||||||||
|
AIG Canada Holdings Inc. |
Canada |
100 |
||||||||||||||||||
|
AIG Insurance Company of Canada |
Canada |
100 |
||||||||||||||||||
|
AIG Europe Holdings S.a.r.l |
Luxembourg |
100 |
||||||||||||||||||
|
AIG Europe S.A. |
Luxembourg |
100 |
||||||||||||||||||
|
AIG Global Reinsurance Operations |
Belgium |
100 |
||||||||||||||||||
|
AIG Holdings Europe Limited |
England and Wales |
100 |
||||||||||||||||||
|
AIG Israel Insurance Company Ltd |
Israel |
100 |
||||||||||||||||||
|
American International Group UK Limited |
England |
100 |
||||||||||||||||||
|
AIG Investments UK Limited |
England and Wales |
100 |
||||||||||||||||||
|
Talbot Holdings Ltd. |
Bermuda |
100 |
||||||||||||||||||
|
Talbot Underwriting Holdings Ltd. |
England and Wales |
100 |
||||||||||||||||||
|
Talbot Underwriting Ltd. |
England and Wales |
100 |
||||||||||||||||||
|
AIG Japan Holdings Kabushiki Kaisha |
Japan |
100 |
||||||||||||||||||
|
AIG General Insurance Co., Ltd. |
Japan |
100 |
||||||||||||||||||
|
American Home Assurance Co., Ltd. |
Japan |
100 |
||||||||||||||||||
|
AIG Latin America Investments, S.L. |
Spain |
100 |
||||||||||||||||||
|
Inversiones Segucasai, C.A. |
Venezuela |
100 |
||||||||||||||||||
|
C.A. de Seguros American International |
Venezuela |
94.4 |
||||||||||||||||||
|
AIG Brazil Holding I, LLC |
Delaware |
100 |
||||||||||||||||||
|
AIG Seguros Brasil S.A. |
Brazil |
90.56 |
(3) |
|||||||||||||||||
|
AIG Resseguros Brasil S.A. |
Brazil |
100 |
||||||||||||||||||
|
AIG Insurance Company-Puerto Rico |
Puerto Rico |
100 |
||||||||||||||||||
|
AIG Latin America I.I. |
Puerto Rico |
100 |
||||||||||||||||||
|
AIG Seguros Mexico, S.A. de C.V. |
Mexico |
100 |
||||||||||||||||||
|
American International Underwriters del Ecuador-Holding S.A. en Liquidación S.A. |
Ecuador |
100 |
||||||||||||||||||
|
AIG-Metropolitana Cia. de Seguros y Reaseguros S.A. |
Ecuador |
51.78 |
||||||||||||||||||
|
AIG MEA Holdings Limited |
United Arab Emirates |
100 |
||||||||||||||||||
|
AIG Egypt Insurance Company S.A.E. |
Egypt |
95.08 |
||||||||||||||||||
|
AIG CIS Investments, LLC |
Russian Federation |
99.99 |
||||||||||||||||||
|
AIG Insurance Company, JSC |
Russian Federation |
100 |
||||||||||||||||||
|
AIG Lebanon SAL |
Lebanon |
100 |
||||||||||||||||||
|
AIG MEA Limited |
United Arab Emirates |
100 |
||||||||||||||||||
|
AIG Kenya Insurance Company Limited |
Kenya |
66.67 |
||||||||||||||||||
|
AIG Uganda Limited |
Uganda |
100 |
||||||||||||||||||
|
Johannesburg Insurance Holdings (Proprietary) Limited |
South Africa |
100 |
||||||||||||||||||
|
AIG Life South Africa Limited |
South Africa |
100 |
||||||||||||||||||
|
AIG South Africa Limited |
South Africa |
100 |
||||||||||||||||||
|
AIG Travel, Inc. |
Delaware |
100 |
||||||||||||||||||
|
AIG Travel Assist, Inc. |
Delaware |
100 |
||||||||||||||||||
|
AIG Travel Asia Pacific Pte. Ltd. |
Singapore |
100 |
||||||||||||||||||
|
AIG Travel Assist Malaysia Sdn. Bhd. |
Malaysia |
100 |
||||||||||||||||||
|
AIG Travel EMEA Limited |
England and Wales |
100 |
||||||||||||||||||
|
Travel Guard Group Canada, Inc./Groupe Garde Voyage du Canada, Inc. |
Canada |
100 |
||||||||||||||||||
|
Travel Guard Group, Inc. |
Wisconsin |
100 |
||||||||||||||||||
|
American International Reinsurance Company, Ltd. |
Bermuda |
100 |
||||||||||||||||||
|
Validus Holdings, Ltd. |
Bermuda |
100 |
||||||||||||||||||
|
Validus Reinsurance, Ltd. |
Bermuda |
100 |
||||||||||||||||||
|
Validus Holdings (UK) Ltd. |
England and Wales |
100 |
||||||||||||||||||
|
Validus Reinsurance (Switzerland) Ltd |
Switzerland |
100 |
||||||||||||||||||
|
Validus Ventures Ltd. |
Bermuda |
100 |
||||||||||||||||||
|
AlphaCat Managers Ltd. |
Bermuda |
100 |
||||||||||||||||||
|
PCG 2019 Corporate Member Limited |
England and Wales |
100 |
||||||||||||||||||
|
AIG Property Casualty U.S., Inc. |
Delaware |
100 |
||||||||||||||||||
|
AIG Aerospace Insurance Services, Inc. |
Georgia |
100 |
||||||||||||||||||
|
AIG Assurance Company |
Illinois |
100 |
||||||||||||||||||
|
AIG Property Casualty Company |
Illinois |
100 |
||||||||||||||||||
|
AIG Specialty Insurance Company |
Illinois |
100 |
||||||||||||||||||
|
AIG WarrantyGuard, Inc. |
Delaware |
100 |
||||||||||||||||||
|
AIU Insurance Company |
New York |
100 |
||||||||||||||||||
|
American Home Assurance Company |
New York |
100 |
||||||||||||||||||
|
AIG Insurance Company China Limited |
China |
100 |
||||||||||||||||||
|
Commerce and Industry Insurance Company |
New York |
100 |
||||||||||||||||||
|
Eaglestone Reinsurance Company |
Pennsylvania |
100 |
||||||||||||||||||
|
Arthur J. Glatfelter Agency, Inc. |
Pennsylvania |
100 |
||||||||||||||||||
|
Glatfelter Underwriting Services, Inc. |
Pennsylvania |
100 |
||||||||||||||||||
|
Volunteer Firemen's Insurance Services, Inc. |
Pennsylvania |
100 |
||||||||||||||||||
|
Granite State Insurance Company |
Illinois |
100 |
||||||||||||||||||
|
Illinois National Insurance Co. |
Illinois |
100 |
||||||||||||||||||
|
Lexington Insurance Company |
Delaware |
100 |
||||||||||||||||||
|
Pine Street Real Estate Holdings Corp. |
New Hampshire |
100 |
||||||||||||||||||
|
National Union Fire Insurance Company of Pittsburgh, Pa. |
Pennsylvania |
100 |
||||||||||||||||||
|
American International Realty LLC |
Delaware |
100 |
||||||||||||||||||
|
National Union Fire Insurance Company of Vermont |
Vermont |
100 |
||||||||||||||||||
|
New Hampshire Insurance Company |
Illinois |
100 |
||||||||||||||||||
|
Risk Specialists Companies Insurance Agency, Inc. |
Massachusetts |
100 |
||||||||||||||||||
|
Service Net Warranty, LLC |
Delaware |
100 |
||||||||||||||||||
|
The Insurance Company of the State of Pennsylvania |
Illinois |
100 |
||||||||||||||||||
|
Crop Risk Services, Inc. |
Illinois |
100 |
||||||||||||||||||
|
Western World Insurance Company |
New Hampshire |
100 |
||||||||||||||||||
|
Stratford Insurance Company |
New Hampshire |
100 |
||||||||||||||||||
|
Tudor Insurance Company |
New Hampshire |
100 |
||||||||||||||||||
|
Lexington Specialty Insurance Agency, Inc. |
Delaware |
100 |
||||||||||||||||||
|
AIG Technologies, Inc. |
New Hampshire |
100 |
||||||||||||||||||
|
AIG Global Operations, Inc. |
Delaware |
100 |
||||||||||||||||||
|
AM Holdings LLC |
Delaware |
100 |
||||||||||||||||||
|
Blackboard U.S. Holdings, Inc. |
Delaware |
100 |
||||||||||||||||||
|
Blackboard Specialty Insurance Company |
Delaware |
100 |
||||||||||||||||||
|
Blackboard Insurance Company |
Delaware |
100 |
||||||||||||||||||
|
SAFG Retirement Services, Inc. |
Delaware |
100 |
||||||||||||||||||
|
AIG Life Holdings, Inc. |
Texas |
100 |
||||||||||||||||||
|
AGC Life Insurance Company |
Missouri |
100 |
||||||||||||||||||
|
AIG Life of Bermuda, Ltd. |
Bermuda |
100 |
||||||||||||||||||
|
American General Life Insurance Company |
Texas |
100 |
||||||||||||||||||
|
SunAmerica Asset Management, LLC |
Delaware |
100 |
||||||||||||||||||
|
AIG Capital Services, Inc. |
Delaware |
100 |
||||||||||||||||||
|
The United States Life Insurance Company in the City of New York |
New York |
100 |
||||||||||||||||||
|
The Variable Annuity Life Insurance Company |
Texas |
100 |
||||||||||||||||||
|
VALIC Financial Advisors, Inc. |
Texas |
100 |
||||||||||||||||||
|
Valic Retirement Services Company |
Texas |
100 |
||||||||||||||||||
|
SAFG Capital LLC |
Delaware |
100 |
||||||||||||||||||
|
AIG Global Asset Management Holdings Corp. |
Delaware |
100 |
||||||||||||||||||
|
AIG Asset Management (Europe) Limited |
England and Wales |
100 |
||||||||||||||||||
|
AIG Asset Management (U.S.), LLC |
Delaware |
100 |
||||||||||||||||||
|
AIG Global Real Estate Investment Corp. |
Delaware |
100 |
||||||||||||||||||
|
AIGGRE Europe Real Estate Fund I GP S.a r.l. |
Luxembourg |
100 |
||||||||||||||||||
|
AIGGRE U.S. Real Estate Fund I GP, LLC |
Delaware |
100 |
||||||||||||||||||
|
AIGGRE U.S. Real Estate Fund II GP, LLC |
Delaware |
100 |
||||||||||||||||||
|
AIGGRE Europe Real Estate Fund II GP S.a r.l. |
Luxembourg |
100 |
||||||||||||||||||
|
AIGGRE U.S. Real Estate Fund III GP, LP |
Delaware |
100 |
||||||||||||||||||
|
AIGGRE U.S. Real Estate Fund IV GP, LLC |
Delaware |
100 |
||||||||||||||||||
|
AIG Credit Management, LLC |
Delaware |
100 |
||||||||||||||||||
|
AIG Life Limited |
England and Wales |
100 |
||||||||||||||||||
|
Laya Healthcare Limited |
Ireland |
100 |
||||||||||||||||||
|
(1) |
Percentages include directors' qualifying shares. |
|||||||||||||||||||
|
(2) |
Substantially all subsidiaries listed are consolidated in the accompanying financial statements. Certain subsidiaries have been omitted from the |
|||||||||||||||||||
|
tabulation. The omitted subsidiaries, when considered in the aggregate, do not constitute a significant subsidiary. |
||||||||||||||||||||
|
(3) |
Also owned 9.44 percent by AIG Brazil Holding II, LLC. |
|||||||||||||||||||
CONSENT OF INDEPENDENT REGISTERED PUBLIC ACCOUNTING FIRM
We hereby consent to the incorporation by reference in the Registration Statements on Form S-3 (No.333-253312) and Form S-8 (No.333-31346, No.333-101640, No.333-168679, No.333-219180 and No. 333-256033) of American International Group, Inc. of our report dated February 17, 2022 relating to the financial statements, financial statement schedules and the effectiveness of internal control over financial reporting, which appears in this Form 10-K.
/s/ PricewaterhouseCoopers LLP
New York, New York
February 17, 2022
I, Peter Zaffino, certify that:
1. I have reviewed this Annual Report on Form 10-K of American International Group, Inc.;
2. Based on my knowledge, this report does not contain any untrue statement of a material fact or omit to state a material fact necessary to make the statements made, in light of the circumstances under which such statements were made, not misleading with respect to the period covered by this report;
3. Based on my knowledge, the financial statements, and other financial information included in this report, fairly present in all material respects the financial condition, results of operations and cash flows of the registrant as of, and for, the periods presented in this report;
4. The registrant’s other certifying officer and I are responsible for establishing and maintaining disclosure controls and procedures (as defined in Exchange Act Rules 13a-15(e) and 15d-15(e)) and internal control over financial reporting (as defined in Exchange Act Rules 13a-15(f) and 15d-15(f)) for the registrant and have:
(a) Designed such disclosure controls and procedures, or caused such disclosure controls and procedures to be designed under our supervision, to ensure that material information relating to the registrant, including its consolidated subsidiaries, is made known to us by others within those entities, particularly during the period in which this report is being prepared;
(b) Designed such internal control over financial reporting, or caused such internal control over financial reporting to be designed under our supervision, to provide reasonable assurance regarding the reliability of financial reporting and the preparation of financial statements for external purposes in accordance with generally accepted accounting principles;
(c) Evaluated the effectiveness of the registrant’s disclosure controls and procedures and presented in this report our conclusions about the effectiveness of the disclosure controls and procedures, as of the end of the period covered by this report based on such evaluation; and
(d) Disclosed in this report any change in the registrant’s internal control over financial reporting that occurred during the registrant’s most recent fiscal quarter (the registrant’s fourth fiscal quarter in the case of an annual report) that has materially affected, or is reasonably likely to materially affect, the registrant’s internal control over financial reporting; and
5. The registrant’s other certifying officer and I have disclosed, based on our most recent evaluation of internal control over financial reporting, to the registrant’s auditors and the audit committee of the registrant’s board of directors (or persons performing the equivalent functions):
(a) All significant deficiencies and material weaknesses in the design or operation of internal control over financial reporting which are reasonably likely to adversely affect the registrant’s ability to record, process, summarize and report financial information; and
(b) Any fraud, whether or not material, that involves management or other employees who have a significant role in the registrant’s internal control over financial reporting.
Date: February 17, 2022
|
|
/S/ PETER ZAFFINO |
|
|
Peter Zaffino |
|
|
Chairman and Chief Executive Officer |
CERTIFICATIONS
I, Shane Fitzsimons, certify that:
1. I have reviewed this Annual Report on Form 10-K of American International Group, Inc.;
2. Based on my knowledge, this report does not contain any untrue statement of a material fact or omit to state a material fact necessary to make the statements made, in light of the circumstances under which such statements were made, not misleading with respect to the period covered by this report;
3. Based on my knowledge, the financial statements, and other financial information included in this report, fairly present in all material respects the financial condition, results of operations and cash flows of the registrant as of, and for, the periods presented in this report;
4. The registrant’s other certifying officer and I are responsible for establishing and maintaining disclosure controls and procedures (as defined in Exchange Act Rules 13a-15(e) and 15d-15(e)) and internal control over financial reporting (as defined in Exchange Act Rules 13a-15(f) and 15d-15(f)) for the registrant and have:
(a) Designed such disclosure controls and procedures, or caused such disclosure controls and procedures to be designed under our supervision, to ensure that material information relating to the registrant, including its consolidated subsidiaries, is made known to us by others within those entities, particularly during the period in which this report is being prepared;
(b) Designed such internal control over financial reporting, or caused such internal control over financial reporting to be designed under our supervision, to provide reasonable assurance regarding the reliability of financial reporting and the preparation of financial statements for external purposes in accordance with generally accepted accounting principles;
(c) Evaluated the effectiveness of the registrant’s disclosure controls and procedures and presented in this report our conclusions about the effectiveness of the disclosure controls and procedures, as of the end of the period covered by this report based on such evaluation; and
(d) Disclosed in this report any change in the registrant’s internal control over financial reporting that occurred during the registrant’s most recent fiscal quarter (the registrant’s fourth fiscal quarter in the case of an annual report) that has materially affected, or is reasonably likely to materially affect, the registrant’s internal control over financial reporting; and
5. The registrant’s other certifying officer and I have disclosed, based on our most recent evaluation of internal control over financial reporting, to the registrant’s auditors and the audit committee of the registrant’s board of directors (or persons performing the equivalent functions):
(a) All significant deficiencies and material weaknesses in the design or operation of internal control over financial reporting which are reasonably likely to adversely affect the registrant’s ability to record, process, summarize and report financial information; and
(b) Any fraud, whether or not material, that involves management or other employees who have a significant role in the registrant’s internal control over financial reporting.
Date: February 17, 2022
|
|
/S/ SHANE FITZSIMONS |
|
|
Shane Fitzsimons |
|
|
Executive Vice President and |
|
|
Chief Financial Officer |
In connection with this Annual Report on Form 10-K of American International Group, Inc. (the “Company”) for the year ended December 31, 2021, as filed with the Securities and Exchange Commission on the date hereof (the “Report”), I, Peter Zaffino, Chairman and Chief Executive Officer of the Company, certify, pursuant to 18 U.S.C. Section 1350, that to my knowledge:
(1) The Report fully complies with the requirements of Section 13(a) or 15(d), as applicable, of the Securities Exchange Act of 1934; and
(2) The information contained in the Report fairly presents, in all material respects, the financial condition and results of operations of the Company.
Date: February 17, 2022
|
|
/S/ PETER ZAFFINO |
|
|
Peter Zaffino |
|
|
Chairman and Chief Executive Officer |
The foregoing certification is being furnished solely pursuant to 18 U.S.C. Section 1350 and is not being filed as part of the Report or as a separate disclosure document.
CERTIFICATION
In connection with this Annual Report on Form 10-K of American International Group, Inc. (the “Company”) for the year ended December 31, 2021, as filed with the Securities and Exchange Commission on the date hereof (the “Report”), I, Shane Fitzsimons, Executive Vice President and Chief Financial Officer of the Company, certify, pursuant to 18 U.S.C. Section 1350, that to my knowledge:
(1) The Report fully complies with the requirements of Section 13(a) or 15(d), as applicable, of the Securities Exchange Act of 1934; and
(2) The information contained in the Report fairly presents, in all material respects, the financial condition and results of operations of the Company.
Date: February 17, 2022
|
|
/S/ SHANE FITZSIMONS |
|
|
Shane Fitzsimons |
|
|
Executive Vice President and |
|
|
Chief Financial Officer |
The foregoing certification is being furnished solely pursuant to 18 U.S.C. Section 1350 and is not being filed as part of the Report or as a separate disclosure document.